
Key takeaways
ICT W.E.N.T.
Read the full summary
ICT W.E.N.T. Series Part 3 of 5 teaches a three-timeframe, top-down directional-bias framework using a historical 2012 GBP/USD example. Position trading uses monthly, weekly, and daily charts, swing trading uses daily, four-hour, and one-hour charts, short-term trading uses four-hour, one-hour, and 15-minute charts, and day trading uses one-hour, 15-minute, and five-minute charts. The highest selected timeframe defines the premise and major support or resistance, the middle timeframe refines or manages the idea, and the lowest timeframe times entry. ICT classifies conditions as trending, reversing, or consolidating, treats a swing-low break near resistance or swing-high break near support as possible evidence of a structure shift, and defines an intermediate-term high by lower highs on both sides and an intermediate-term low by higher lows on both sides. The GBP/USD walkthrough narrows monthly support through weekly and daily charts, uses an hourly break above a prior swing high to support a bullish premise, and waits for a retracement rather than chasing the rally. Fibonacci retracements, measured moves, optimal trade entry, and named ICT patterns are secondary to higher-timeframe context and lower-timeframe confirmation. Directional bias does not guarantee accuracy or profitability, opposing long and short opportunities can coexist across trading horizons, and traders should accept uncertainty, missed trades, invalidation, and the gray area between entry and objective.
How we researched this article
BestProps used document-based research from primary firm sources, checked September 25, 2026. The complete source list, scope, limitations, and commercial-state record appear near the end of this article.

Watch: ICT W.E.N.T. Series – Part 3 of 5 (original source video)
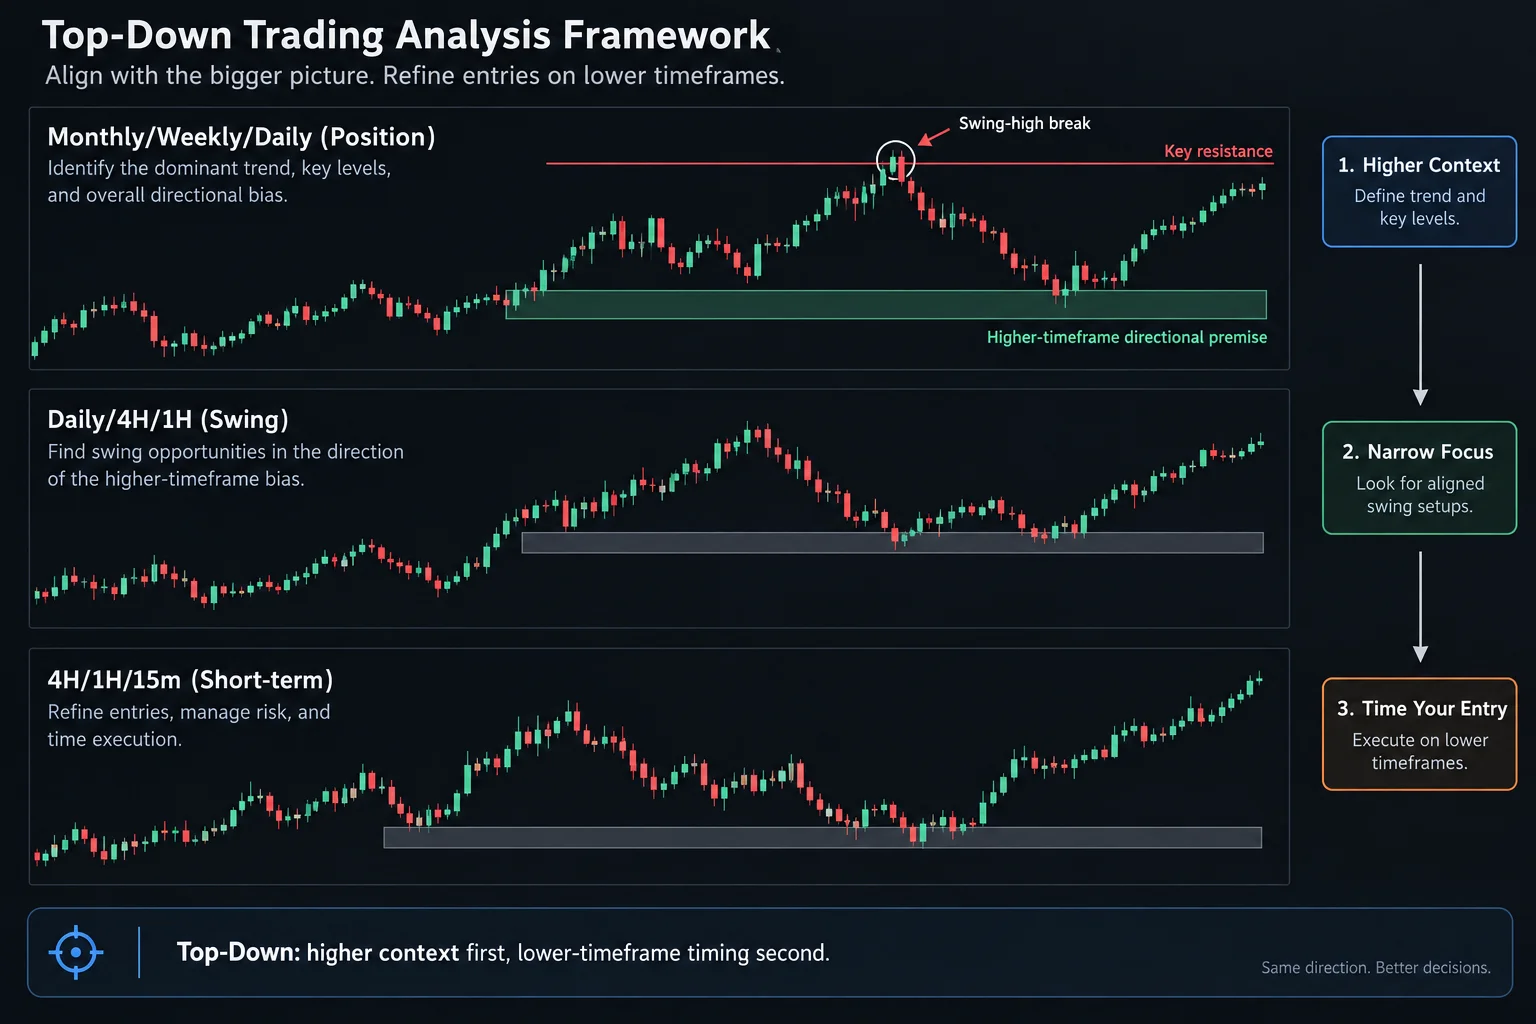
In ICT W.E.N.T. Series – Part 3 of 5, ICT presents a top-down framework for forming a directional bias from market structure. The central lesson is not that a trader can predict every move. Instead, ICT argues that traders should select timeframes appropriate to their style, identify higher-timeframe support and resistance, and wait for lower-timeframe price action to align with that premise.
The recording uses a historical GBP/USD example from 2012. Although the video was uploaded on October 23, 2017, the chart discussion refers to an earlier market period. The transcript alone cannot verify the displayed candles, quoted chart levels, hypothetical entries, trade fills, or outcomes.
ICT Part 3 Market Structure Lessons
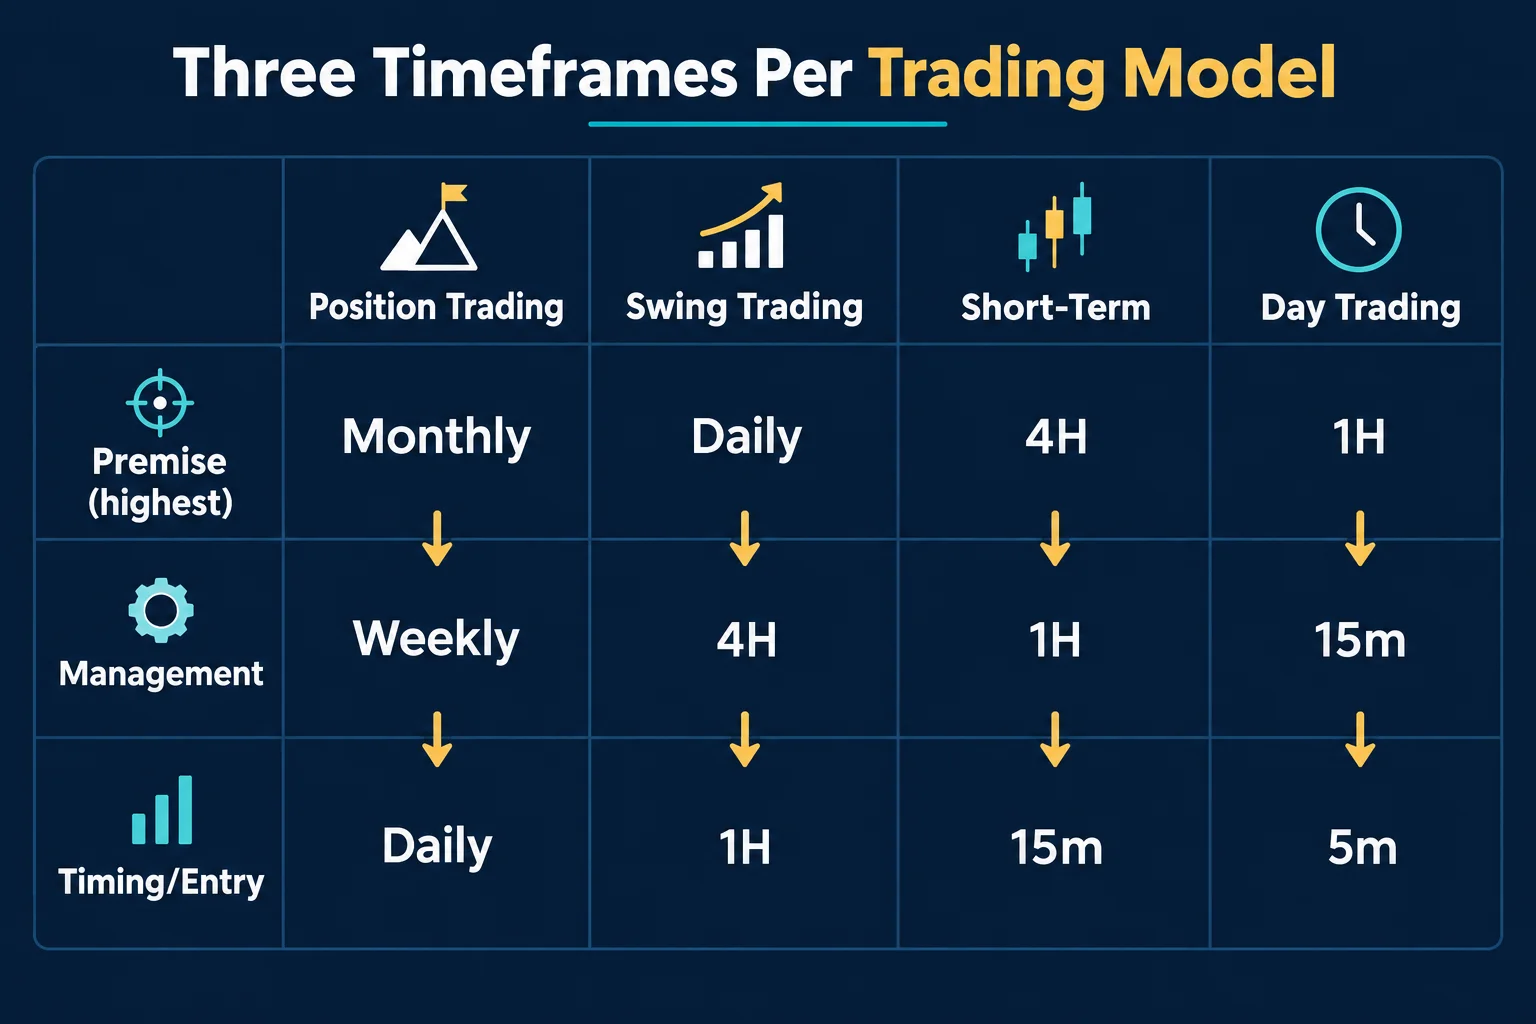
ICT begins by addressing the difficulty new traders face when moving among monthly, weekly, daily, hourly, and minute charts. At 1:27, he says the first objective is to identify the timeframe being traded. He then assigns three charts to each broad trading style:
- Position trading: monthly for the premise, weekly as the middle timeframe, and daily as the lower timeframe.
- Swing trading: daily for the premise, four-hour for management and refinement, and one-hour for timing.
- Short-term trading: four-hour for directional bias, one-hour as the trade timeframe, and 15-minute for entry timing.
- Day trading: one-hour for context, 15-minute for management, and five-minute for entry.
This hierarchy is explained beginning around 4:08. Its practical purpose is to prevent a low-timeframe fluctuation from being mistaken for the market’s broader structure. The highest of the three selected timeframes supplies the trade premise, the middle chart refines or manages it, and the lowest chart is used to look for an entry.
ICT Part 3 Support and Resistance Before Bias
At 8:47, ICT says he prefers trades aligned with the higher-timeframe direction, but immediately qualifies that idea: nearby major resistance or support can override a simple bullish or bearish reading. In his framework, directional bias must therefore be grounded in significant price levels rather than inferred from trend direction alone.
He also divides market conditions into broad profiles: trending, reversing, or consolidating. These profiles are intended to help a trader decide whether continuation, reversal, or range-based behavior is the more appropriate working hypothesis. This remains ICT’s interpretation of price behavior, not a demonstrated forecasting edge.
ICT Part 3 Market Structure Shifts
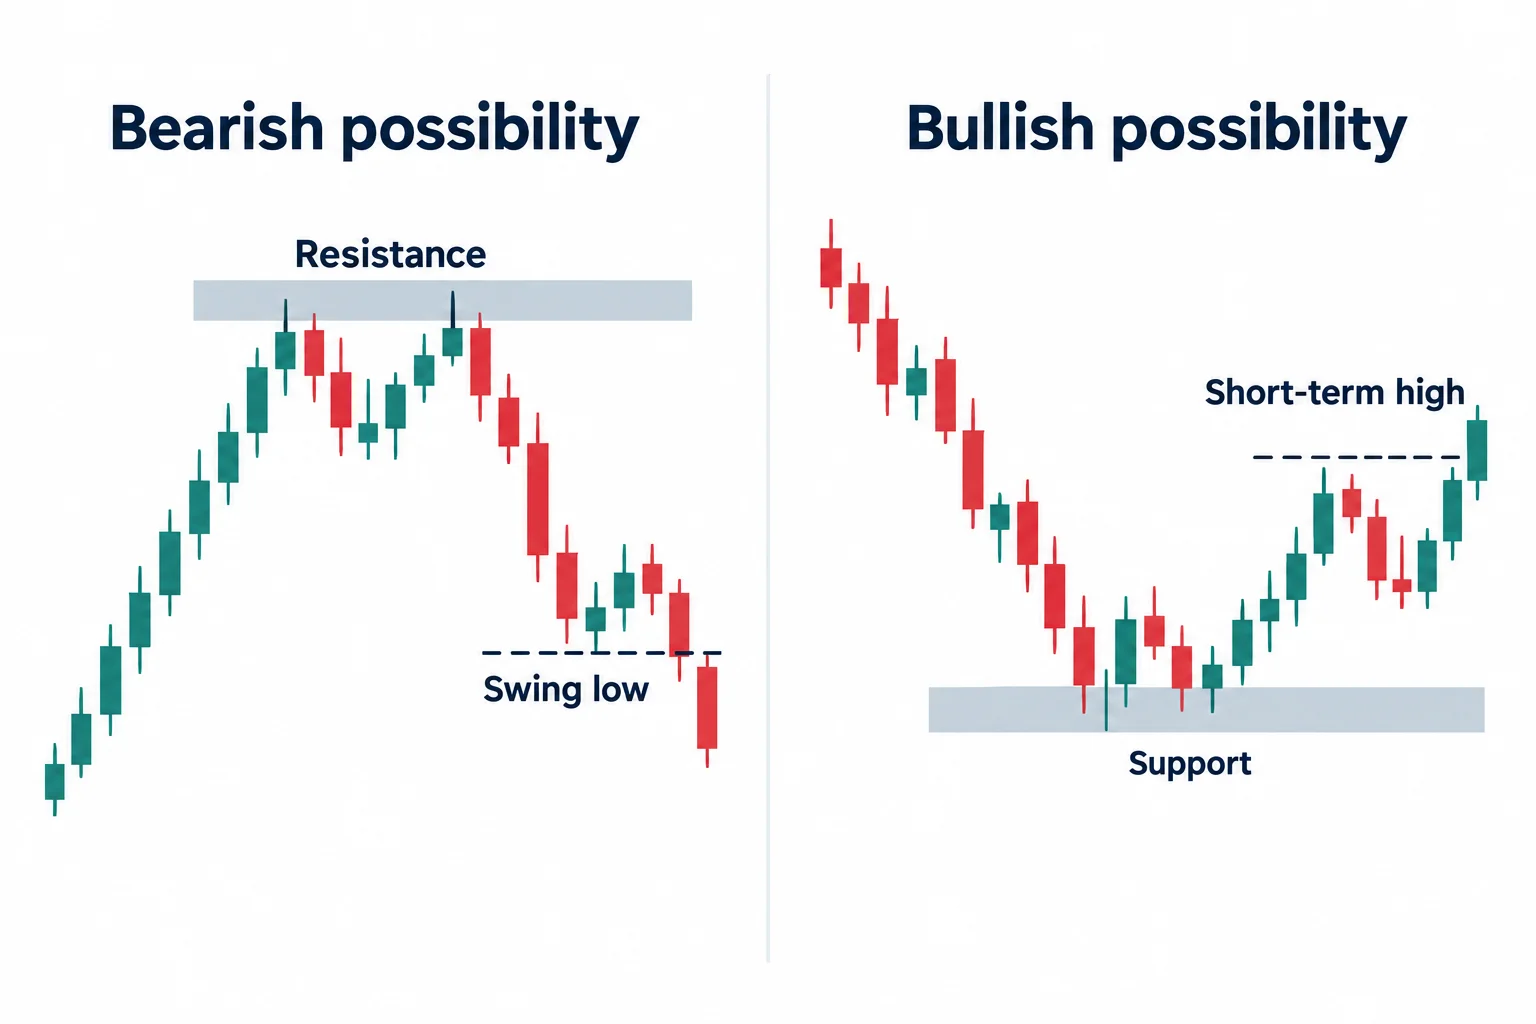
The conceptual example starting near 11:11 describes price rallying into higher-timeframe resistance and then breaking a recent swing low. ICT treats that break as evidence that bullish structure may be weakening. In the reverse case, price trading from support and breaking a short-term high may support a bullish premise.
He does not present the break as certainty. He repeatedly emphasizes the “gray area” between a possible entry and an expected objective: price may fail to reach the target or may reverse against the position. Retracements, consolidations, and prior swing points are used to organize possibilities, not to eliminate uncertainty.
ICT further distinguishes intermediate-term highs and lows at 28:19. In his terminology, an intermediate-term high has lower highs on both sides, while an intermediate-term low has higher lows on both sides. Marking these nested swing points is meant to clarify whether the current movement is short-, intermediate-, or longer-term within the selected timeframe.
ICT Part 3 Directional Bias by Timeframe
A useful qualification appears around 34:39: both upward and downward opportunities can exist on the same day. A position trader and a day trader may therefore hold opposite biases without logical contradiction because they are trading different portions of the same price movement.
ICT’s proposed process is to define a trading style first, derive a premise from its highest relevant timeframe, identify a support or resistance area, and then wait for a compatible setup on the lower chart. He warns against forcing a trade merely because another timeframe displays an attractive pattern.
ICT Part 3 GBP/USD Market Example
Beginning at 41:29, ICT applies the framework to GBP/USD, commonly called “cable.” The main historical walkthrough begins around 51:04 and concerns the summer of 2012.
ICT starts with a monthly consolidation and a prospective support region, then moves to weekly and daily charts to narrow that region. He subsequently uses an hourly chart to describe a break above a prior swing high as confirmation of a bullish structure shift. Rather than chasing the initial rally, his example waits for a retracement before considering an entry. The video later applies the same bullish premise to swing, short-term, and intraday models, changing the execution timeframe without repeatedly changing the higher-timeframe thesis.
The chart demonstration also uses Fibonacci retracements, measured moves, “optimal trade entry,” and named ICT patterns. Those tools are secondary to the lesson’s main structure: higher-timeframe context first, lower-timeframe timing second. Several labels are proprietary or only briefly defined in this transcript, so they should not be treated as self-explanatory rules.
ICT Part 3 Market Structure Takeaways
Near 2:04:53, ICT recaps the complete hierarchy: monthly–weekly–daily for position context, daily–four-hour–one-hour for swing trading, and four-hour–one-hour–15-minute for short-term trading. His broader message is to simplify analysis, accept missed trades, and avoid expecting a valid setup every day.
ICT explicitly acknowledges that directional bias does not guarantee accuracy or profitability at 39:17. As general educational practice, traders can use the lesson as a chart-review template: define the horizon, mark major levels, classify structure, record what would invalidate the premise, and evaluate the idea in simulation before considering real capital. This summary is educational commentary, not investment advice or a performance claim.
ICT Part 3 Sources
- ICT W.E.N.T. Series – Part 3 of 5 (original video) (primary source; timestamped references throughout).
- Inner Circle Trader education library ICT's methodology references for market structure, directional bias, and top-down analysis.


