
Key takeaways
ICT’s intraday framework combines weekly and daily directional bias, the Asian-session range, London timing, Fibonacci entries and extensions, predefined exits, and a maximum 2% risk per trade, while explicitly presenting the method as a demo-trading foundation rather than a proven edge.
Read the full summary
ICT’s intraday framework combines weekly and daily directional bias, the Asian-session range, London timing, Fibonacci entries and extensions, predefined exits, and a maximum 2% risk per trade, while explicitly presenting the method as a demo-trading foundation rather than a proven edge. The Asian range is the high and low formed from midnight to five in the morning GMT, preferably 40 pips or less, with caution above 40 pips and possible deferral to New York above 50 pips. During the preferred London window around seven to nine in the morning GMT, with activity sometimes beginning near six, traders seek a stop raid, false breakout, or Judas swing opposite the higher-time-frame bias before reversal, buying declines toward support in bullish conditions and selling rallies toward resistance in bearish conditions. Daily and four-hour charts define direction and major levels, the one-hour chart tracks weekly swings, and the 15-minute chart manages positions, including a trailing stop beyond the second-most-recent qualifying swing with a 10-pip example buffer. ICT favors scaling out around three to four in the afternoon GMT, closing strictly intraday exposure by six in the evening GMT, and loading the five-day average daily range projection only at ten in the morning GMT without treating it as a hard barrier. He pauses or limits London trading around interest-rate announcements, consequential speeches, holidays, unexpected events, completed weekly objectives, or unusually wide Asian ranges, and stresses planned invalidation, stop-loss use, partial exits, and demo testing without guaranteed profits.
How we researched this article
BestProps used document-based research from primary firm sources, checked September 25, 2026. The complete source list, scope, limitations, and commercial-state record appear near the end of this article.
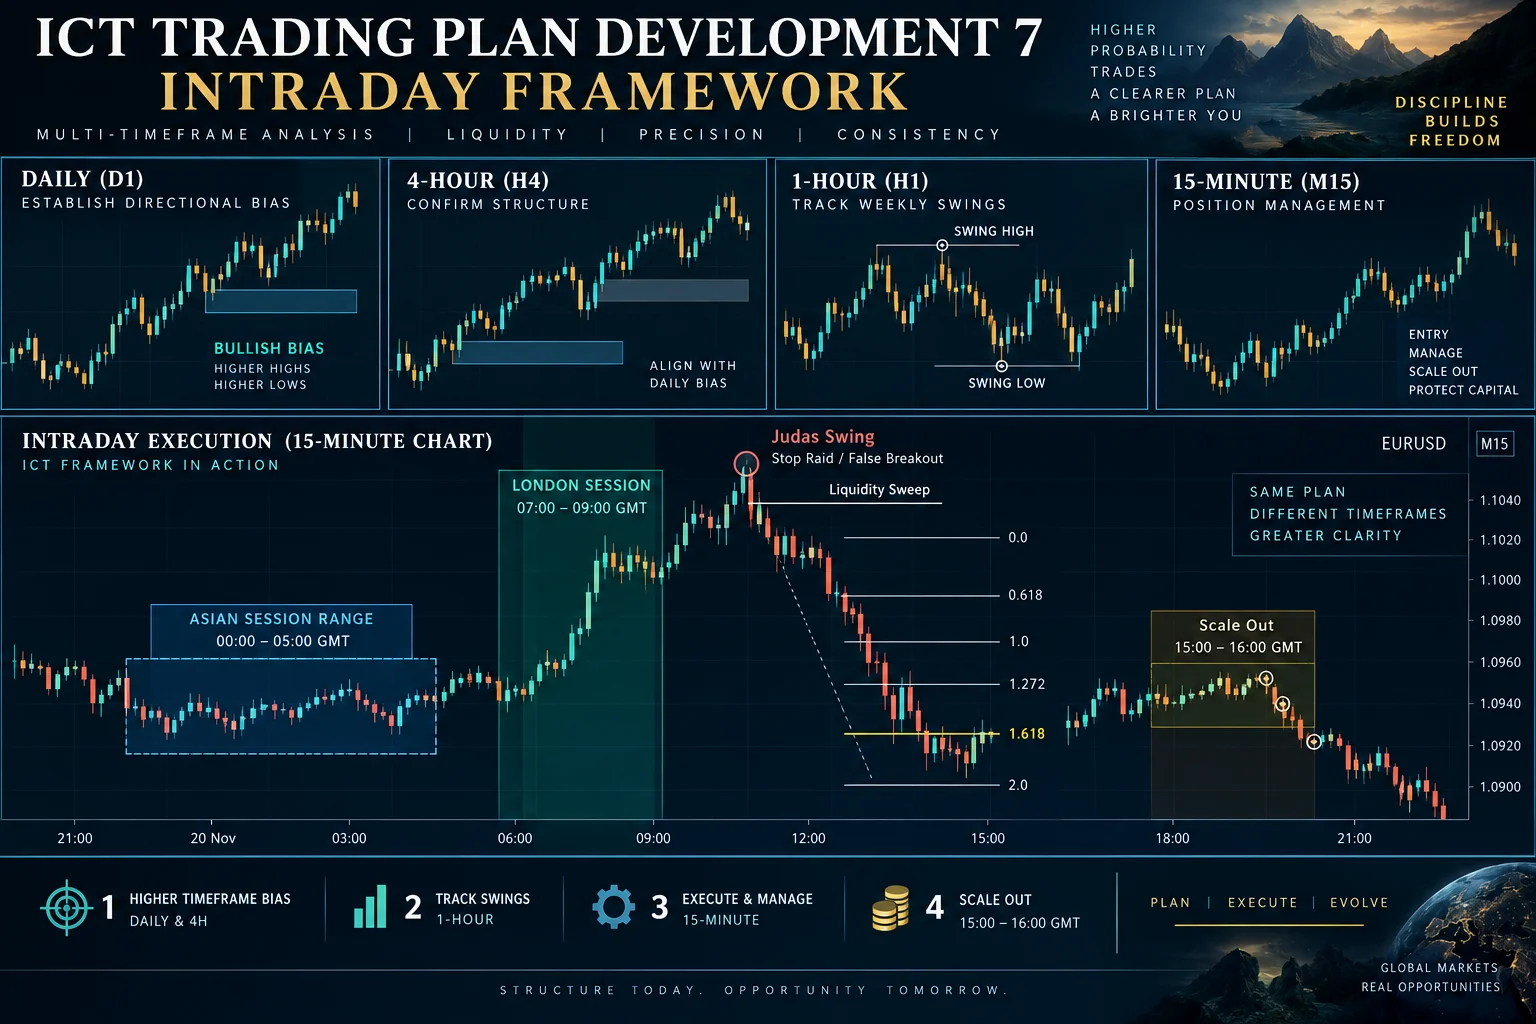
In ICT – Trading Plan Development 7, ICT concludes the series with a framework for intraday trading, particularly around the London session. The lesson combines higher-time-frame directional analysis, the Asian session range, London-session timing, Fibonacci-based entries and exits, and predefined risk controls.
This is ICT’s interpretation of market behavior, not proof that the described patterns produce a trading edge. He explicitly presents the material as a foundation for demo trading and later reiterates that the examples are informational rather than guaranteed setups.
Build the Basic ICT Intraday Plan
ICT introduces the plan at 1:33. His central rule is to align trades with his reading of market structure: seek buys when the higher-time-frame profile appears bullish and sells when it appears bearish. Entries are then filtered through support or resistance, what he calls an “optimal trade entry,” and time-of-day considerations.
He discusses Fibonacci extensions as possible profit objectives and says his entries and exits combine price levels with session timing. He also specifies a maximum risk of 2% per trade. That percentage is the speaker’s stated ceiling, not a recommendation appropriate for every trader or account.
Use the Asian Range in Your ICT Intraday Plan
Beginning around 4:58, ICT turns to the Asian range. He credits Chris Lori for introducing him to this way of organizing Forex price action. In this lesson, ICT defines the range as the high and low formed from 00:00 to 05:00 GMT. He treats midnight New York time as his operational start of a new day while retaining the preceding Asian-session action in his analysis.
ICT characterizes this window as an accumulation stage and watches for later movement beyond its high or low. Claims in the presentation about institutional orders, liquidity and “market makers” are ICT’s explanations of the observed pattern; the transcript does not provide order-book evidence that independently verifies those explanations.
Set Directional Bias for ICT Intraday Trades
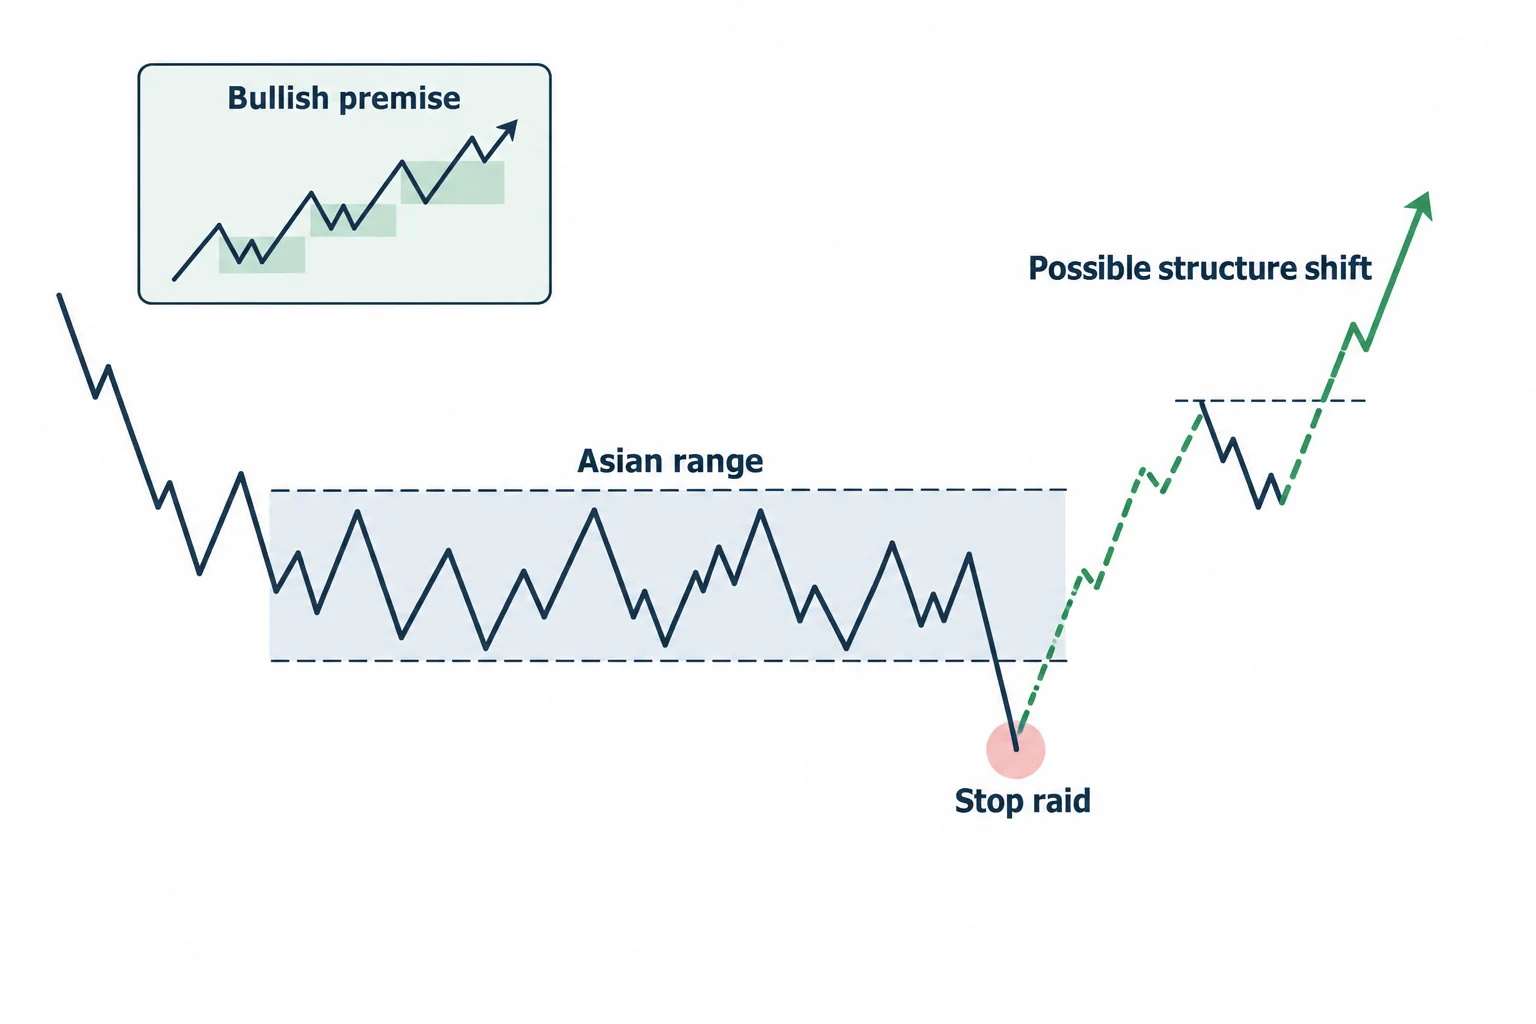
The session range is not intended to operate as a stand-alone breakout signal. At 12:53, ICT explains that he first forms a weekly and daily directional expectation. If he expects a bullish weekly candle, for example, he looks for a London-session low that could support a long setup. The bearish scenario reverses that logic.
His preferred London window is described as roughly 07:00–09:00 GMT, although nearby passages also discuss activity beginning around 06:00 GMT. Rather than chasing the first move outside the Asian range, ICT watches for what he calls a stop raid, false breakout or “Judas” swing: an initial move opposite the anticipated higher-time-frame direction, followed by a reversal toward that direction.
- Bullish framework: Look for a decline beneath or back into the Asian range toward higher-time-frame support, then evaluate whether market structure turns upward.
- Bearish framework: Look for a rally above or back into the range toward resistance, then evaluate whether market structure turns downward.
- Invalidation remains possible: ICT acknowledges at 46:20 that a proposed support level can fail and says this uncertainty is why stop-loss orders are used.
Follow the ICT Intraday Chart Framework
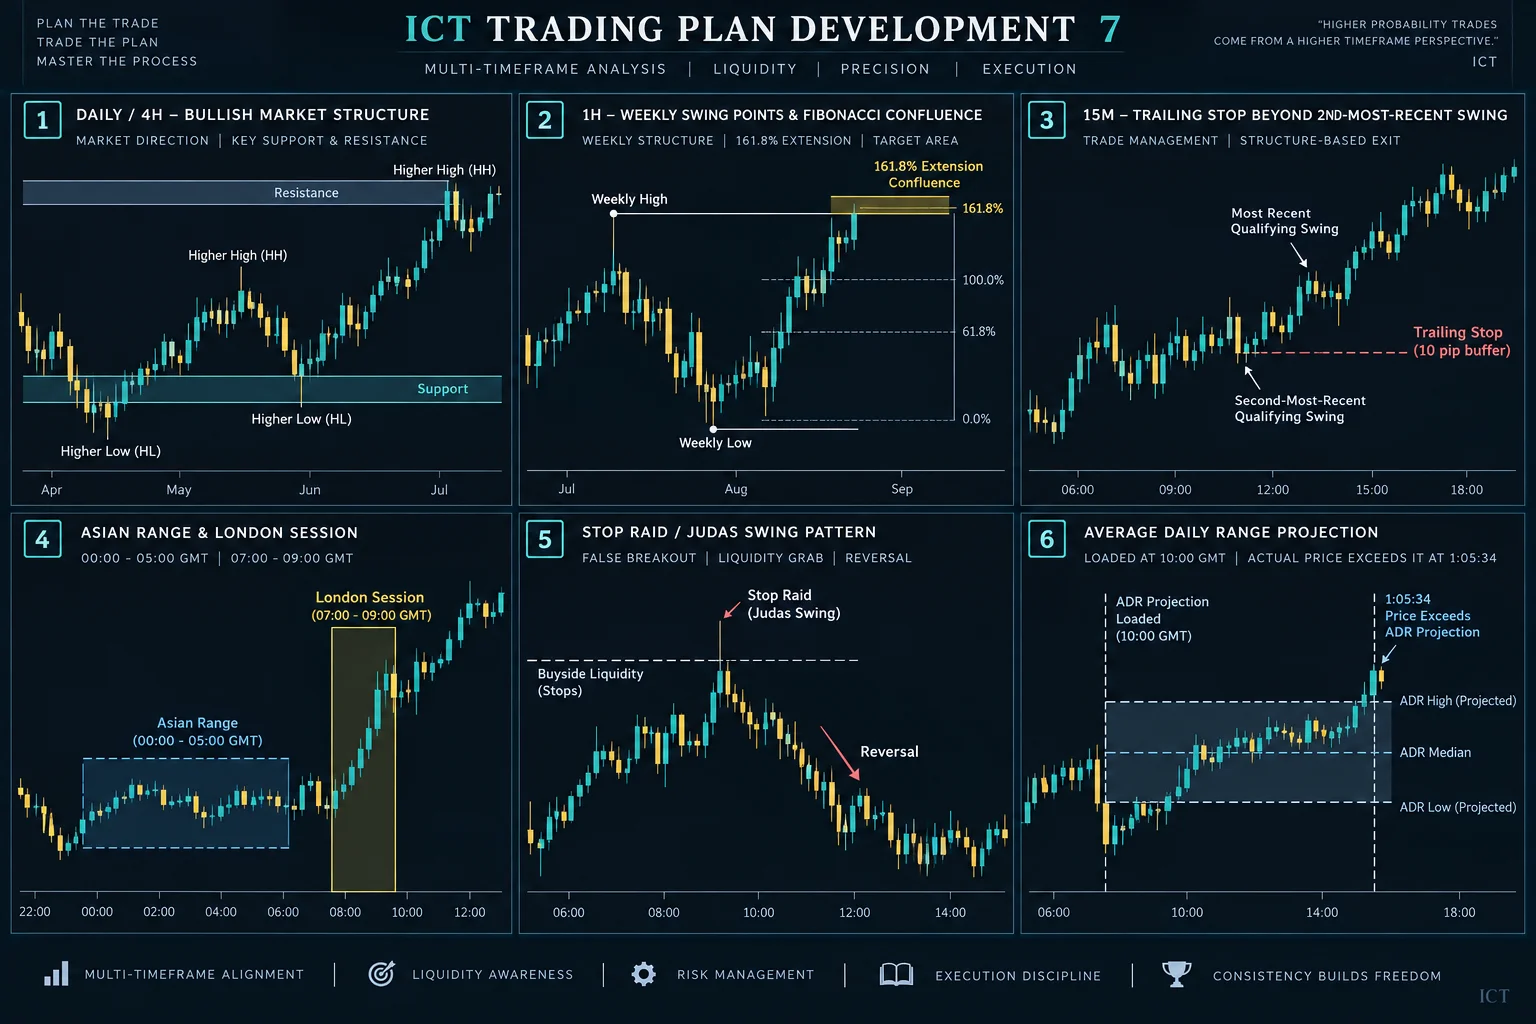
One of the clearest planning sections starts at 37:58. ICT assigns different jobs to different chart time frames:
- Use daily and four-hour charts to establish directional context and identify significant support, resistance and changes in market structure.
- Use the one-hour chart to follow swings and support or resistance during the week.
- Use the 15-minute chart to manage an open intraday position.
For trailing a position, he describes placing a stop beyond the second-most-recent qualifying 15-minute swing, with a 10-pip buffer in his example. This is a rule from his model, not a universally suitable distance. Volatility, instrument specifications and execution conditions are not evaluated in the transcript.
Set Profit Targets in Your ICT Trade Plan
ICT identifies 15:00–16:00 GMT as an important profit-taking window and discusses 18:00 GMT as a later limit for a position intended to remain strictly intraday. He recommends scaling out rather than assuming one price target will always mark the day’s extreme. He also cautions against tightening a stop so quickly that an ordinary New York-session retracement closes the trade prematurely.
At 49:29, he introduces a five-day average daily range projection. He says he does not load that projection until 10:00 GMT. Importantly, the final example beginning near 1:05:34 is intended to show that price can move beyond an average-range projection. ICT’s educational point is that average range should be one input among several, not an automatic barrier.
The captions describe a chart example and several price levels, but a transcript alone cannot verify the unseen chart, entry fill, spread, stop execution or final trade result. The more durable planning lesson is to define partial exits, invalidation and remaining-position management before acting.
When to Pause the ICT Intraday Plan
At 1:04:10, ICT lists conditions under which he avoids or limits London-session trading:
- interest-rate announcements or consequential scheduled speeches;
- holidays or sessions approaching a holiday;
- unexpected global or economic events;
- weekly objectives that he considers already reached; and
- an unusually wide Asian range.
He says a range of 40 pips or less is preferable in his framework and that readings above 40 make him cautious; he later mentions waiting for New York when the range exceeds 50 pips. These are discretionary thresholds stated by ICT, not independently tested rules.
Key Lessons for ICT Intraday Plan Development
The video’s practical contribution is its planning hierarchy: determine directional context, map a session range, wait for a setup during a defined time window, identify invalidation, plan partial exits and know when not to participate. ICT closes by reminding viewers to test the material in a demo account and rejects any implication of guaranteed profits. Any attempt to study this framework should likewise distinguish a repeatable written process from evidence of profitability.
Resources
- ICT – Trading Plan Development 7 (full video) — Primary source for all timestamped claims in this article.
- BabyPips.com — ICT’s original forum thread “What every new and/or aspiring Forex trader still wants to know” on the Newbie Island forum, referenced in the video as the foundational framework for the concepts taught.
- Risk Per Trade Calculator — BestProps tool for calculating position size based on account equity and risk percentage.


