
Key takeaways
ICT Trading Plan Development 6 presents an educational short-term market-structure framework for trades lasting intraday to about five days, targeting 50 to 150 pips while capping risk at 2% per trade, preferably 1% or 0.5% for new learners.
Read the full summary
ICT Trading Plan Development 6 presents an educational short-term market-structure framework for trades lasting intraday to about five days, targeting 50 to 150 pips while capping risk at 2% per trade, preferably 1% or 0.5% for new learners. ICT prioritizes higher-time-frame structure over temporary lower-time-frame flow, classifies nested short-term, intermediate-term, and long-term swing highs and lows using an approach attributed to Larry Williams, and limits principal support and resistance references to the one-hour chart or higher. The buy profile moves from consolidation near resistance toward higher-time-frame support and a potential bullish reversal, while the sell profile moves from consolidation near support toward higher-time-frame resistance and a potential bearish reversal. Bearish profiles can occur inside larger bullish profiles and vice versa, so traders are encouraged to specialize in one recognizable segment, establish the higher-time-frame premise first, and refine execution on 15-minute and five-minute charts. Trade management includes scaling out near prior highs, lows, consolidations, or other logical objectives and moving risk toward break-even after partial profit. An Australian dollar walkthrough uses daily, hourly, 15-minute, and five-minute views around a transcribed 101.50 level to illustrate consolidation, a structural break, retest, and movement toward prior consolidation. The lesson is not a mechanical system and requires concepts including optimal trade entry, Fibonacci extensions, price-pattern confluence, and Power of Three, while its performance claims, smart-money explanations, fills, pip totals, and chart outcomes are not independently verified.
How we researched this article
BestProps used document-based research from primary firm sources, checked September 25, 2026. The complete source list, scope, limitations, and commercial-state record appear near the end of this article.
ICT Trading Plan Development 6 Overview
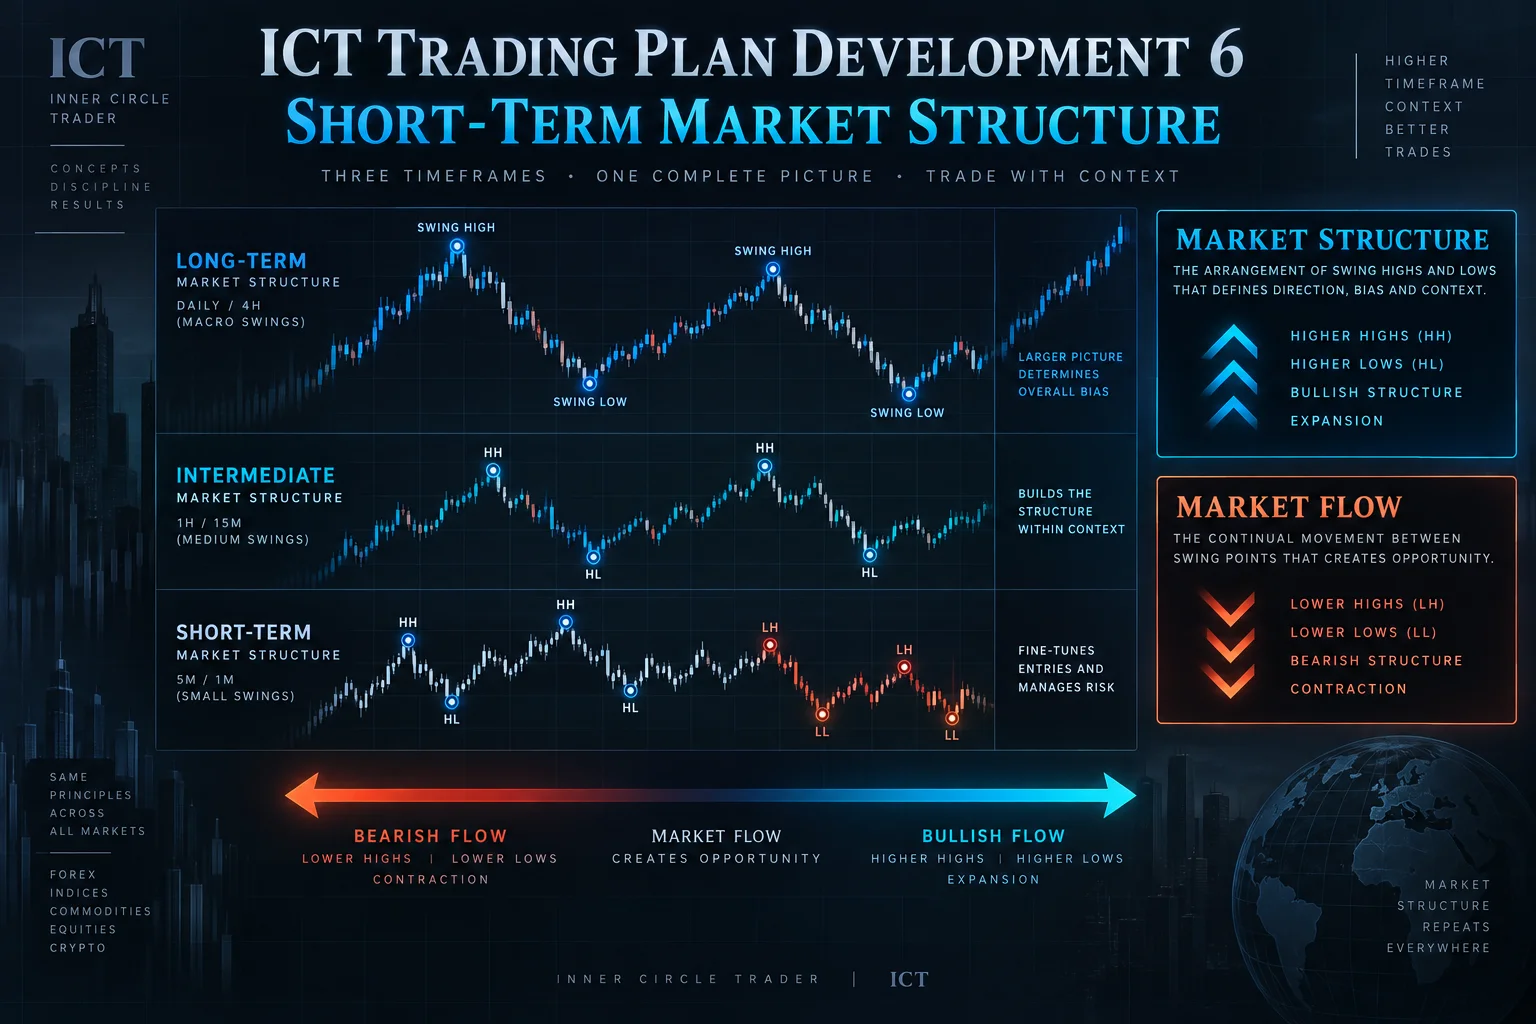
In ICT – Trading Plan Development 6, ICT outlines a short-term trading framework built around market structure, higher-time-frame support and resistance, and recurring buy and sell profiles. The lesson is not presented as a complete mechanical system. Instead, ICT asks viewers to combine the framework with concepts taught in his earlier modules, including what he calls optimal trade entry, Fibonacci extensions, price-pattern confluence, and Power of Three.
ICT defines a short-term trade as one lasting from an intraday entry and exit to no more than about five days. He states a target range of 50–150 pips per trade, but this is his planning objective, not evidence of an expected or repeatable result. The transcript does not document actual fills, independently verified performance, or the outcome of every chart example.
Short-Term Market Structure Over Market Flow
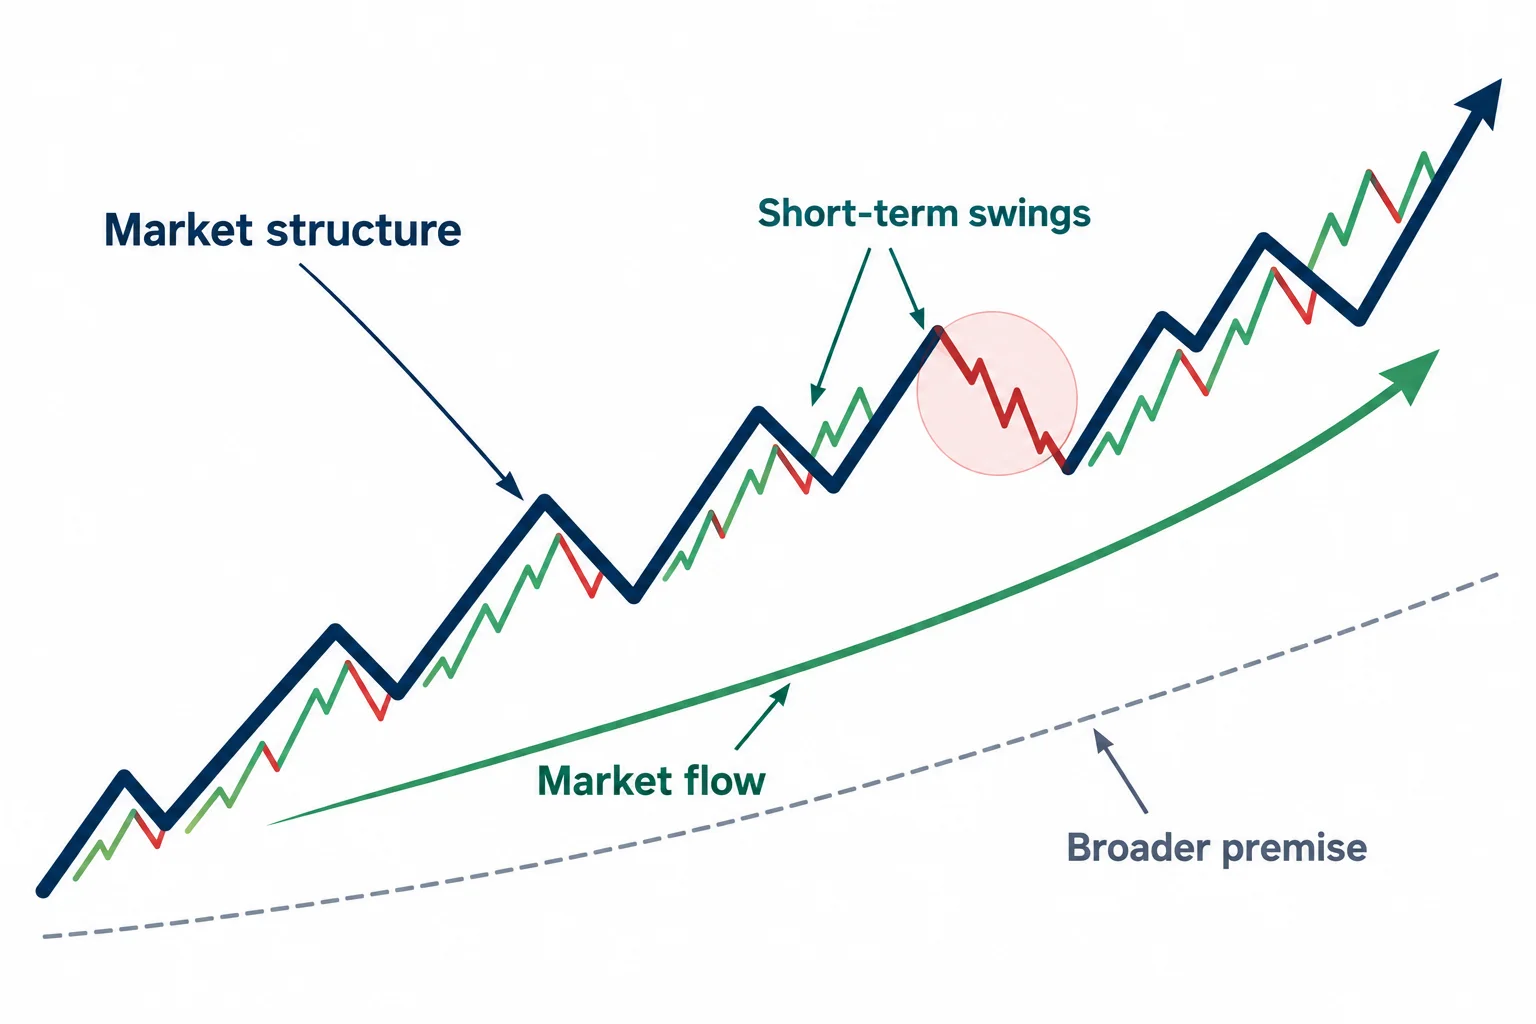
At 2:34, ICT distinguishes “market structure” from “market flow.” In his terminology, structure is the more important directional guide. Later, beginning around 28:50, he explains structure through nested swing highs and lows:
- A short-term low has higher lows on both sides; a short-term high has lower highs on both sides.
- An intermediate-term high or low is identified relative to surrounding short-term swings.
- A long-term swing is similarly classified relative to intermediate-term swings.
ICT attributes this swing-classification approach to Larry Williams. His key distinction is that lower-time-frame swings can temporarily turn down while the broader structure remains bullish, or turn up while the broader structure remains bearish. Therefore, a small countertrend movement (what he calls market flow) does not necessarily invalidate the larger directional premise.
As a practical observation exercise, ICT suggests zooming out or viewing the chart from farther away so that major swings become easier to see. This is intended to reduce fixation on very small price movements, not to provide an objective test of trend.
ICT Market Maker Trade Profiles
The buy profile begins at 10:20. In simplified form, ICT describes consolidation near resistance, a move lower toward higher-time-frame support, a possible reversal, and then an advance through earlier price ranges. A trader following his framework would look for bullish structure and supporting patterns around the anticipated support area.
The corresponding sell profile starts at 23:31. ICT reverses the logic: price consolidates around support, advances toward higher-time-frame resistance, and may then turn lower. He discusses using retracements after a structural break as possible entry areas and prior consolidations or swing lows as potential objectives.
These profiles are ICT’s interpretation of recurring price behavior. His claims about “smart money,” institutional accumulation, stop locations, and engineered price movement are explanatory assumptions within his model; the captions do not supply order-book or institutional-positioning evidence that would verify them.
Nested Market Profiles
A central point of the lesson is that a bearish profile may appear inside a larger bullish profile, and vice versa. Around 1:05:30, ICT explains that one trader might focus on the short decline inside a broader bullish move while another waits for the larger bullish setup. He encourages viewers to specialize in the segment they recognize most consistently rather than attempting to trade every leg.
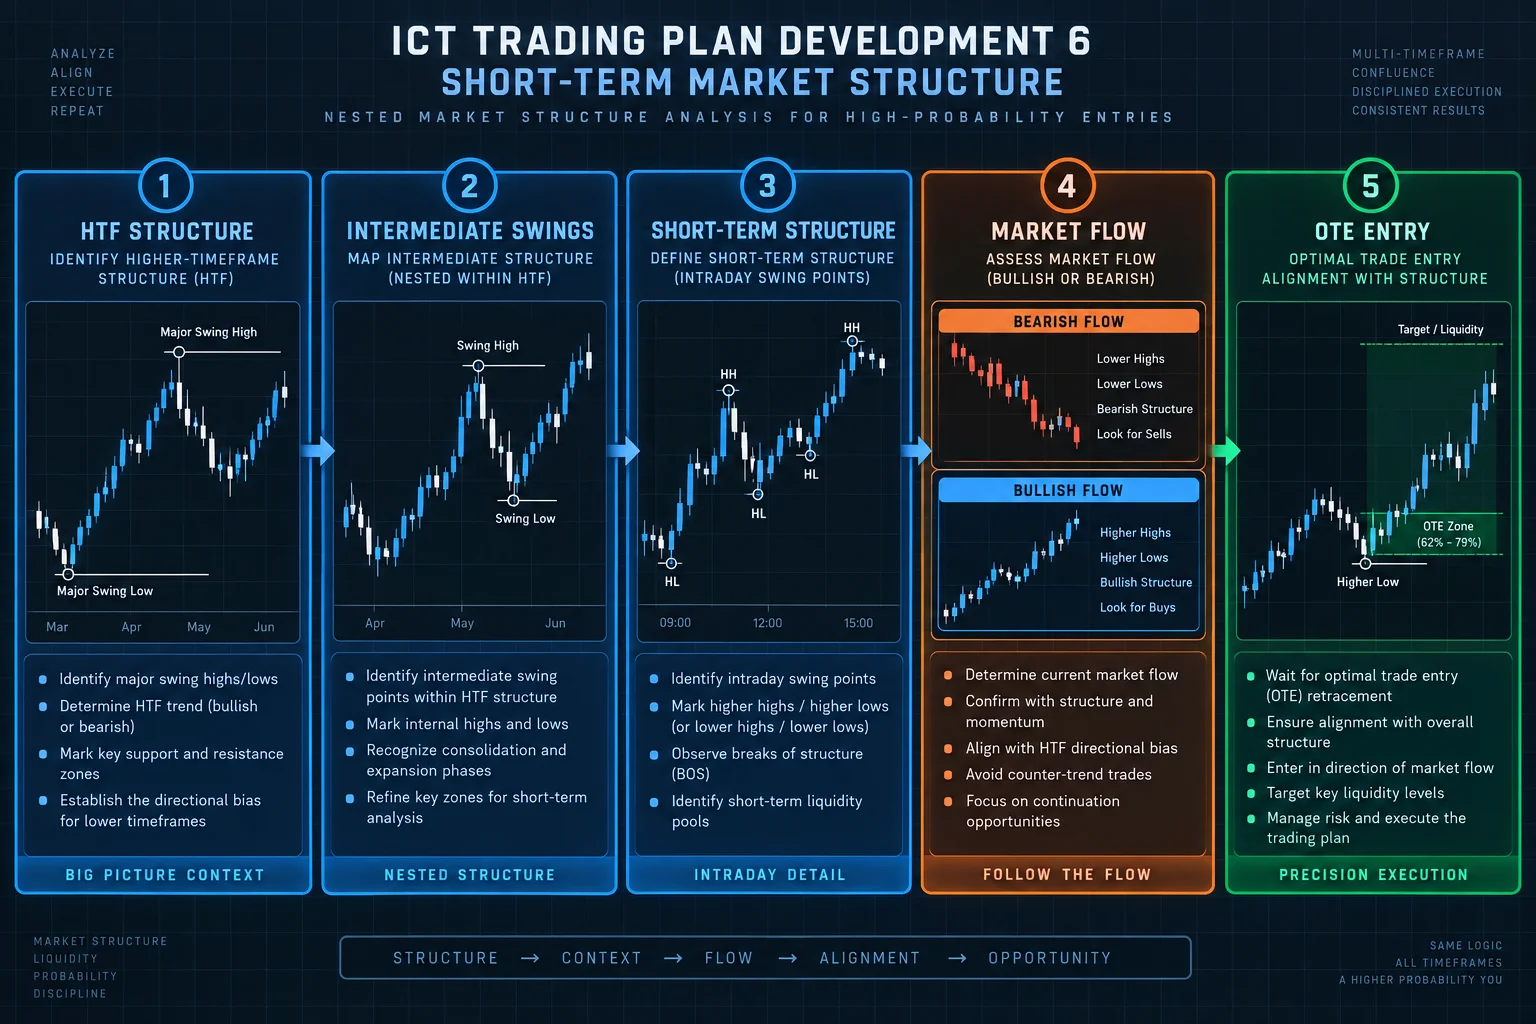
This nesting also explains why time-frame context matters. A pattern that appears incomplete on a five-minute chart may become clearer when viewed on a 15-minute or hourly chart. ICT’s broader lesson is to establish the higher-time-frame premise first and then use lower-time-frame behavior to refine observation and execution.
Market Structure Support Resistance and Trade Exits
From approximately 39:19, ICT describes how he interprets support and resistance conditionally. In a bullish market structure, he expects resistance to be more likely to break and later act as support. In a bearish market structure, he expects support to be more likely to break and later act as resistance. He limits his principal reference levels to the one-hour chart and higher in this presentation.
ICT repeatedly stresses taking profits near “logical” areas where he believes stop orders may be concentrated, such as prior highs or lows. In the buy-profile discussion at 19:13, he describes scaling out as price reaches possible resistance and moving risk toward break-even after partial profit. These are the speaker’s trade-management preferences, not guaranteed protections; gaps, slippage, and adverse moves are not evaluated in the transcript.
ICT Trading Plan Risk Management
At 5:05, ICT says risk should not exceed 2% per trade, describes 1% as preferable, and suggests 0.5% for a completely new learner, even when practicing on a demo account. His reasoning is psychological: large, rapid losses can make objective review difficult, while smaller exposure leaves room to study mistakes.
The broader educational takeaway is to define risk before looking for reward, rehearse on a simulator, and preserve enough emotional distance to review decisions. A percentage cap alone does not make a strategy safe or profitable, and moving a stop to break-even does not eliminate every execution risk.
ICT Market Structure Walkthrough for the Australian Dollar
Beginning at 47:21, ICT applies the framework to an Australian dollar chart. He discusses a level transcribed as “101.50,” then moves among daily, hourly, 15-minute, and five-minute views to identify nested profiles. Because the transcript cannot show the chart’s instrument formatting or decimal placement, that level should be checked directly against the video.
ICT presents the example as demonstrating consolidation near higher-time-frame support, an upward structural break, a retest, and eventual movement toward a prior consolidation. He also describes smaller bearish opportunities within the broader bullish profile. Any pip totals or prior forecasting claims in this section are ICT’s retrospective account; captions alone cannot verify entries, exits, timing, or subsequent performance.
Short-Term ICT Trading Study Plan
- Mark swing highs and lows without indicators.
- Classify the broader structure before examining lower-time-frame flow.
- Identify support and resistance on the hourly chart or higher.
- Study one portion of either the buy or sell profile instead of every possible setup.
- Record hypothetical entry, invalidation, target, and risk before checking what happened next.
- Review many historical examples and include failures, not only clean illustrations.
This converts the video into a testable learning exercise without assuming that ICT’s interpretations establish a trading edge. The material is educational and does not constitute investment advice.
ICT Trading Plan Resources
- ICT Trading Plan Development Series (Full Playlist) All six parts of ICT’s trading plan development series on YouTube.
- Market Structure Basics (BabyPips) Independent educational overview of swing high/low market structure concepts.
- Risk Management Fundamentals (Investopedia) General reference for position sizing and risk-per-trade principles.
- Understanding FX Futures (CME Group) Official exchange guide to currency futures specifications, including AUD/USD contract details.


