
Key takeaways
ICT Precision Trading Concepts 2 presents weekly order blocks as a top-down chart-reading framework, not a verified trading edge, using weekly structure to set directional context before refining entries on daily, four-hour, one-hour, 15-minute, or five-minute charts.
Read the full summary
ICT Precision Trading Concepts 2 presents weekly order blocks as a top-down chart-reading framework, not a verified trading edge, using weekly structure to set directional context before refining entries on daily, four-hour, one-hour, 15-minute, or five-minute charts. ICT seeks zones where price departed aggressively after spending little time, typically favoring a substantial bearish candle before a strong bullish advance while rejecting dojis, long-wicked candles, and structures that do not meet his criteria. A return to the zone is not an immediate entry signal and should be supported by lower-timeframe behavior plus timing around the London open, New York open, or London close. Weekly levels are treated as reference areas rather than exact prices, with violations potentially followed by an inversion from resistance to support. Prior highs or lows serve as objectives, and unusually clean highs may be exceeded under ICT’s liquidity framework. Trades originating from weekly structure should not be managed solely by five-minute or 15-minute fluctuations, with ICT instead discussing break-even stops, partial reductions, and retaining a smaller position for a larger move. The historical chart examples, pip ranges, prices, fills, and dollar outcomes are hypothetical or unverified, and the lesson provides no testing for profitability after spreads, slippage, failed setups, or selection bias.
How we researched this article
BestProps used document-based research from primary firm sources, checked September 25, 2026. The complete source list, scope, limitations, and commercial-state record appear near the end of this article.
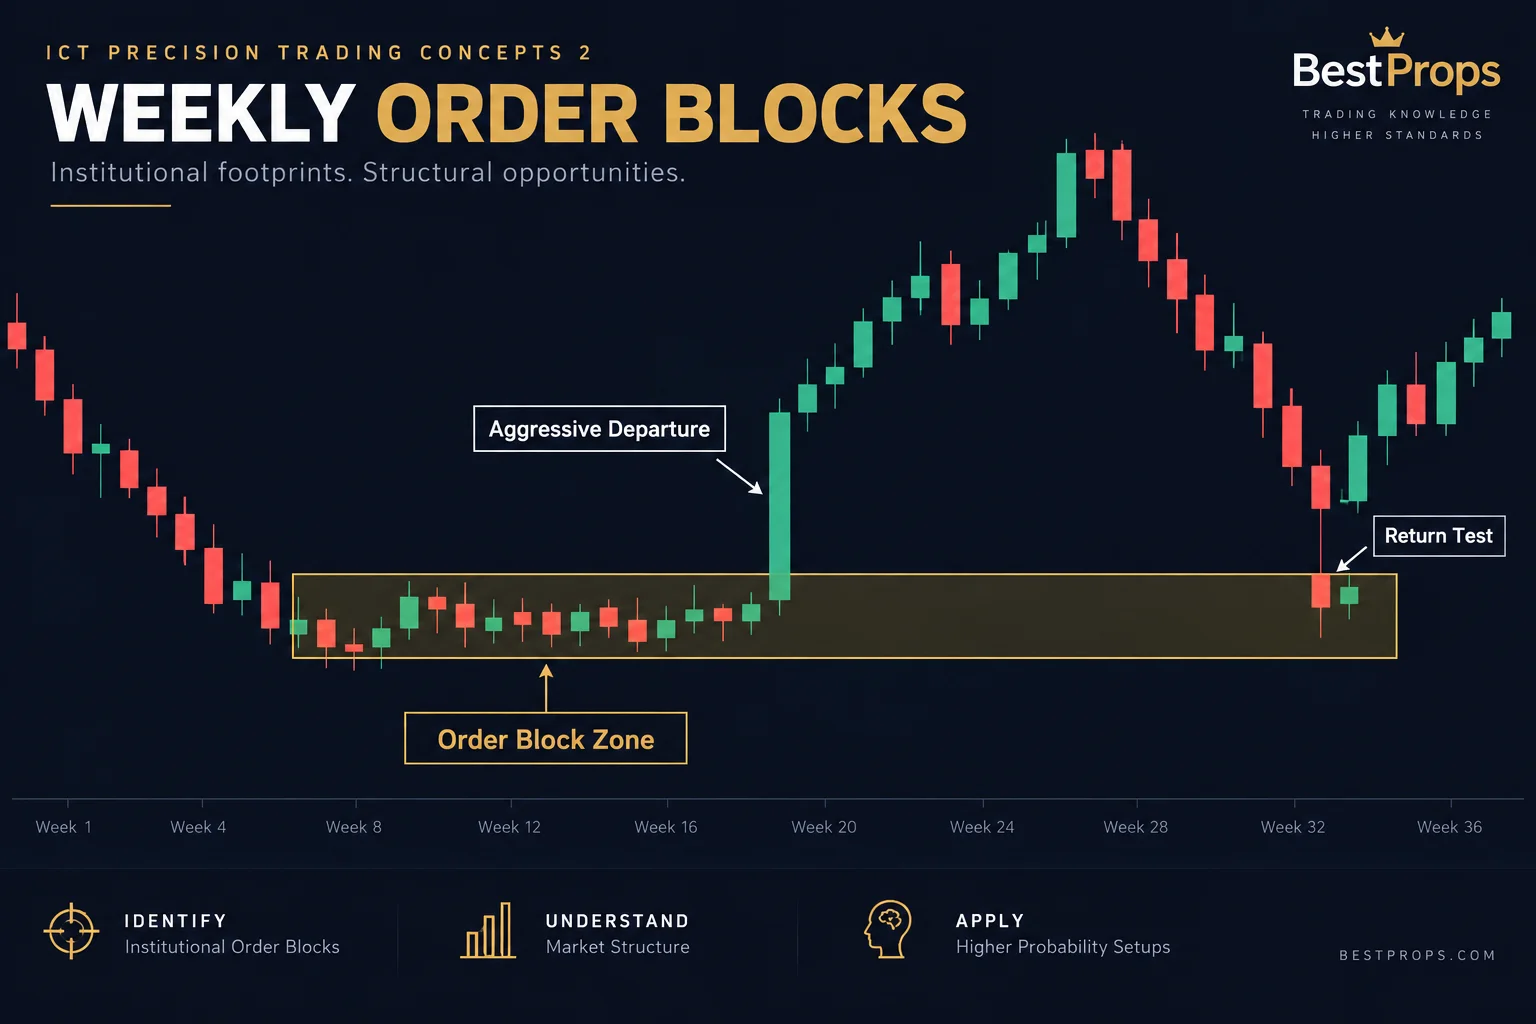
In ICT Precision Trading Concepts – 2, uploaded on December 26, 2017, ICT shifts the series from weekly directional order flow to identifying order blocks on a weekly chart. The lesson presents the weekly timeframe as a source of broader context, while lower timeframes are reserved for confirmation and possible execution.
ICT also makes an important limitation explicit near the beginning: the method cannot determine market direction correctly 100% of the time (1:48). That qualification matters because much of the rest of the presentation uses favorable historical chart examples and large hypothetical pip ranges. These illustrations explain ICT’s framework; they do not establish its predictive accuracy or profitability.
The weekly order-block idea
At 2:50, ICT describes the weekly version as an application of the same order-block premise he uses on daily, four-hour and one-hour charts. He looks for an area from which price moved away forcefully after spending relatively little time there, followed later by a return to that area.
The examples in this installment concentrate primarily on bullish situations. ICT combines the proposed order block with market structure, including a low surrounded by higher short-term or swing lows. In his interpretation, an aggressive move upward from that structure can identify a candle or price area worth monitoring if price retraces.
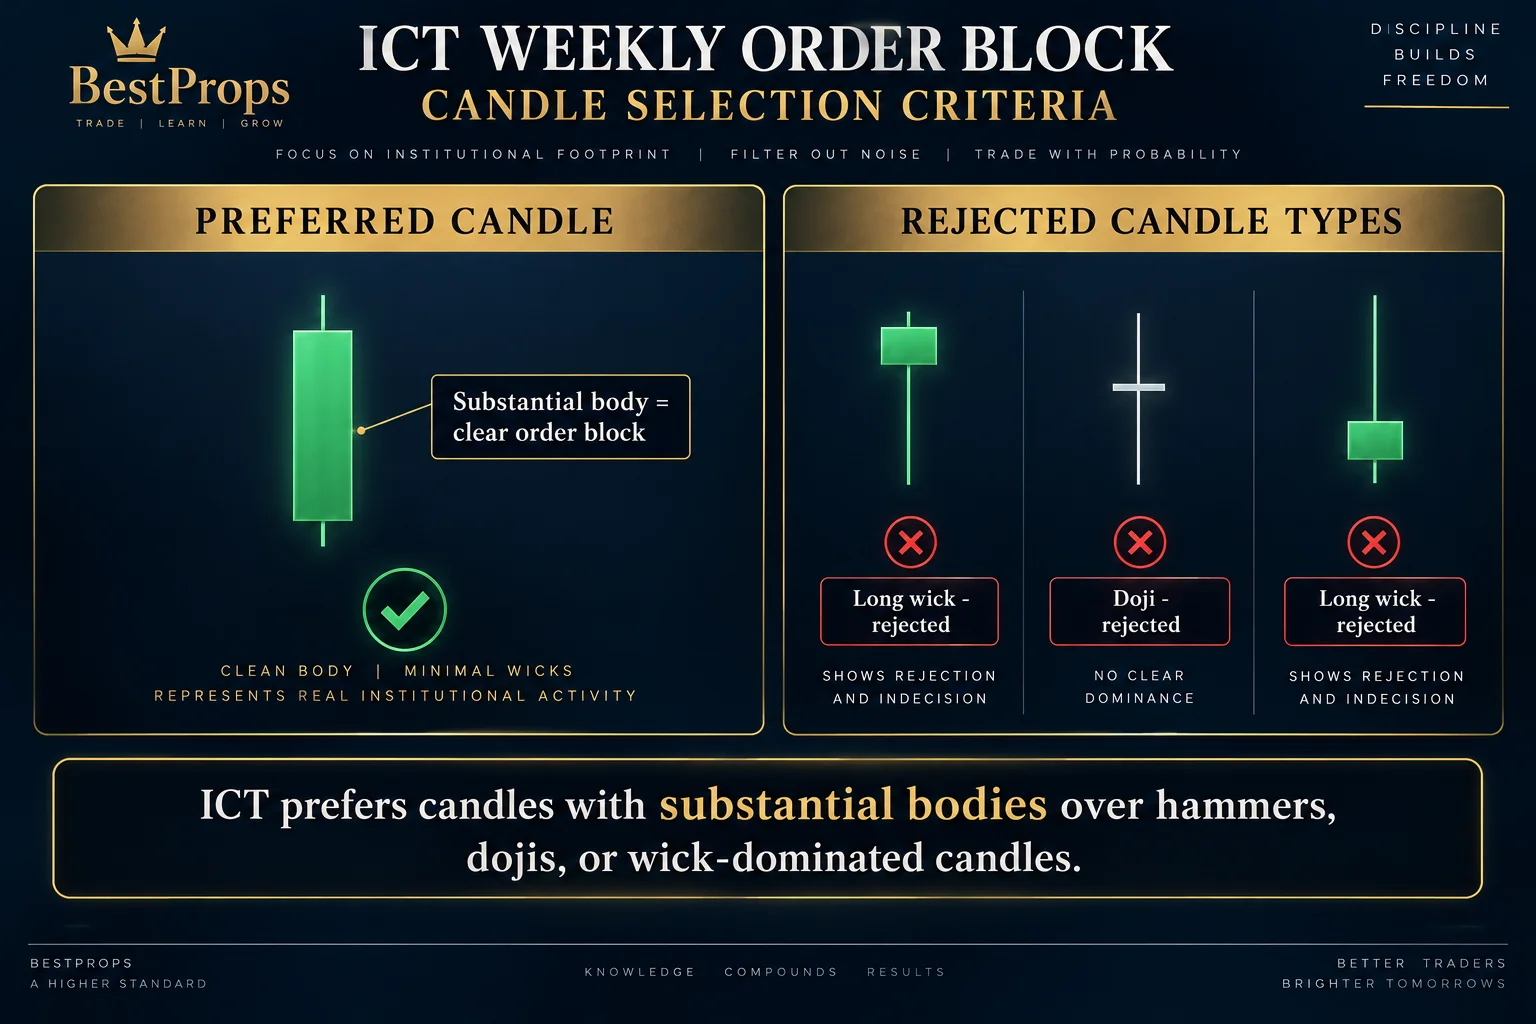
Candle construction affects his selection. Beginning around 5:23, he says he generally prefers a candle with a substantial body over a hammer, doji or candle dominated by a long wick. Later examples repeat this filter. He acknowledges that some wick-heavy candles would have appeared to work historically, but says they would not have met his stated criteria at the time.
A practical summary of ICT’s process
- Start with weekly order flow and market structure to form a directional premise.
- Locate a weekly area followed by an aggressive departure.
- Favor the relevant candle body when a long wick makes the boundary less clear.
- Wait for price to retrace into the area rather than entering merely because the level exists.
- Seek supporting evidence on daily and intraday charts.
- Use prior highs or lows as reference objectives, while accepting that the premise can fail.
Price alone is not the entry signal
One of the lesson’s most useful qualifications appears at 8:29. ICT says a return to a weekly order block is not an automatic instruction to buy. He calls for confluence on the daily, four-hour, one-hour and 15-minute charts, with the five-minute chart potentially used for more precise timing.
He frames this as “time meeting price.” The transcript names the London open, New York open and London close as preferred timing windows. ICT characterizes the Asian session as an accumulation phase and says he personally avoids trading it. These session interpretations are components of ICT’s methodology, not independently demonstrated market rules.
At 22:10, ICT gives a more compact definition for the bullish example: the last bearish candle before the lowest low and subsequent rise. He then layers that area with a Fibonacci retracement and a round-number reference. Because the video transcript cannot show the chart itself, the precise boundaries and visual confluence must be checked in the recording.
Targets and trade management
Across the historical examples, ICT repeatedly measures from a proposed weekly order block back to an old high. The narration mentions ranges of several hundred pips and, in some examples, more than 1,000 pips. Those figures are chart measurements claimed during the lesson, not verified fills or documented trading results.
ICT argues that a trade derived from a weekly setup should be managed according to the weekly premise rather than abandoned solely because of short-term fluctuations. At 27:13, he contrasts managing such an idea on a weekly basis with reacting to every five-, 15- or 60-minute movement. He also discusses taking a partial position off and retaining a smaller portion in case price reaches a more distant high.
The presentation includes hypothetical position sizing and dollar-return examples. ICT labels at least one such calculation hypothetical because no lower-timeframe chart is displayed to establish an actual entry. These scenarios should therefore be understood as arithmetic illustrations, not evidence that a trade was available or executed as described.
Invalidation and imperfect levels
ICT does not portray every marked zone as dependable. Near 24:28, he discusses a bullish order block being violated and says this would make him cautious. He emphasizes that drawn lines are references rather than exact barriers that the market must respect. After a violation, he looks for additional structure before treating a later return as another opportunity.
He also concedes that he does not know in advance whether support or resistance will hold. His explanation for why larger participants might defend an area is an interpretation within the ICT model; the transcript provides no order-book evidence identifying those participants or proving their motives.
General educational interpretation
Separate from ICT’s proprietary terminology, the lesson demonstrates a recognizable top-down analysis workflow: use a higher timeframe to narrow the directional scenario, identify a retracement area, and then demand lower-timeframe confirmation before considering an entry. It also illustrates the distinction between a setup location and an entry trigger.
The strongest study takeaway is not the large pip totals highlighted in hindsight. It is the need to define selection criteria consistently, document what invalidates a zone and avoid quietly relabeling candles after seeing the outcome. Anyone reviewing the concept can test it more critically by hiding later price action, recording every qualifying example—including failures—and specifying session, spread, stop and exit assumptions in advance. This article is educational commentary on ICT’s video, not investment advice or a performance promise.
Watch the lesson

ICT Precision Trading Concepts – 2
The Inner Circle Trader
Weekly order blocks, market structure, lower-timeframe confluence, session timing, and trade management from the December 26, 2017 session.
Resources
- The Inner Circle Trader – Official Website (Michael J. Huddleston’s home for mentorship content and the ICT Compendium Library).
- The Inner Circle Trader – YouTube Channel (Full free mentorship playlist including the Precision Trading Concepts series).
- Who Is ICT? Michael J. Huddleston Explained (Independent study companion summarizing ICT’s methodology, terminology, and public teaching — unofficial and unaffiliated).
- What Are Order Blocks? – EBC Financial Group (Independent educational overview of order-block concepts in forex and indices — unofficial and untested).


