
Key takeaways
ICT Forex SMT divergence compares the U.S.
Read the full summary
ICT Forex SMT divergence compares the U.S. Dollar Index with inversely related USD currency pairs on the same timeframe and dates to identify unconfirmed swing highs or lows as relative strength or weakness. In the bullish AUD/USD examples, AUD/USD makes a lower low while the Dollar Index fails to make a higher high, or the index makes a higher high while AUD/USD holds above its prior low. In the bearish GBP/USD example, the Dollar Index makes a lower low while GBP/USD fails to make the expected higher high, signaling relative pound weakness within ICT’s framework. Traders align corresponding candles and swing points, determine the expected mirror move, scan major currencies for failures to confirm, and combine the mismatch with broader structure, liquidity pools, order blocks, optimal trade entry, Turtle Soup, failure swings, and symmetrical price swings. ICT presents SMT as contextual confirmation rather than a standalone reversal signal, and the lesson provides no statistical profitability evidence, reliability testing, or complete risk-management system.
How we researched this article
BestProps used document-based research from primary firm sources, checked September 25, 2026. The complete source list, scope, limitations, and commercial-state record appear near the end of this article.
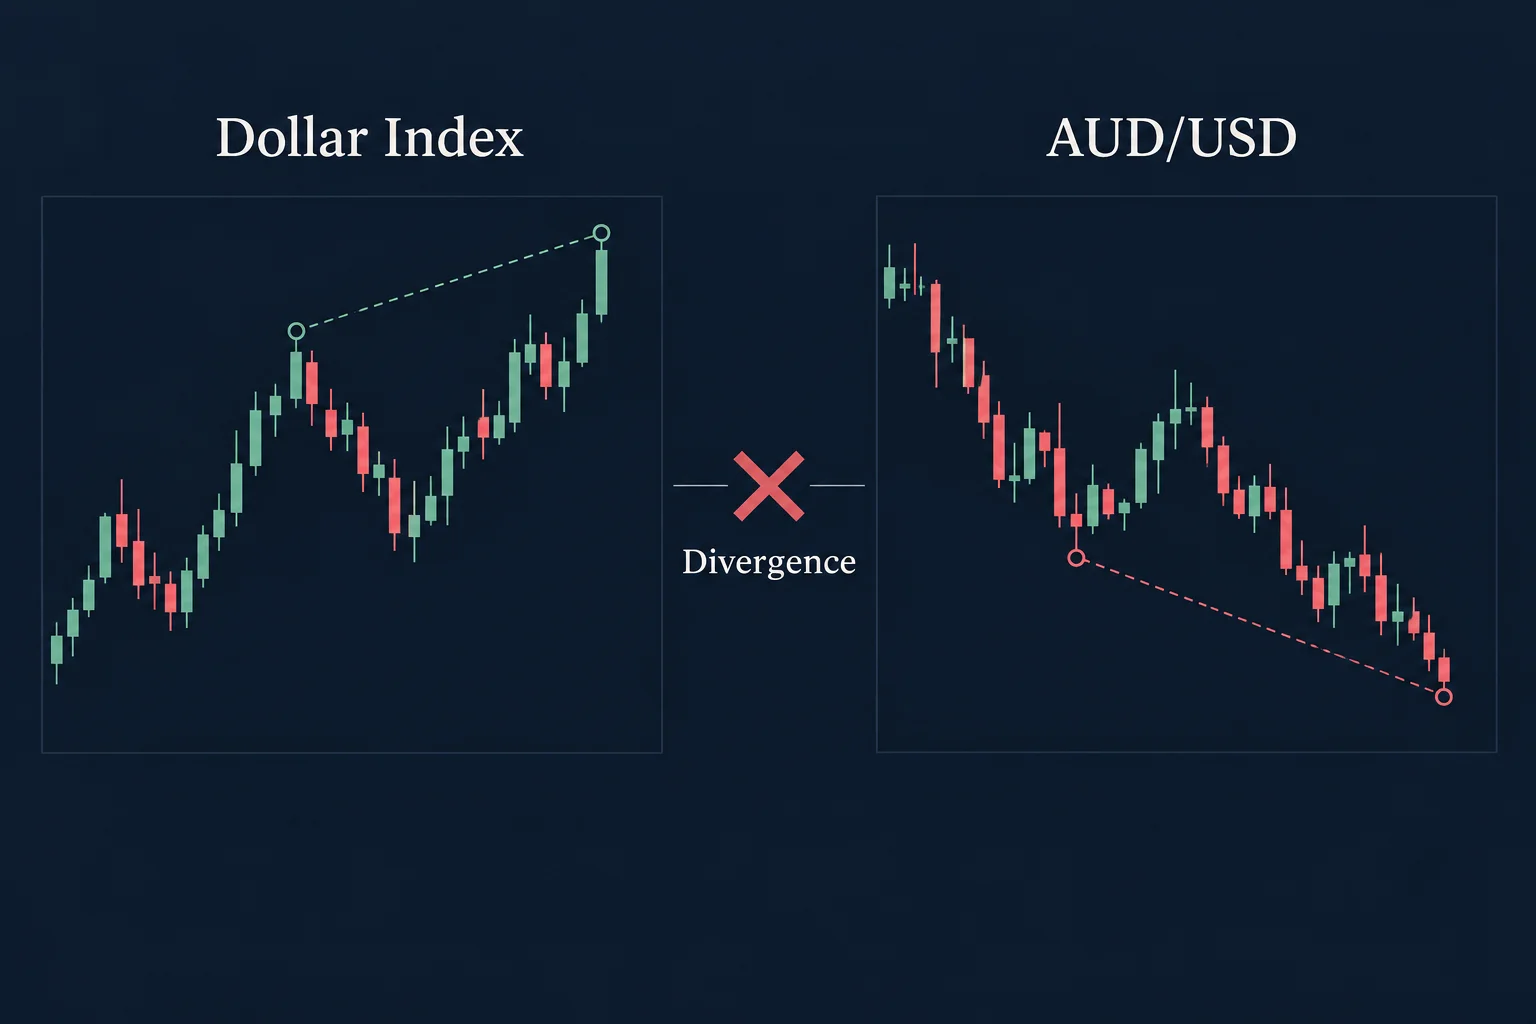
In the video “ICT Forex – The ICT Smart Money Technique or SMT”, ICT explains one version of SMT divergence by comparing the U.S. Dollar Index with USD-linked currency pairs. The central idea is to watch for occasions when two markets that ordinarily move inversely fail to produce corresponding highs or lows.
ICT presents this mismatch as a way to interpret relative strength or weakness. It is not a standalone guarantee of a reversal, and the transcript does not establish how reliably the method performs across markets or time periods.
How ICT Forex SMT Divergence Works
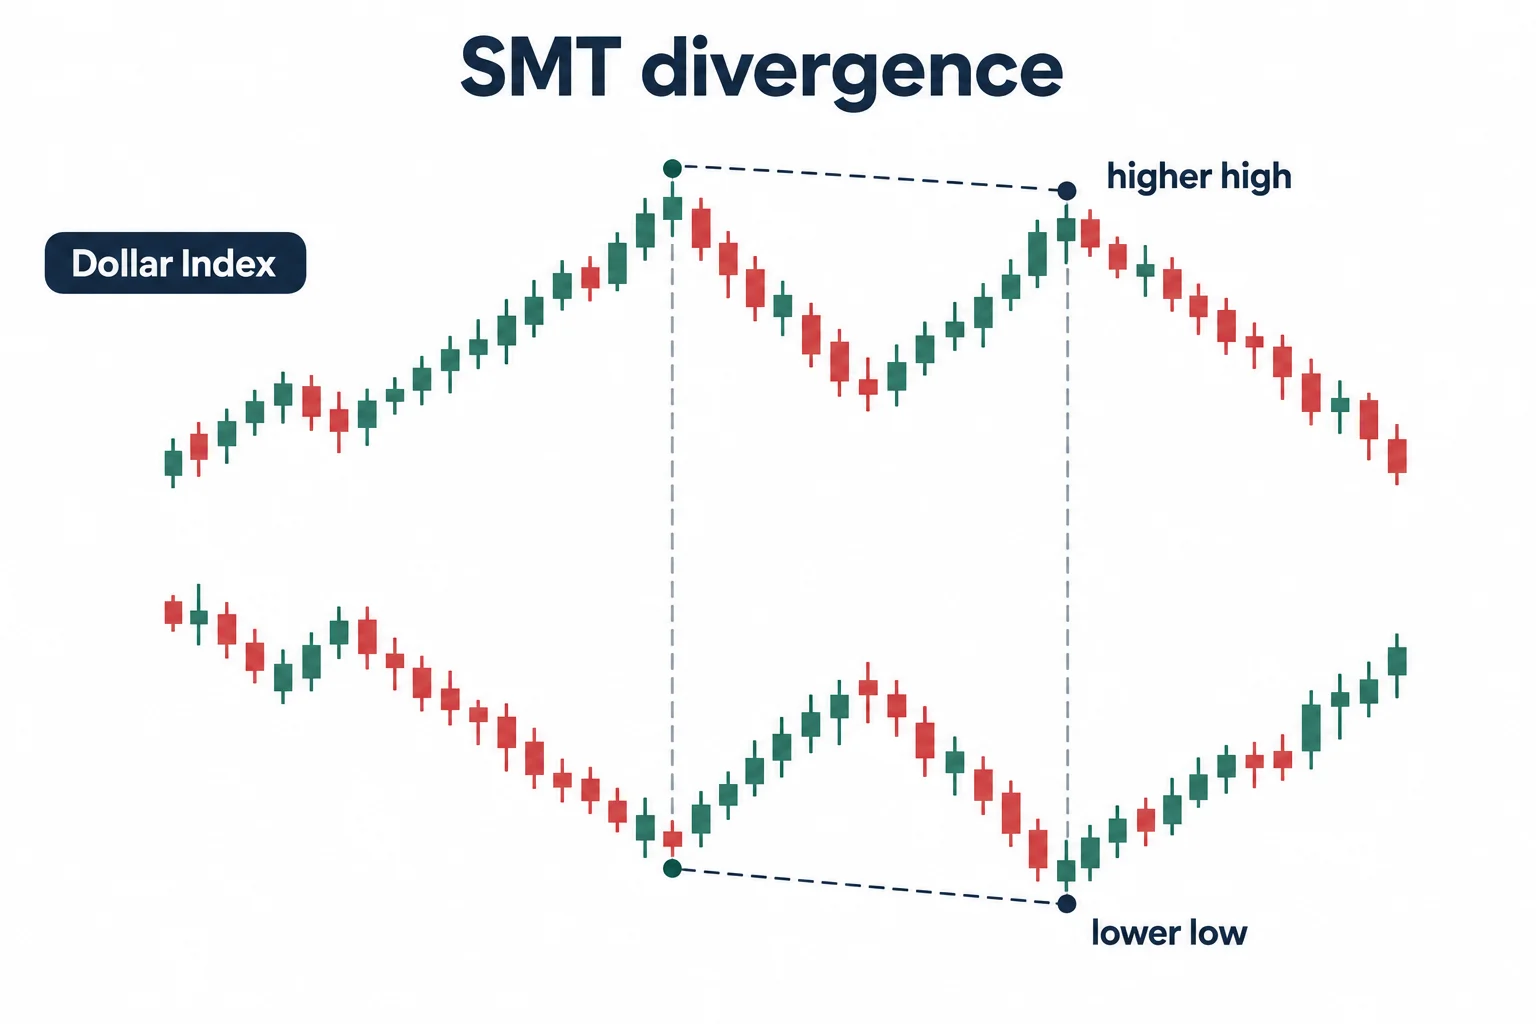
ICT introduces the lesson’s scope at 0:28: bullish and bearish SMT divergence involving the Dollar Index. Although he says he teaches other forms of SMT, this presentation concentrates on the inverse relationship between the dollar and foreign currencies.
In a simplified symmetrical relationship, ICT expects:
- A foreign currency making a lower low to coincide with the Dollar Index making a higher high.
- A foreign currency making a higher high to coincide with the Dollar Index making a lower low.
An SMT divergence appears when one side fails to confirm the other. ICT calls this a “cracking correlation,” meaning the expected mirror-image behavior has temporarily broken down. That phrase describes his interpretation of the price relationship; it should not be read as proof of institutional activity.
Bullish ICT Forex SMT Divergence
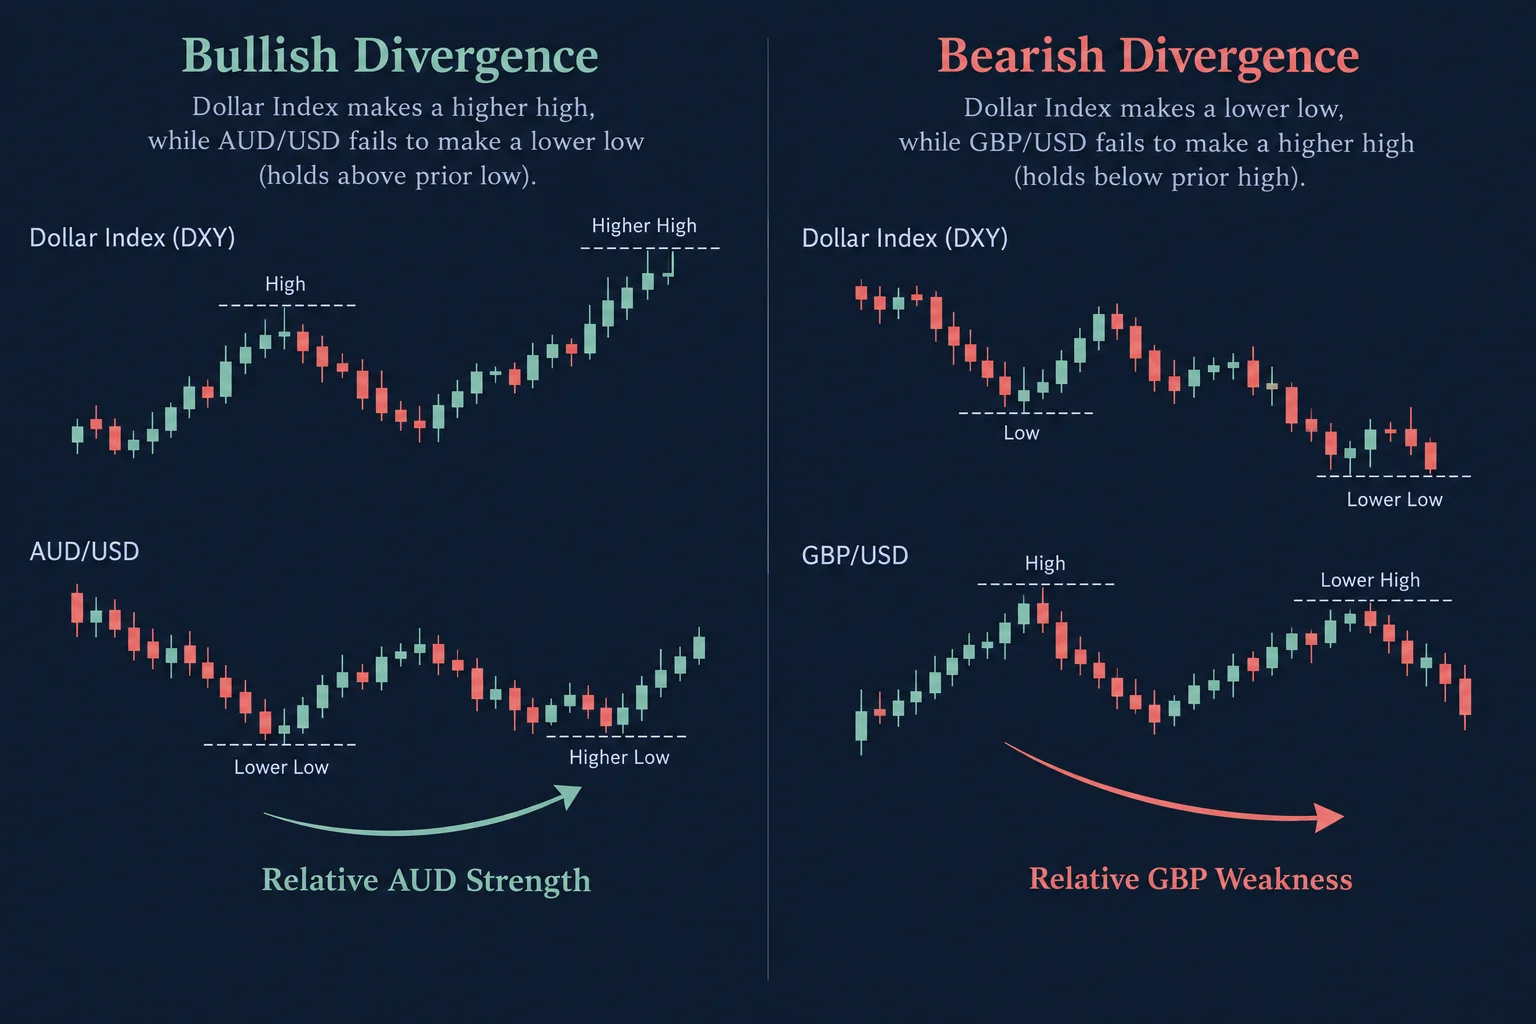
The bullish framework begins around 3:00, using AUD/USD and the Dollar Index. ICT gives two variations that he considers bullish for the Australian dollar:
- AUD/USD makes a lower low, but the Dollar Index fails to make the corresponding higher high.
- The Dollar Index makes a higher high, but AUD/USD fails to make the corresponding lower low.
In the first case, ICT interprets the Dollar Index’s failure as relative dollar weakness. In the second, he interprets AUD/USD’s refusal to make a new low as relative strength in the Australian dollar. Both depend on comparing the same timeframe and matching reference swings or candles, a requirement he emphasizes at 5:18.
ICT SMT Divergence in AUD/USD
ICT then moves from the diagram to an historical AUD/USD example. He starts with broader daily and weekly structure, discusses equal lows and a weekly area he labels a bullish order block, and subsequently drops to an hourly chart. These are concepts within ICT’s own trading framework rather than independently validated market facts.
At 9:35, he explains that the analysis is meant to be made without relying on the later portion of the move. He aligns hourly AUD/USD and Dollar Index charts by date and comparable reference points.
The key observation appears at 11:00: AUD/USD was not making lower lows while the Dollar Index was making higher highs. ICT interprets that relative resilience as accumulation in AUD/USD and distribution in the Dollar Index. His teeter-totter analogy at 12:50 summarizes the expected inverse relationship.
The later discussion combines this divergence with other ICT concepts, including liquidity pools, resistance, candle bodies and what he calls an optimal trade entry. SMT is therefore presented as contextual confirmation rather than an entirely isolated setup.
Bearish ICT Forex SMT Divergence
The bearish example begins at 15:39 and compares the Dollar Index with GBP/USD, which ICT calls “cable.” Here the Dollar Index makes a lower low, but GBP/USD does not make the higher high that the inverse relationship would ordinarily suggest.
ICT treats GBP/USD’s failure to rally as evidence of relative pound weakness. Under his interpretation, the apparent Dollar Index breakdown may be false while the pound is vulnerable to lower prices. He then looks to prior lows as potential liquidity objectives and discusses possible bearish entries within his broader methodology.
At 17:40, he combines the bearish divergence with an optimal trade entry concept. The captions also refer to “Turtle Soup,” failure swings and symmetrical price swings. Those terms are mentioned as parts of ICT’s framework, but this particular transcript does not fully define or test them.
Using ICT SMT Divergence in Forex Education
The most transferable lesson is relative-strength comparison:
- Open the Dollar Index and a USD-related currency pair.
- Use the same timeframe on both charts.
- Align the same dates and corresponding swing points.
- Determine what mirror-image move would normally be expected.
- Note whether either market fails to confirm the other’s new high or low.
- Use broader structure separately rather than assuming every mismatch predicts a reversal.
ICT suggests scanning major currencies to identify which one fails to mirror a Dollar Index move at 18:28. In general analytical terms, this is a comparison of relative behavior among correlated or inversely correlated instruments. Correlations can change, however, and defining comparable swing points involves judgment. The video supplies illustrative chart commentary, not statistical evidence of profitability or a complete risk-management system.
Key ICT SMT Divergence Takeaways
In this lesson, SMT divergence is an unconfirmed high or low between the Dollar Index and a foreign-currency pair that ICT expects to behave inversely. A pair holding above an old low while the Dollar Index makes a new high is treated as relatively strong; a pair failing to make a new high while the index makes a new low is treated as relatively weak. This is ICT’s market interpretation and should be studied as an educational chart-reading framework, not as investment advice or a promised trading edge.
Watch the full lesson: ICT Forex – The ICT Smart Money Technique or SMT
If the embed does not play, use the link above to watch on YouTube.
Further Reading
- ICT YouTube Channel – Inner Circle Trader (original source)
- Multiple Time Frame Analysis – BabyPips (general education)
- Correlation Definition – Investopedia (general reference)


