
Key takeaways
ICT Forex Time and Price Theory presents a top-down framework using monthly, weekly and daily opening prices, with open, high, low and close forming the Power Three structure and higher timeframes governing lower-timeframe interpretation.
Read the full summary
ICT Forex Time and Price Theory presents a top-down framework using monthly, weekly and daily opening prices, with open, high, low and close forming the Power Three structure and higher timeframes governing lower-timeframe interpretation. Bullish analysis looks for opportunities at or below the relevant open, while bearish analysis looks at or above it. The monthly chart supplies macro institutional bias, the weekly chart frames trades longer than a day but shorter than a macro position, and the daily chart adds short-term context through prior daily and weekly highs and lows. A 2017 EUR/USD example shows price dipping below monthly opens before rallying toward an older high, though ICT acknowledges at 12 minutes 26 seconds that Fibonacci projections can fall short or be exceeded. Monthly bias does not make every week directional, weekly bias does not validate every daily setup, and an opening-price reaction is not sufficient confirmation by itself. ICT also states at 19 minutes 28 seconds that day trading does not require trading every day. The recording uses selected historical examples and does not independently verify chart levels, fills, results or the claim that institutional and algorithmic activity makes these opens significant, so the method should be studied as an alignment framework rather than a proven mechanical entry system.
How we researched this article
BestProps used document-based research from primary firm sources, checked September 25, 2026. The complete source list, scope, limitations, and commercial-state record appear near the end of this article.
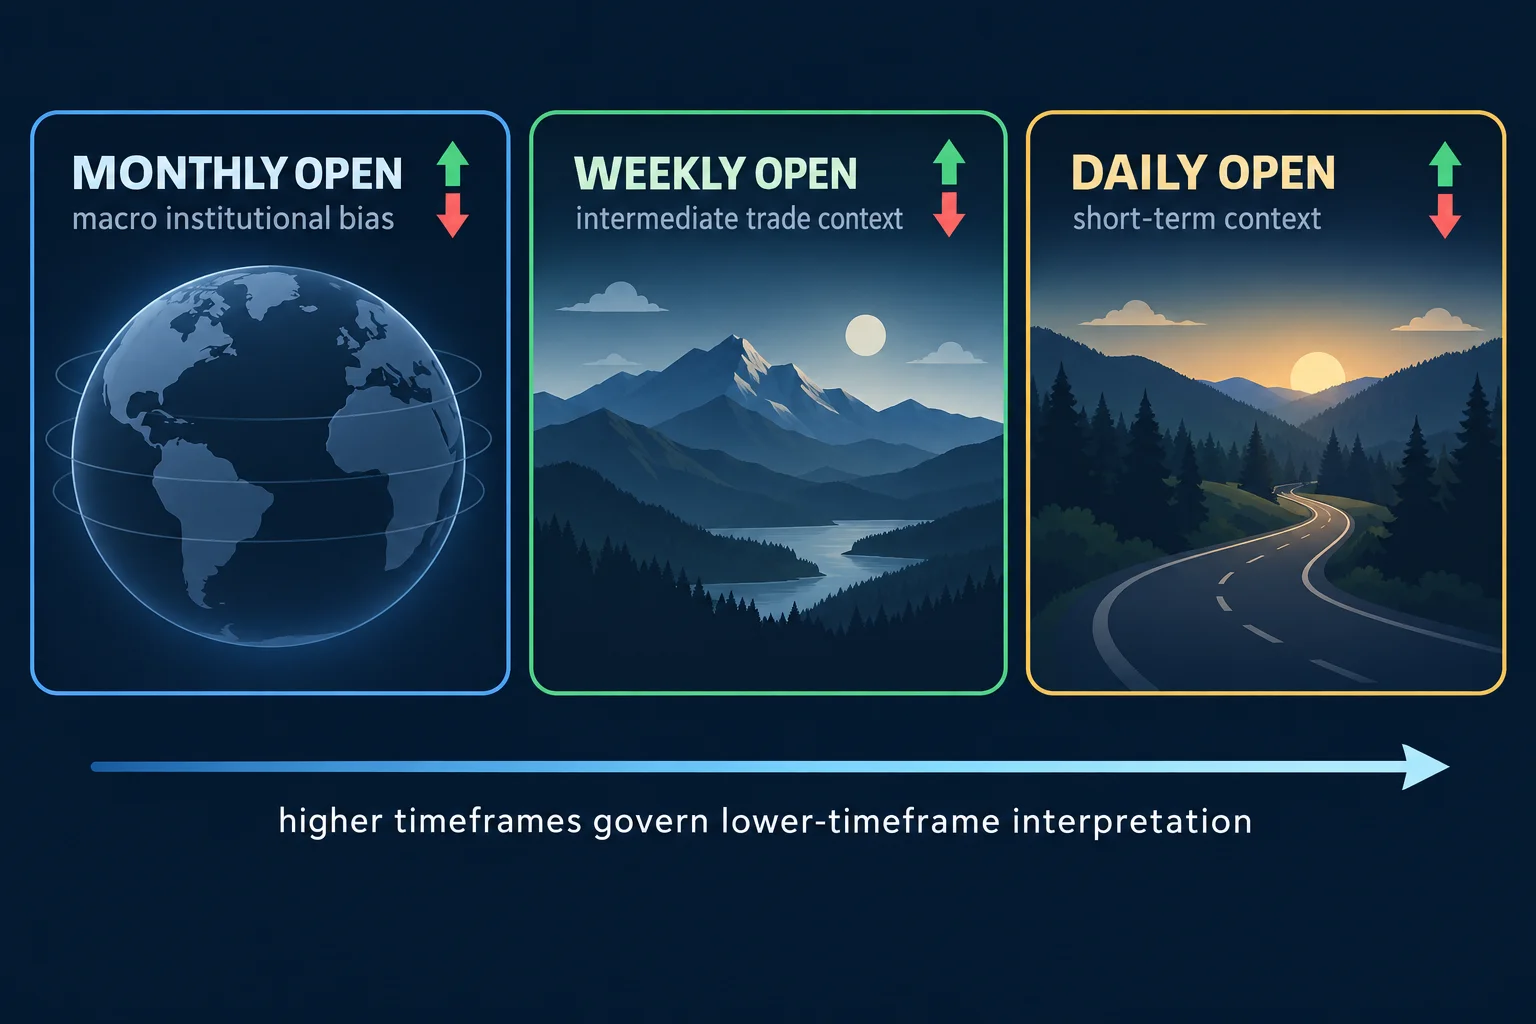
In ICT Forex – Time & Price Theory, uploaded December 9, 2017, ICT introduces a top-down framework built around monthly, weekly and daily opening prices. His central idea is that the same open-high-low-close structure appears across timeframes, while higher timeframes provide the context for interpreting lower-timeframe movement.
This is a summary of ICT’s teaching, not evidence that the method predicts markets reliably. The recording presents selected historical chart examples, and the transcript alone cannot verify the chart levels, entries, fills or later trading results.
ICT Time and Price Theory Foundations
ICT begins by reducing price action to four values: the open, high, low and close. At 0:43, he says this formation contains what traders seek in price action. He then organizes the lesson around what he calls “Power Three” and the characteristics of monthly, weekly and daily ranges.
From 1:22, ICT describes price action as fractal: recognizable patterns can appear on a one-minute chart, a daily chart or a monthly chart. He does not treat every timeframe as equally important, however. In his analysis, the monthly chart receives greater weight because it offers a broad view of multiple months or years.
ICT Monthly Opens for Forex Price Context
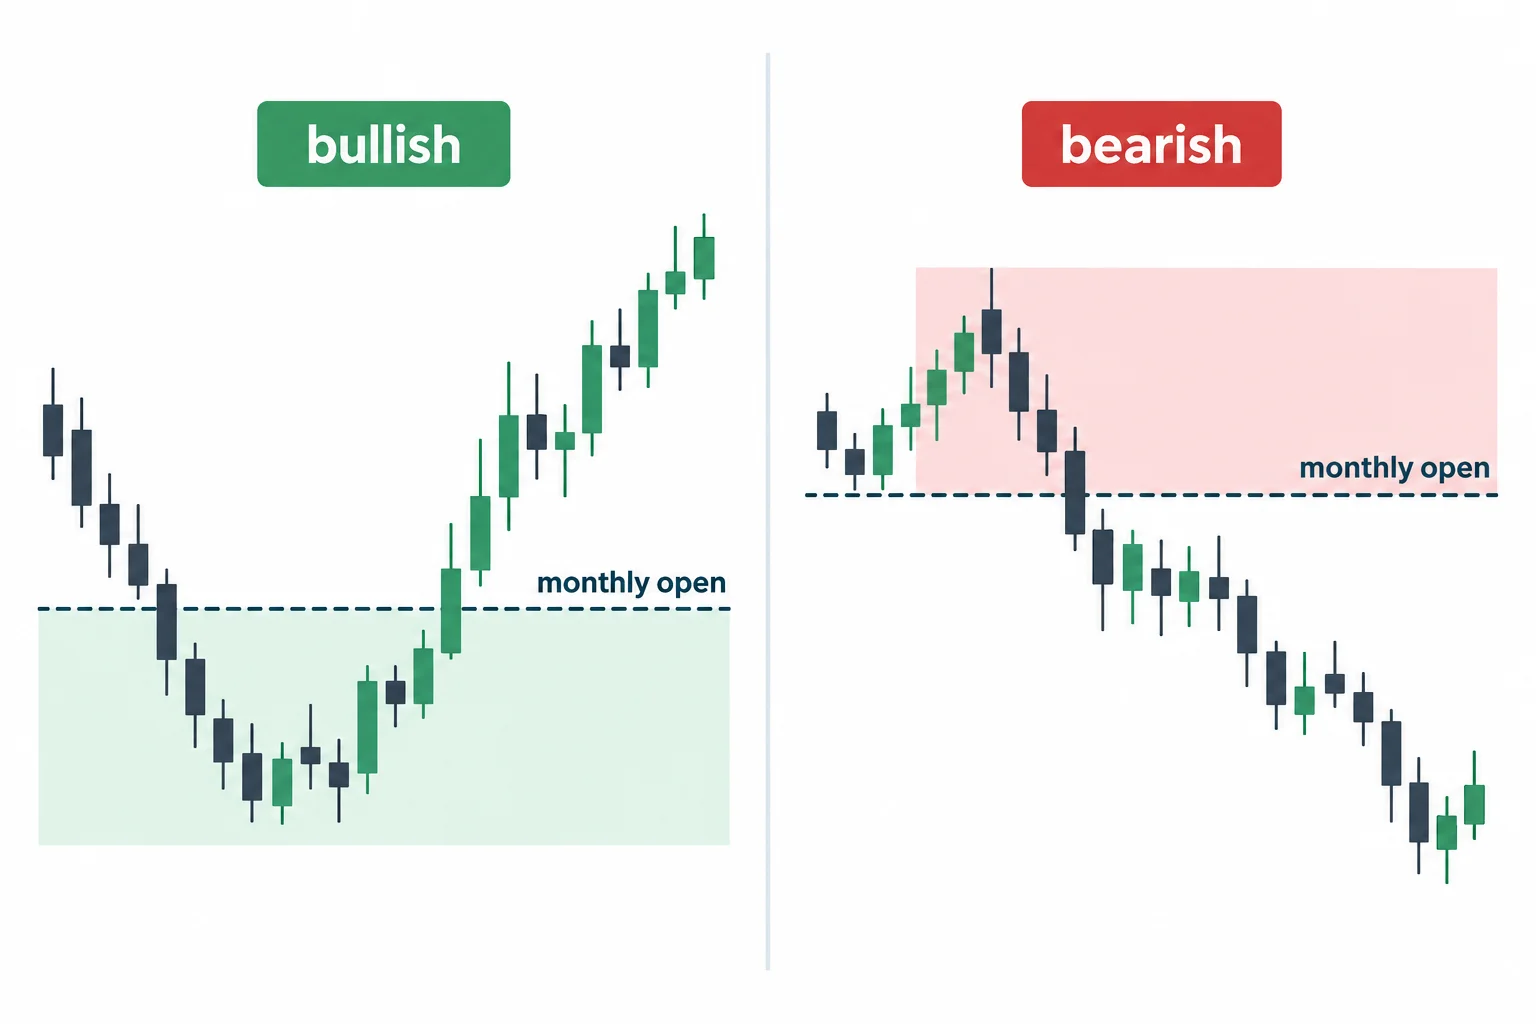
ICT labels the monthly chart a source of “macro institutional bias.” His directional rule is straightforward:
- When his monthly analysis is bullish, he looks for buying opportunities at or below the monthly open.
- When it is bearish, he looks for selling opportunities at or above the monthly open.
He outlines that rule at 2:57. ICT attributes the importance of monthly and weekly opens to institutional and algorithmic activity, but the video does not independently substantiate that market-structure claim.
For illustration, he discusses a historical EUR/USD monthly chart from 2017. His interpretation begins with relatively equal prior lows, a move beneath them and a subsequent recovery. He then identifies a three-candle swing-low pattern and treats a break above the third candle as confirmation of a bullish monthly perspective. From there, he marks the opening prices of later months and an older high as a potential objective.
On the daily view, ICT says the April through July 2017 examples showed price moving below each monthly open before rallying. Once price reached the older high in July, he says bullish expectations should become less aggressive because the previously identified objective had been met. In discussing an August move beyond that high, he also acknowledges at 12:26 that his Fibonacci-based projections are not consistently exact and may fall short or be exceeded.
ICT Weekly Opens for Forex Trade Context
At 12:59, ICT applies the same concept to weekly opening prices. He presents the weekly chart as an intermediate perspective suited, in his framework, to trades lasting longer than a day but shorter than a macro position.
The directional template remains the same: a bullish weekly view leads him to investigate buying at or below the weekly open, while a bearish view leads him to investigate selling at or above it. Monthly analysis is meant to supply the broader backdrop.
An important qualification appears at 14:34: ICT explicitly says that not every week will move with the monthly bias. A market considered bullish on the monthly chart can still retrace or consolidate during individual weeks. In his four-week example, he discusses reactions below weekly opens, retracements and moves around equal lows. These are ICT’s readings of an on-screen chart rather than independently tested rules.
ICT Daily Opens for Timeframe Alignment
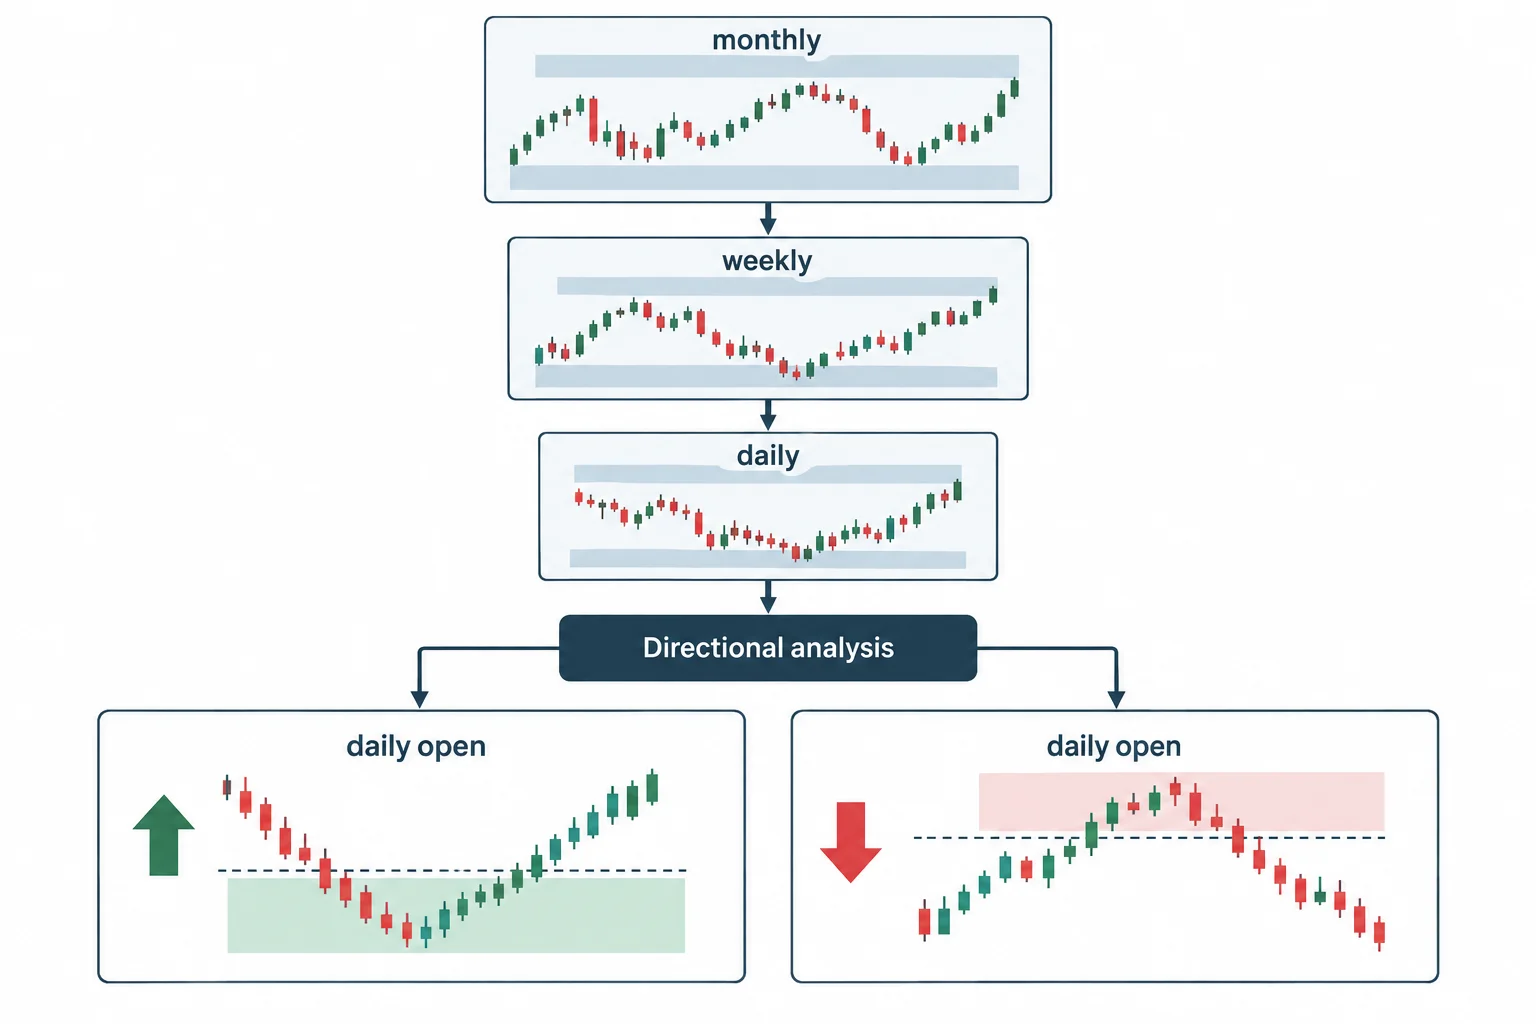
ICT moves to daily opening prices at 17:07. He characterizes the daily chart as short-term context and emphasizes awareness of previous daily highs and lows, weekly highs and lows, and other levels he interprets as liquidity reference points.
For the daily range, his rule is again symmetrical:
- With a bullish daily view, investigate price behavior at or below the daily open.
- With a bearish daily view, investigate price behavior at or above the daily open.
ICT says he regards a daily idea as more favorable when the monthly and weekly perspectives support it. In other words, the opening price is not presented as a standalone signal. Directional analysis must come first, and the lower-timeframe setup is then evaluated within the higher-timeframe range.
What ICT Time and Price Theory Actually Claims
The most useful limitation comes near the end. At 18:53, ICT warns that a bullish month does not make every week bullish, and a bullish week does not make every day below its open a valid long setup. He says traders must combine several parts of the analysis rather than react mechanically to an opening price.
He further states at 19:28 that day trading does not mean trading every day. Even when opportunities can be identified in hindsight, he does not suggest that a new student should expect to find a setup in every session.
How to Study ICT Time and Price Theory
For educational chart review, the lesson can be reduced to a non-prescriptive sequence:
- Start with the monthly chart and document the directional interpretation, major swing points and monthly open.
- Move to the weekly chart and note whether its structure agrees with, retraces against or consolidates within the monthly view.
- Mark the daily open along with prior daily and weekly highs and lows.
- Review whether reactions around an open occurred in the expected direction, and also record every example that did not.
- Avoid treating a move below or above an open as sufficient confirmation by itself.
The video’s core teaching is therefore alignment rather than a mechanical entry system: ICT uses monthly, weekly and daily opens as reference points, with higher-timeframe interpretation governing how lower-timeframe price action is read. That framework remains a market interpretation to study critically, not a guarantee of a tradable outcome.
Video: Watch on YouTube (opens in new tab) — if the embed above does not play, use the direct link.
Further Reading
- BabyPips — Multiple Time Frame Analysis (third-party education)
- Investopedia — Fractal Definition in Technical Analysis (third-party reference)
- CFTC — Fraud Awareness & Prevention (regulatory)


