
Key takeaways
ICT’s approximately 18-minute Forex Target Selection and Profit Objectives lesson, uploaded December 21, 2017, applies multiple Fibonacci projections only after establishing an independent bullish or bearish weekly premise.
Read the full summary
ICT’s approximately 18-minute Forex Target Selection and Profit Objectives lesson, uploaded December 21, 2017, applies multiple Fibonacci projections only after establishing an independent bullish or bearish weekly premise. Traders identify the structurally important parent swing, generally anchor measurements to candle-body opens or closes rather than wick extremes, add only supportive subordinate swings, and seek overlap among target extensions, symmetrical measured moves, and optimal trade entry extensions. ICT treats projections within roughly 10 to 15 pips as confluent, preferring less than 10 pips, then selects a conservative executable exit just before the cluster, often at a price ending in zero or five and adjusted for spread and broker-feed variation. The bearish example uses equal lows as a potential draw and places short covering near the upper side of the projected zone. Swing selection, weekly bias, and confluence thresholds remain discretionary, and the lesson provides no systematic test, profitability record, completed-trade result, or evidence that Fibonacci projections reliably predict prices.
How we researched this article
BestProps used document-based research from primary firm sources, checked September 25, 2026. The complete source list, scope, limitations, and commercial-state record appear near the end of this article.

In ICT Forex – Target Selection & Profit Objectives, uploaded December 21, 2017, ICT explains a chart-based process for estimating where a weekly bullish or bearish move might encounter a practical profit objective. The central idea is to project several Fibonacci-based measurements from relevant price swings, then look for a narrow area where multiple projections overlap.
This is ICT’s interpretation of market structure and target selection, not evidence that Fibonacci projections reliably predict prices. The transcript does not establish the result of any trade shown on the chart.
Set a Weekly Forex Target Direction
ICT starts by separating directional analysis from target measurement. Before calculating an intraday objective, he says the trader should already have a weekly premise (bullish or bearish) formed before the week begins. The target-selection process is then used to estimate how far price might travel if that premise proves correct.
In the 0:44, ICT assumes that prior analysis has produced a bullish weekly bias. He first examines a larger impulse swing to establish potential objectives beyond an earlier swing high. He describes projecting “target one,” “target two,” and a symmetrical price swing from that larger structure.
The important distinction is that the Fibonacci measurements do not create the directional thesis in this lesson. They are applied after the thesis has been selected.
Improve Target Selection With Significant Forex Swings
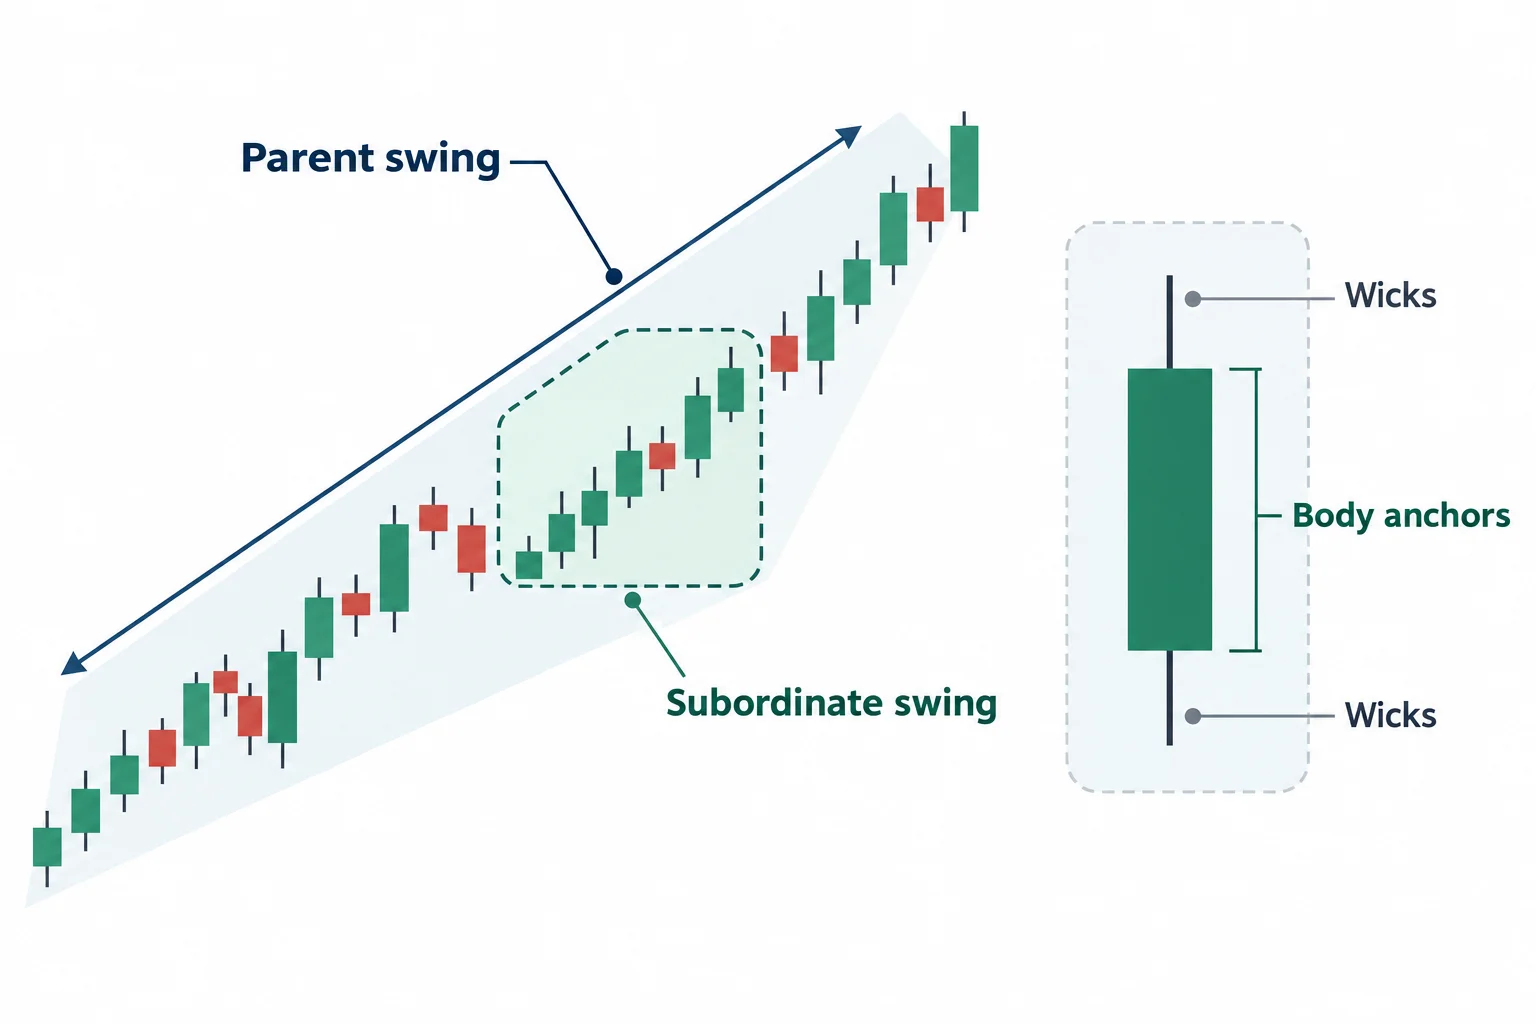
Throughout the presentation, ICT generally anchors measurements to candle-body opens or closes rather than wick extremes. He later explains that this is intended to emphasize what he calls the bulk of the volume and to reduce discrepancies caused by differing broker price feeds.
He also does not treat every visible fluctuation as equally meaningful. Around 6:12, he distinguishes a larger “parent” swing from a smaller subordinate swing contained within it. His process gives more weight to the larger structural move, while smaller swings may supply additional projections only when they fit the broader analysis.
Similarly, in the bearish example he rejects a swing associated with consolidation because price returned to the same general area. This illustrates that the method involves discretionary swing selection rather than an entirely mechanical indicator rule.
Find Forex Profit Targets With Fibonacci Clusters
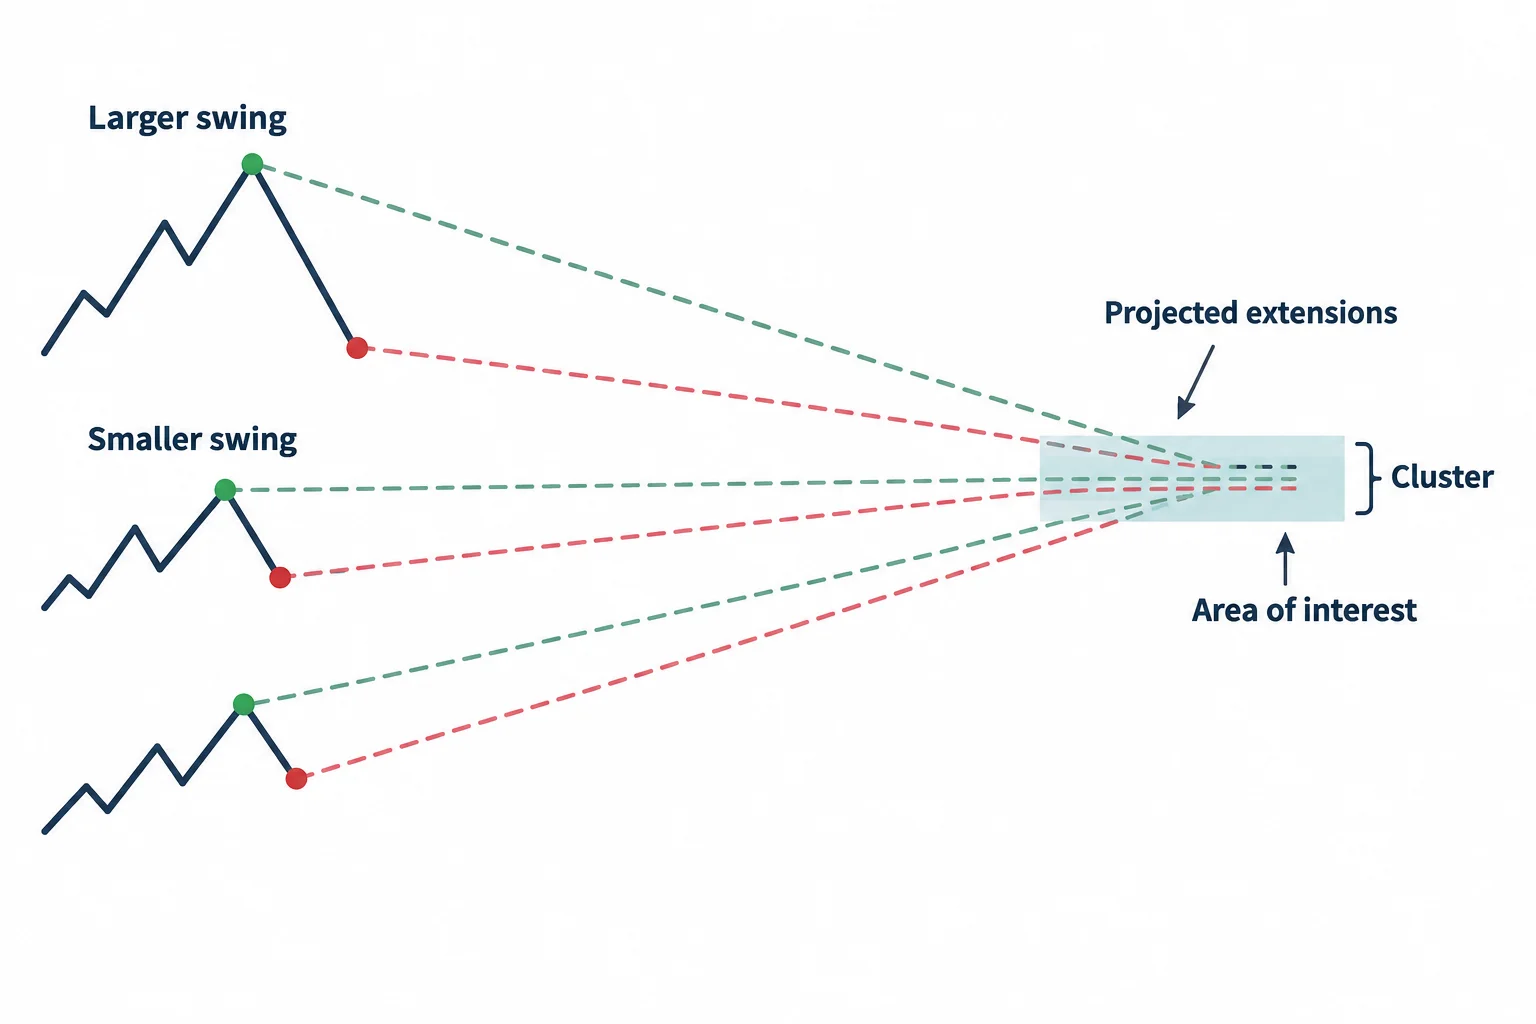
The core lesson begins around 3:24. ICT measures multiple relevant swings and searches for Fibonacci extensions that converge near one another. He discusses several types of projected levels, including target extensions, symmetrical measured moves and extensions from what he calls an “optimal trade entry.”
Rather than treating one Fibonacci level as decisive, ICT focuses on grouping:
- Start with objectives projected from the larger price swing.
- Measure selected smaller swings that support the same directional premise.
- Note where extensions from different measurements fall close together.
- Treat a tight cluster as an area of interest rather than an exact guaranteed turning price.
At 5:36, ICT says he may regard levels within roughly 10 to 15 pips as confluent, depending on market structure, while a separation of less than 10 pips is preferable in his framework. This is a rule of thumb presented by ICT, not a tested universal threshold.
Turn Forex Target Clusters Into Profit Objectives
Once several projections form a cluster, ICT chooses a nearby executable objective. In the bullish illustration, he identifies a group of levels and then discusses selecting a nearby price ending in zero or five. At 10:00, he compares more conservative exits with objectives deeper inside the projected cluster.
His stated preference is generally to exit just before the cluster rather than demand the furthest possible price. The same principle appears more clearly in the bearish discussion at 16:01. ICT adjusts the contemplated covering level to account for spread and places it ahead of the overlapping projections.
He explicitly accepts that this can leave part of a move uncaptured. His priority in the example is obtaining an exit before the theoretically ideal extreme, not calling the precise weekly high or low.
Apply ICT Target Selection in Bearish Forex Markets
The bearish walkthrough starts around 11:09. With a bearish weekly premise, ICT interprets an upward movement as a possible opportunity for selling before looking for objectives below prior lows.
He notes equal lows as a potential draw, measures the main downward price swing and then adds projections from selected internal swings. A symmetrical price projection and several Fibonacci extensions gather in a relatively narrow zone. He uses the upper side of that zone to frame a more conservative short-covering objective, again leaving room for spread and price-feed variation.
Use ICT Forex Profit Objectives for Education
A useful way to understand the lesson is as a hierarchy rather than a single signal:
- Establish a directional scenario independently.
- Identify the most structurally important swing.
- Project several supported measurements.
- Find a zone where those projections overlap.
- Select an objective slightly before the zone, accounting for execution frictions.
The method remains subjective because the analyst must choose the weekly bias, decide which swings are significant and determine how close projections must be to count as confluence. The video provides examples of ICT’s reasoning, but it does not supply a systematic test, profitability record or assurance that a projected area will be reached.
Primary source: ICT Forex – Target Selection & Profit Objectives.
ICT Forex Target Selection Resources
The following resources were checked while preparing this article. The regulator and investor-education pages are general material about how trading systems offered to the public should be assessed and about the risks of highly active trading; neither evaluates this speaker, verifies the forecast figures, the seasonal claim, the order-choice discussion, or the target-level methodology described above, nor endorses anything said in the recording. Any ICT, smart-money or third-party indicator, script, note set, chart annotation, transcript pack or re-upload circulating outside the publishing channel’s own page is unofficial and has not been tested here.
- [1] ICT Forex – Target Selection & Profit Objectives The Inner Circle Trader (primary source; watch page read 22 September 2026, listed duration approximately 18 minutes).
- [2] The Inner Circle Trader (official YouTube channel) (read 22 September 2026), the publishing channel for the 2017 mentorship series used here.
- [3] CFTC, Fraud Advisory: Commodity Trading Systems Sold on the Internet (read 22 September 2026), explains that hypothetical trading results are typically simulations calculated over historical price data, with results that calculate what purported trades would have achieved had they been placed.
- [4] Investor.gov (SEC), Glossary: Day Trading (read 22 September 2026), investor education stating that day trading is extremely risky and can result in substantial financial losses in a very short period of time.


