
Key takeaways
ICT recommends beginners study one or two currency pairs on clean 15-minute charts, mark equal highs as potential buy-stop liquidity and equal lows as potential sell-stop liquidity, and observe price around those levels for one month before placing even demo trades.
Read the full summary
ICT recommends beginners study one or two currency pairs on clean 15-minute charts, mark equal highs as potential buy-stop liquidity and equal lows as potential sell-stop liquidity, and observe price around those levels for one month before placing even demo trades. The four-step workflow is observation, journaling, demo practice, and review, with losing and ambiguous cases preserved. ICT later proposes a demo discipline target of 20–30 pips per week followed by stopping for the week, not as an expected return. His framework treats old highs and lows as possible liquidity pools, defines a bearish order block as an up-close candle preceding a downward move when supported by a prior liquidity rationale, and suggests waiting for a retracement to the candle low rather than chasing price near the target. Fibonacci terminology includes a 62%–79% retracement range, but ICT says concentrated orders beneath equal lows provide the rationale. A narrated demo short illustrates partial exits, stop adjustments, and scaling out, though the transcript cannot verify prices, fills, or results. These concepts are ICT interpretations, not independently established rules or guarantees of profit.
How we researched this article
BestProps used document-based research from primary firm sources, checked September 25, 2026. The complete source list, scope, limitations, and commercial-state record appear near the end of this article.
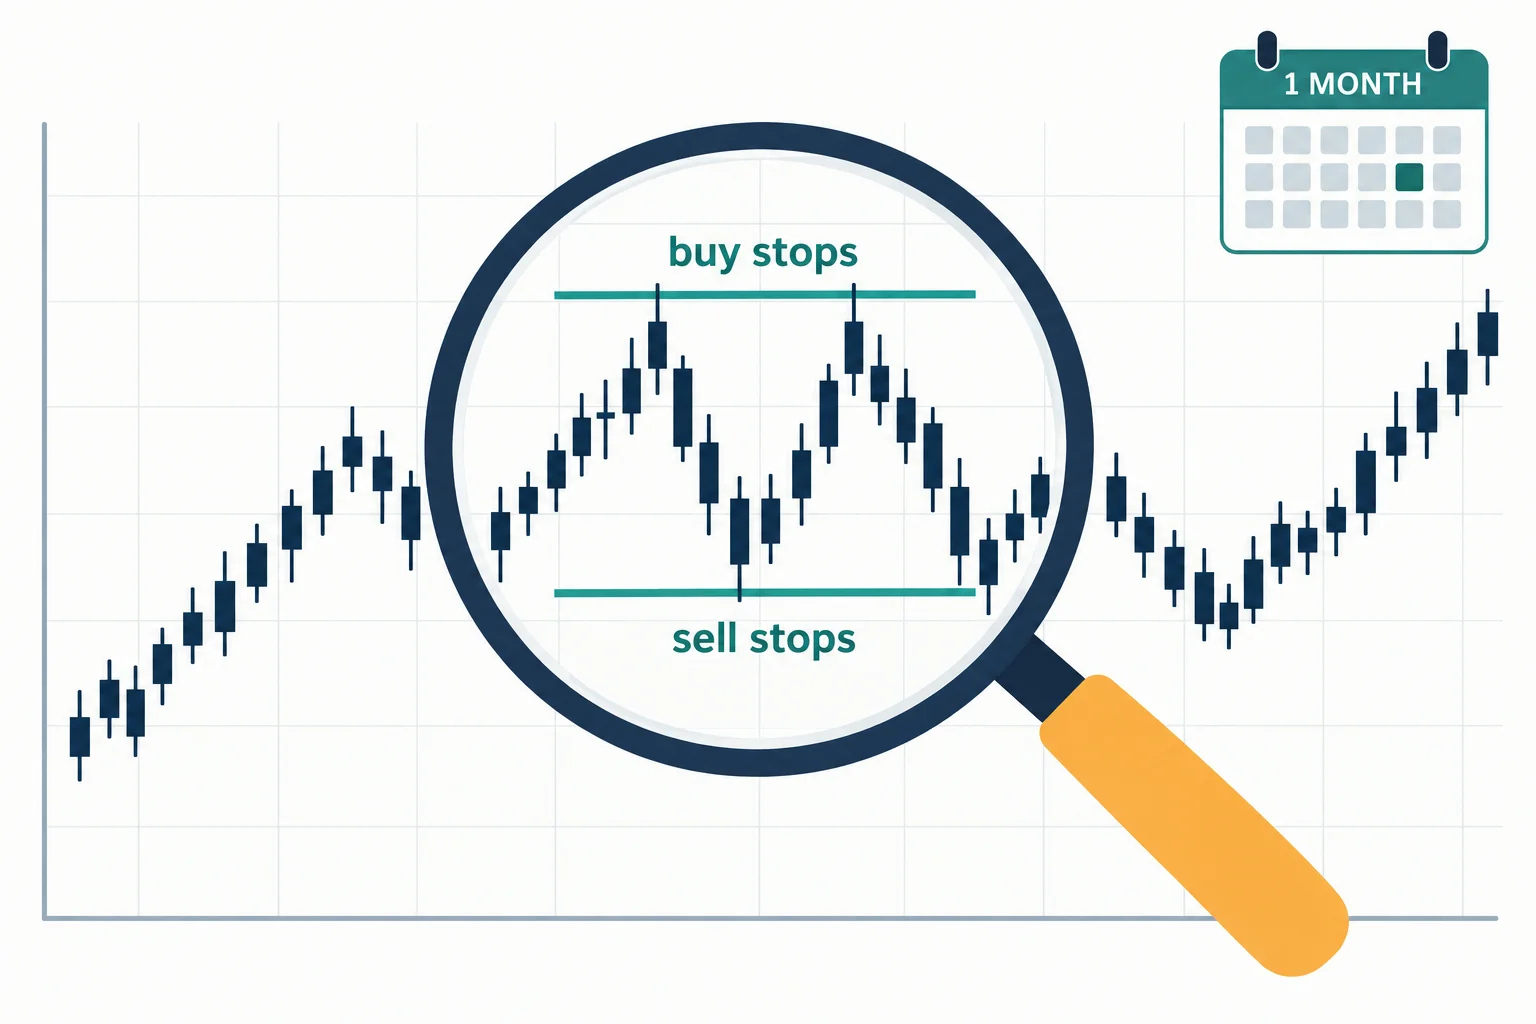
In “ICT Forex – What New Traders Should Focus On”, uploaded December 9, 2017, ICT outlines a deliberately narrow study routine for beginners. His central recommendation is not to begin by placing frequent trades. Instead, he asks new traders to observe how price behaves around equal highs and equal lows, first on historical charts and then in a demo account.
The lesson introduces several ICT concepts, including liquidity pools, stop runs, order blocks, entries, targets and scaling out. These are ICT’s interpretations of market behavior, not independently established rules or assurances of profitable results.
New Forex Traders Should Focus on Observation
After previewing the module’s topics at 1:41, ICT argues that a beginner should simplify the chart and concentrate on open, high, low and close data. Although he briefly describes price patterns as repeating across time frames, his practical emphasis is on learning to recognize a limited set of formations rather than adding indicators.
At 6:26, he recommends using a demo account. More importantly, he says observation should come before even demo execution. His suggested exercise is to ask where a conventional trade idea might fail and where protective stops are likely to have accumulated.
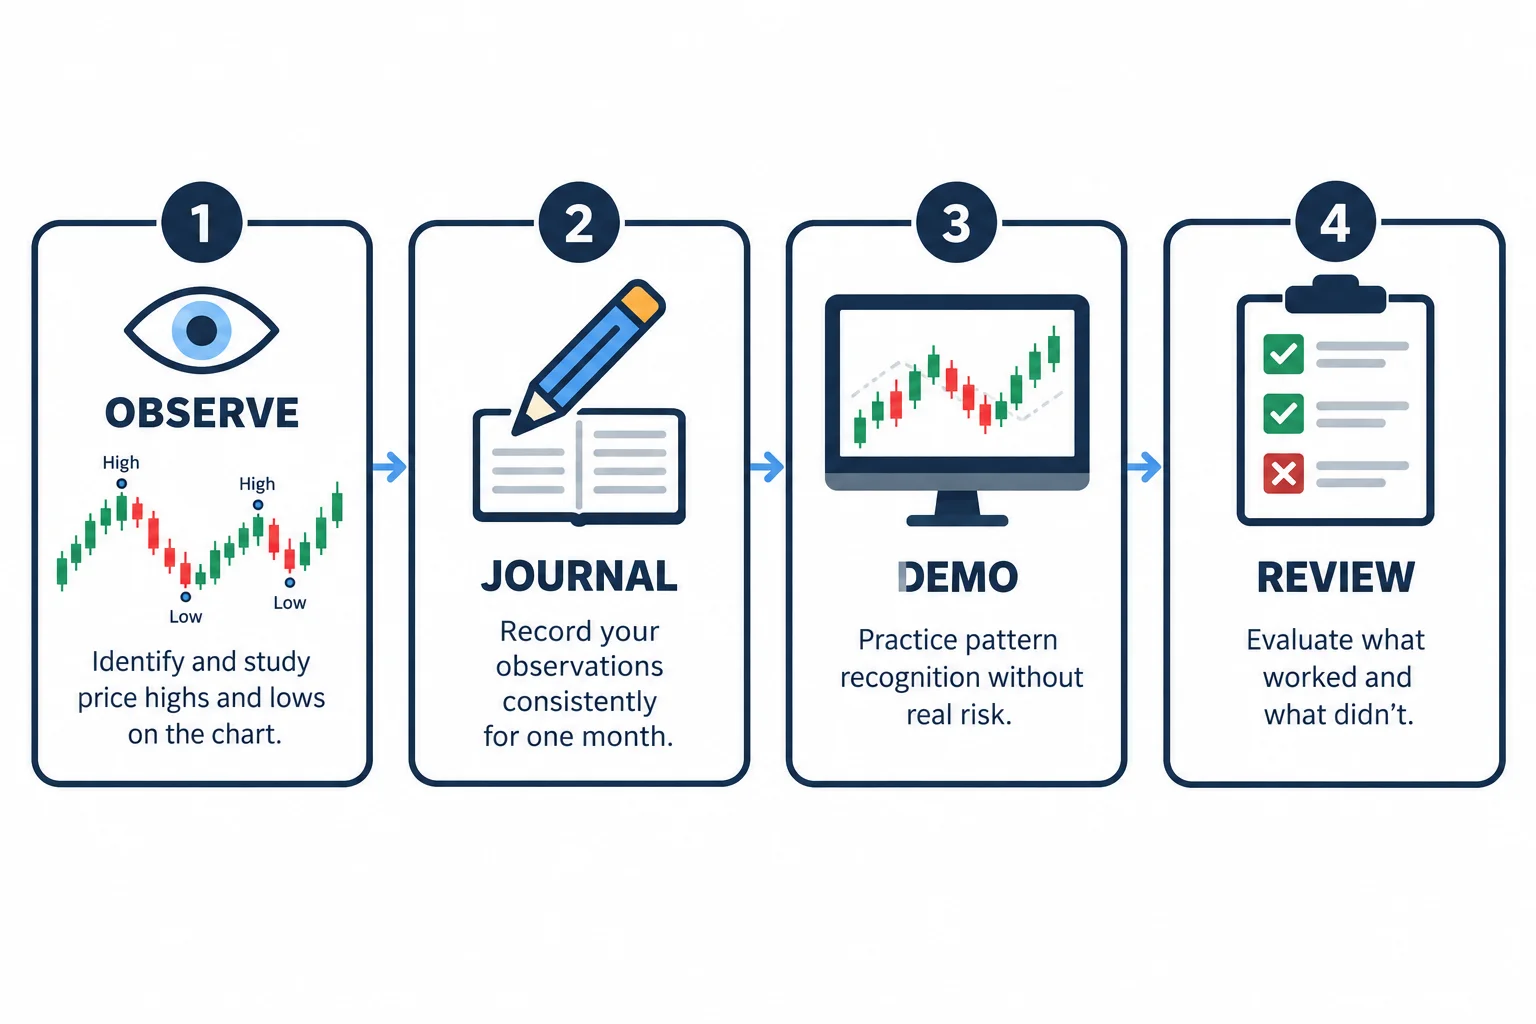
This produces a clear beginner workflow:
- Choose only one or two currency pairs.
- Use a clean chart, with the 15-minute time frame offered as a practical starting point.
- Mark visually similar highs and lows with short horizontal lines.
- Label the area above equal highs as potential buy-stop liquidity and the area below equal lows as potential sell-stop liquidity.
- Observe what price does around those levels for one month without attempting to predict every move.
ICT states this assignment directly at 7:43 and, at 9:25, tells students not to demo trade during the initial observation period.
ICT Forex Liquidity for New Traders
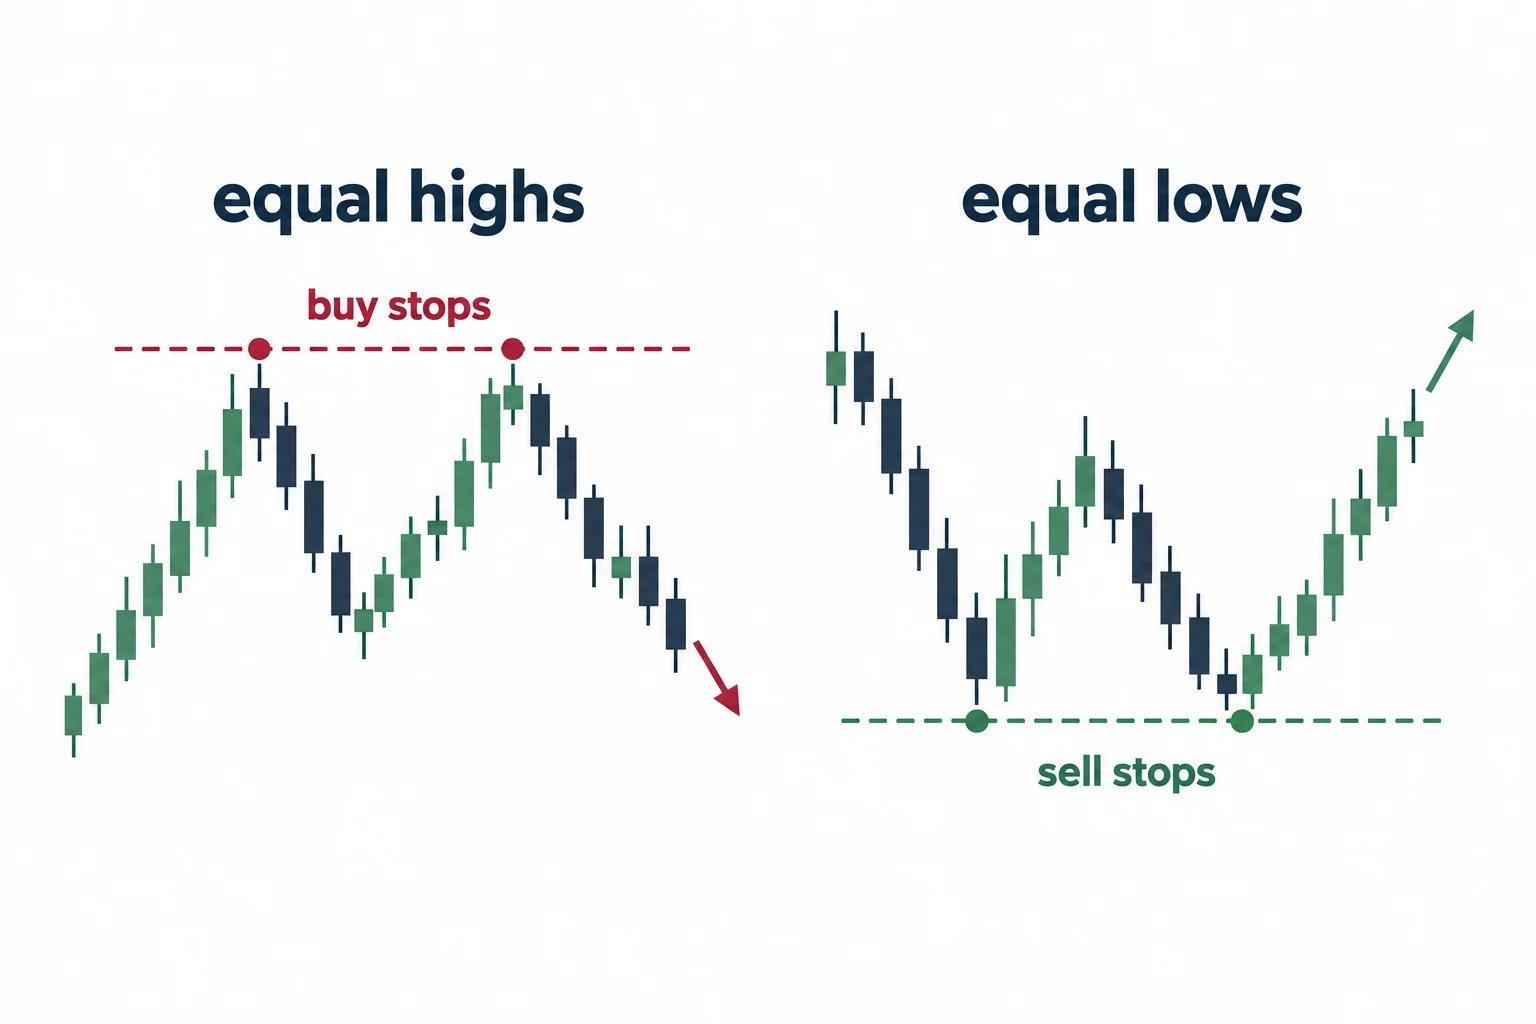
ICT contrasts his framework with a conventional support-and-resistance reading. In his explanation, equal highs can attract buy stops, while equal lows can attract sell stops. He therefore treats these levels as possible liquidity pools rather than automatically buying a double bottom or selling a double top.
At 13:26, he summarizes the premise by saying that price moves toward levels where orders reside, particularly around old highs and lows. That is ICT’s market interpretation. A chart marking alone does not establish direction, timing or whether price will reach or reverse at a given level.
The educational value of the exercise is its narrow scope: it asks a beginner to form a repeatable observation habit. A useful journal could record when a level formed, whether price later crossed it, how far it moved and what happened afterward. Such notes should include cases that do not fit the anticipated behavior, rather than preserving only favorable examples.
How ICT Forex Order Blocks Fit the Lesson
The latter half of the video adds entry context. ICT discusses a bearish setup aimed toward equal lows and introduces what he calls a bearish ICT order block. At 17:35, he identifies it as an up-close candle preceding a downward move, but immediately cautions that not every up-close or down-close candle qualifies. In his framework, a prior rationale (here, an expected move toward stops below equal lows) is required.
He then describes waiting for price to retrace to the low of that candle rather than entering after price has already traveled close to the objective. This distinction matters within the lesson: an entry pattern is not presented as a standalone signal. It is subordinate to the proposed liquidity target and the remaining distance between entry and target.
ICT also uses Fibonacci retracement terminology earlier in the example, including a stated 62%–79% range. However, he says the Fibonacci tool is not the source of the move; in his account, the underlying rationale is the concentration of orders beneath the equal lows.
New Forex Traders Should Focus on Demo Practice
At 12:18, ICT proposes a demo-training objective of 20–30 pips per week, followed by stopping for the week. This is presented as a discipline exercise, not a dependable return. Pip totals alone also omit position size, spread, slippage and monetary risk, so they should not be interpreted as performance expectations.
The recorded example beginning around 22:10 shows ICT narrating a demo short, partial exits and stop adjustments. According to his narration, he waits for his selected price, reduces the position as it moves lower and later has the remainder stopped out after moving the stop. The transcript supports what he says he did, but it cannot independently verify the chart, quoted prices, platform fills or final account result.
His broader management lesson is that a trader need not rely on the entire position reaching the furthest target. Scaling out and reducing exposure can create a different outcome from an all-or-nothing exit. That does not make scaling inherently superior; it changes both risk and potential reward and should be evaluated consistently in simulation.
Practical ICT Forex Takeaways for New Traders
The most concrete takeaway is to reduce the number of decisions. Study one or two pairs, mark equal highs and lows, collect observations for a month and delay execution practice until the pattern is familiar. If moving to demo trading, define the setup, invalidation, target and management rules before entering, then preserve losing and ambiguous examples in the journal.
This is an explanation of ICT’s lesson, not investment advice. Forex trading can produce losses, and none of the concepts in the video guarantees that a marked liquidity level, order block or target will behave as anticipated.
Watch the ICT Forex Lesson for New Traders
ICT Forex Resources for New Traders
- ICT Forex – What New Traders Should Focus On (primary video, first-party YouTube)
- Inner Circle Trader – official ICT education portal (first-party site)
- BabyPips – School of Pipsology (third-party forex education; unofficial, untested)



