
Key takeaways
ICT Forex ATM Method is a demo-only price-action framework for spotting failed breakouts on a 60-minute forex chart through a stop run, opposing market-structure break and retest of the broken swing.
Read the full summary
ICT Forex ATM Method is a demo-only price-action framework for spotting failed breakouts on a 60-minute forex chart through a stop run, opposing market-structure break and retest of the broken swing. A bearish setup runs above a short-term high, breaks below a nearby swing low and retests that low as resistance, with the stop slightly above the rejection high and the target below a prior low. A bullish setup runs below a short-term low, breaks above a nearby swing high and retests that high as support, with risk referenced to the key low and a target near buy stops above a prior high. ICT prefers two successive pushes through highs for bearish setups or lows for bullish setups, labeling them technically overbought or oversold without oscillators. Traders can refine entries on 15-minute and five-minute charts using a Fibonacci-based optimal trade entry to seek tighter stops while retaining the hourly target. The lesson begins the overview at 41 seconds, defines the workflow at 3 minutes 49 seconds, explains bearish validation at 4 minutes 13 seconds, covers bearish targets and stops at 7 minutes 11 seconds, introduces the bullish model at 9 minutes 38 seconds and discusses lower-time-frame refinement at 11 minutes 58 seconds. Swing selection, two-stage qualification and retest proximity remain subjective, and the video provides no statistical validation, spread assumptions, execution data or evidence of long-run profitability.
How we researched this article
BestProps used document-based research from primary firm sources, checked September 25, 2026. The complete source list, scope, limitations, and commercial-state record appear near the end of this article.
In ICT Forex – The ICT ATM Method, uploaded on December 16, 2017, ICT presents a price-action model built around a stop run, a market-structure break and a retest of a prior swing level. He describes it as a standalone pattern that traders can scan for on a 60-minute chart, while limiting the lesson’s scope to demo trading.
The central idea is to identify a failed move beyond a short-term high or low. Price then breaks a swing in the opposite direction and returns to the broken level. ICT interprets that return as a possible support-to-resistance or resistance-to-support transition. The bearish and bullish versions mirror one another.
What the ICT Forex ATM Method Means
ICT introduces the model as a relatively easy-to-spot rejection pattern that attempts to capitalize on stop runs. His preferred starting point is the hourly chart because, in his view, it is clean enough to display meaningful swings while still allowing a trader to move to lower time frames for more precise risk framing. This overview begins at 0:41.
At 3:49, he sets out the practical starting point:
- Open a 60-minute chart.
- Find a short-term swing high or swing low that price subsequently exceeds.
- Wait for price to reverse and break an opposing swing.
- Treat the broken opposing swing as a potential retest level.
- Frame a target around liquidity beyond another visible swing.
Although ICT says the concept could be applied to multiple asset classes, this presentation uses forex. That statement is his interpretation of the pattern’s portability, not evidence that it has been validated across markets.
Bearish ICT ATM Method Stop Run Sequence
The bearish model starts with price moving above a short-term high and then rejecting the advance. Crucially, ICT does not consider the pattern valid merely because the high has been exceeded. Price must subsequently trade below a nearby swing low, creating what he calls a break in market structure. He explains this validation step at 4:13.
After that downside break, the method waits for price to retrace to the swing-low level that existed before the key high formed. In conventional chart language, this is a proposed support-to-resistance retest. ICT interprets the earlier move above the short-term high as a run on stops and the later breakdown as evidence that the upper price area was rejected.
He says the setup is preferable when the key high forms during a two-stage move upward, two successive pushes through short-term highs. In his framework, that sequence represents a technically “overbought” condition without using an oscillator. This is a pattern-based use of the term, not a standardized or independently measured overbought reading.
Bearish ATM Stop and Target Framework
Beginning at 7:11, ICT places the prospective target below a prior swing low, where he expects sell stops to rest. The protective stop in his diagram is positioned slightly above the key rejection high. Thus, the entry-to-stop distance defines the stated risk, while the entry-to-prior-low distance defines the potential reward.
The transcript later refers to a chart example and specific pip distances. Those numbers describe the displayed example, not a universal ATM setting. Captions alone also cannot confirm a trade fill or the eventual result.
Bullish ICT ATM Method Stop Run Sequence
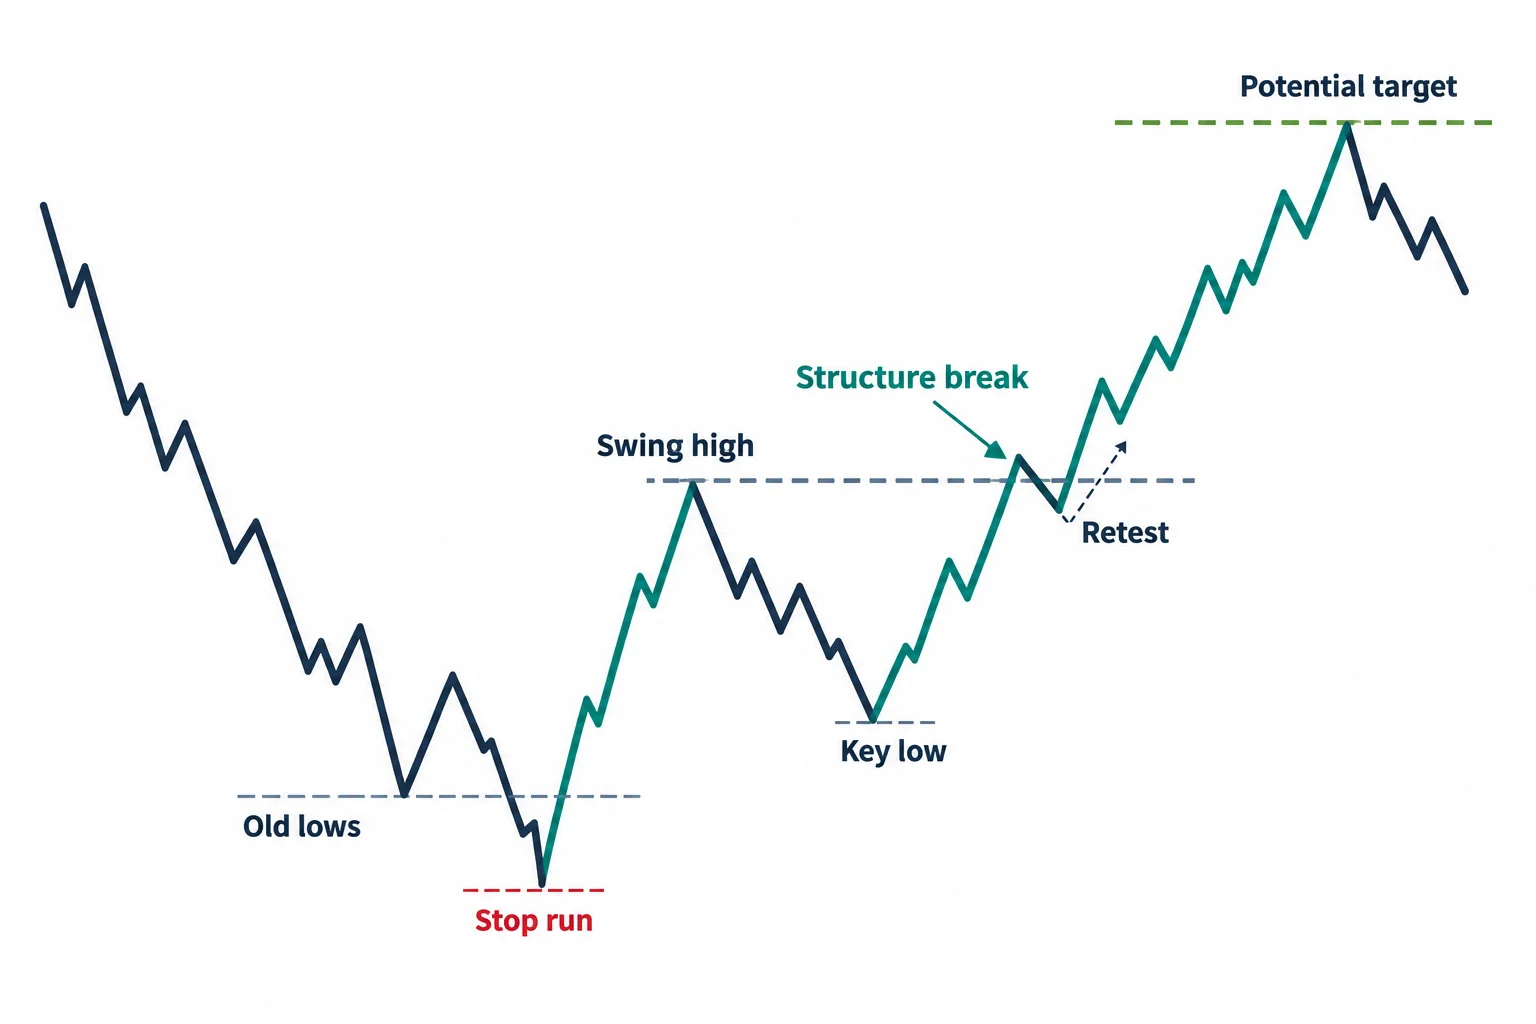
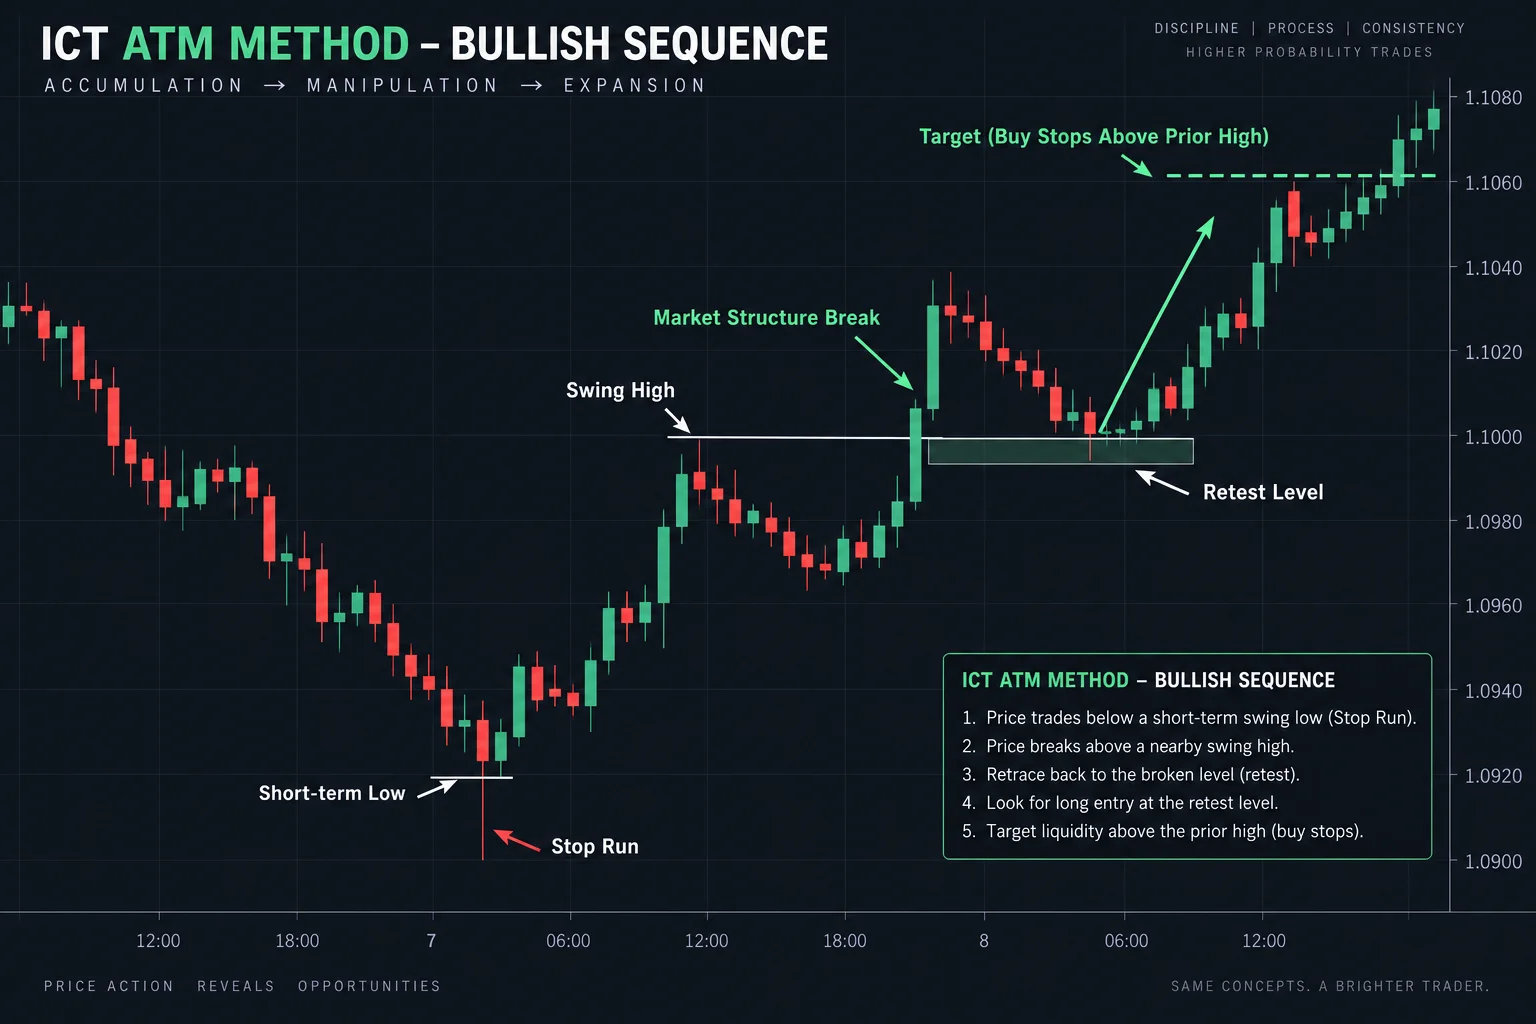
The bullish version, introduced at 9:38, reverses the logic:
- Price trades below a short-term swing low.
- It then reverses and breaks above a nearby swing high.
- The trader waits for a retracement to that broken swing-high level.
- ICT treats the retest as a possible long setup.
- A prior high (and the buy stops he assumes are above it) provides the prospective target area.
- The key low provides the reference for protective risk.
As with the bearish setup, ICT prefers to see a two-stage move, this time involving successive pushes below old lows. He characterizes that structure as technically oversold without relying on an indicator. The trade premise is that a failed move below support, followed by an upside structure break, may turn the broken swing high into support.
Refine ICT ATM Method Entries on Lower Time Frames
The hourly chart defines the setup, but ICT then demonstrates dropping to 15-minute and five-minute charts. At 11:58, he explains that the purpose is to seek a smaller stop distance while retaining the hourly target.
On the lower time frames, he combines the ATM context with what he calls an “optimal trade entry,” involving a Fibonacci extension measurement. The lesson presents progressively smaller example stops as the chart is refined. This does not mean lower-time-frame entries inherently reduce real-world risk: tighter stops can also be reached more easily, and the transcript supplies no comparative testing, spread assumptions or execution data.
ICT Forex ATM Method Risks and Limitations
In general price-action terms, the ATM method can be understood as a failed breakout followed by an opposing structure break and retest. Its distinctive terminology emphasizes presumed stop locations and liquidity around prior highs and lows. That translation can help readers analyze the lesson without treating ICT’s market narrative as a proven causal explanation.
The model also requires judgment. Traders must decide which swings qualify as significant, whether a move truly has two stages, and how closely a retracement must approach the broken level. The video does not provide statistical criteria for those decisions or demonstrate long-run profitability. It is therefore best treated as a framework for chart study and demo testing rather than evidence of a reliable edge.
Watch the complete primary source: ICT Forex – The ICT ATM Method. This summary is educational commentary, not investment advice or a performance promise.
Related Resources
- ICT Forex – The ICT ATM Method – the complete primary source video.
- Investopedia: Candlestick Charting – general reference for reading the candle patterns used in the lesson.
- Investopedia: Market Structure – general reference for the break and retest logic the method relies on.
- Investopedia: Risk/Reward Ratio – general reference for the stop and target framing demonstrated in the lesson.


