
Key takeaways
ICT Forex Market Maker Series Volume 2 of 5 presents a top-down GBP/USD framework for interpreting institutional order flow and liquidity across weekly, daily, hourly and intraday charts.
Read the full summary
ICT Forex Market Maker Series Volume 2 of 5 presents a top-down GBP/USD framework for interpreting institutional order flow and liquidity across weekly, daily, hourly and intraday charts. Recorded during the week of July 27, 2021 and uploaded July 28, the lesson treats sell stops below clean equal lows and buy stops above equal highs as potential liquidity targets, with the nearest opposing pool guiding a conditional directional bias. After price moved below weekly lows without extending significantly lower, ICT maintained a bullish view toward buy-side liquidity above similar highs, preferred entries near or below the weekly open and considered setups less attractive near the objective. On the July 26 and July 27 daily candles, Monday’s rise supported the bullish premise while Tuesday’s Judas swing declined into a daily bullish order block before moving above Monday’s high. On the hourly chart, a swing low is defined as a candle with higher lows on both sides, and the bullish sequence requires higher-timeframe bullish context, prior upward displacement, a stop run below the swing low into consecutive down-close candles, rejection and continuation higher. ICT defines the consecutive down-close candles as a bullish order block, with the range from their high to the opening price as its sensitive portion, but says context, displacement and nearby stops are required because not every down-close candle qualifies. Hypothetical entries sit near the order-block high with stops below the candle group, though beginners are warned against extreme precision and very tight stops. Repeated dips below short-term lows are interpreted as sell-side liquidity runs, with a London low followed by New York continuation cited as the session pattern. The final process is to form a weekly hypothesis, mark clean highs and lows, identify the nearest opposing liquidity pool, seek aligned lower-timeframe entries and review historical charts, while recognizing that the lecture itself does not present independently verified profitability evidence.
How we researched this article
BestProps used document-based research from primary firm sources, checked September 25, 2026. The complete source list, scope, limitations, and commercial-state record appear near the end of this article.
Primary source: Watch ICT Forex – Market Maker Series Vol. 2 of 5 on YouTube.
In ICT Forex – Market Maker Series Vol. 2 of 5, ICT presents his framework for interpreting institutional order flow and liquidity. Using GBP/USD across weekly, daily and intraday charts, he explains how he identifies clusters of stop orders, forms a directional expectation and then looks for what he calls bullish order blocks.
The lesson was recorded during the trading week of July 27, 2021, while the YouTube upload is dated July 28, 2021. Because the transcript is an automatic transcription of the audio rather than a visual record, exact price placements, candle boundaries and the precise trade execution ICT refers to cannot be independently verified from the transcript alone.
ICT Forex Weekly Market Range
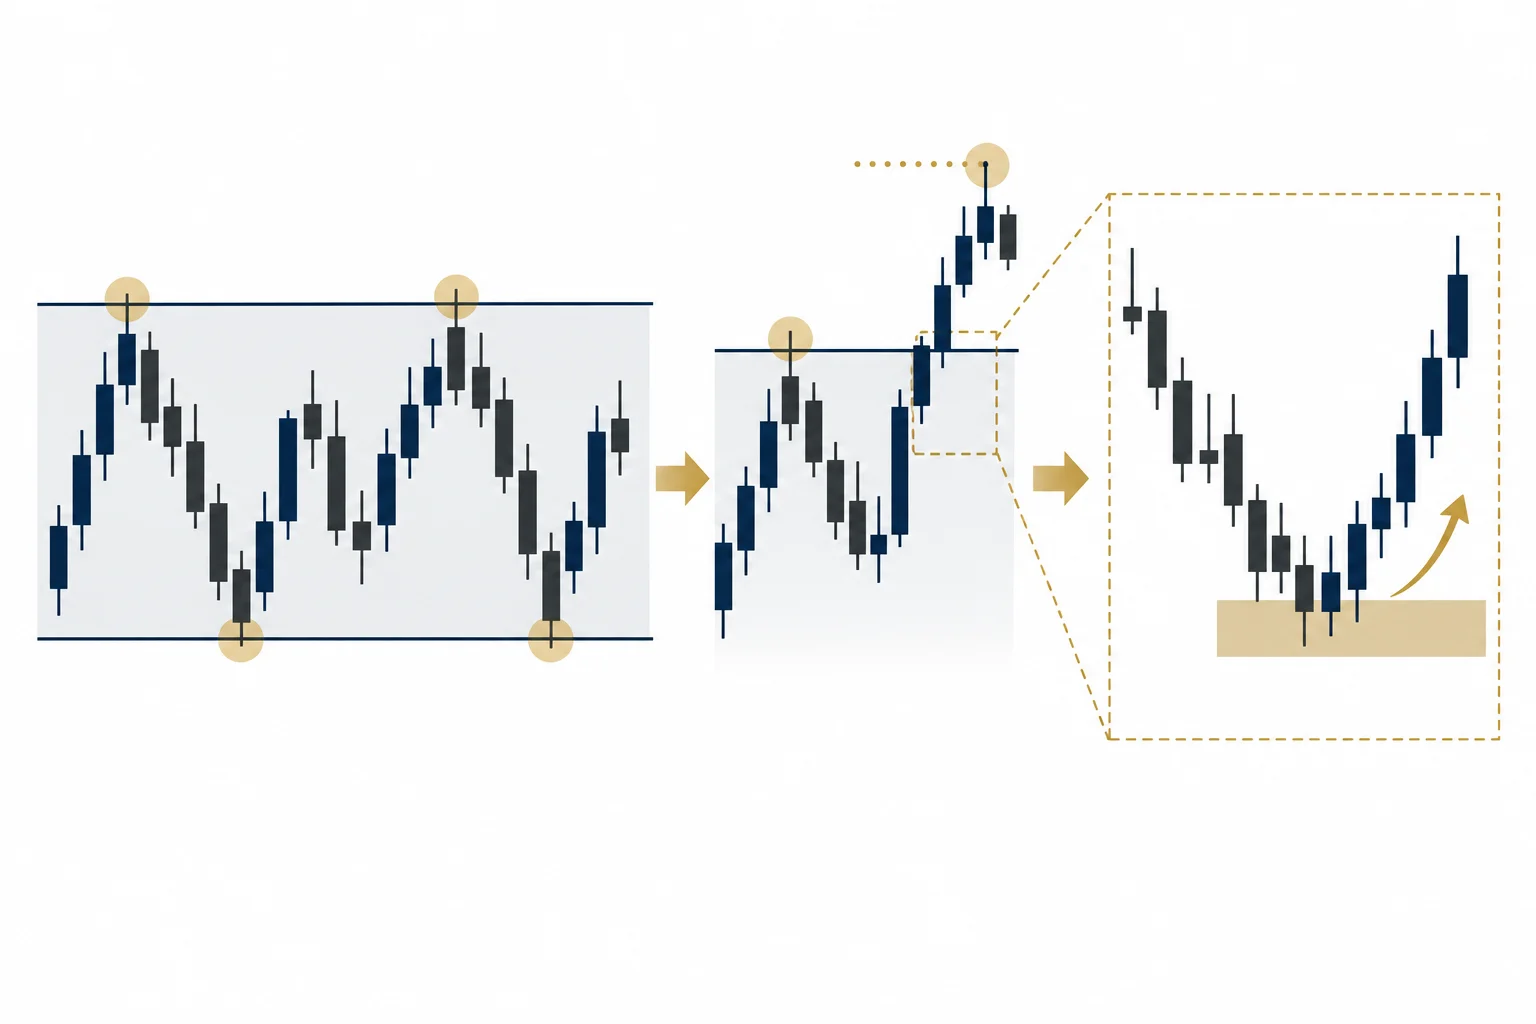
At 0:50, ICT says his weekend analysis begins by asking what the weekly chart may do. The example is a GBP/USD weekly chart in which each candle represents one complete weekly range.
He focuses on visually conspicuous levels, particularly similar highs or lows that appear unusually clean. In ICT’s interpretation, these levels matter because traders may place stop orders immediately beyond them:
- Below similar lows, protective stops from long positions create potential sell-side liquidity.
- Above similar highs, protective stops from short positions create potential buy-side liquidity.
- Breakout traders may add orders in the same areas after interpreting a support or resistance break as directional confirmation.
ICT therefore treats these collections of orders as possible draws on price. This is his market model, not proof that every equal high or low must be reached.
ICT Market Liquidity Targets
Beginning around 2:19, ICT describes sell stops beneath clean lows. He says the market had moved beneath such a weekly area before rebounding. He then turns to the opposing pool of buy stops above relatively equal highs.
At 5:08, he frames those highs as the nearer opposing liquidity target. From that premise, his weekly interpretation remains bullish until price reaches the area. He emphasizes that reaching it is not certain and that the market would need to be reassessed afterward for continuation, reversal or consolidation.
This distinction is important: the lesson is not presented as a forecast of every later movement. It is a process for forming a conditional bias. In this example, ICT interprets the failure to extend significantly lower after taking lows as support for an upside scenario.
ICT Forex Weekly and Daily Market Bias
At 6:37, ICT discusses the weekly opening price. Given his bullish premise, he characterizes a decline near or below that opening as a more favorable location than buying after price has already approached the projected liquidity pool. He also notes that the setup becomes less attractive as price moves closer to its proposed objective.
The lesson then moves to the daily chart at 8:25. ICT refers to the July 26 and July 27, 2021 daily candles. In his reading, Monday’s rise supported the bullish narrative, while Tuesday first declined into a daily bullish order-block area and then moved above Monday’s high.
He calls the initial decline a “Judas swing”: a move that may appear bearish on a lower timeframe before reversing from a higher-timeframe level. This is ICT terminology and should be understood within his broader methodology rather than as a universally standardized market classification.
Near 9:50, ICT mentions that he posted a result from a trade in GBP/USD that day. The transcript describes the trade as profitable, but does not give the entry, stop, exit or final result, and the original screenshot is not visible from the audio alone.
ICT Bullish Market Order Blocks
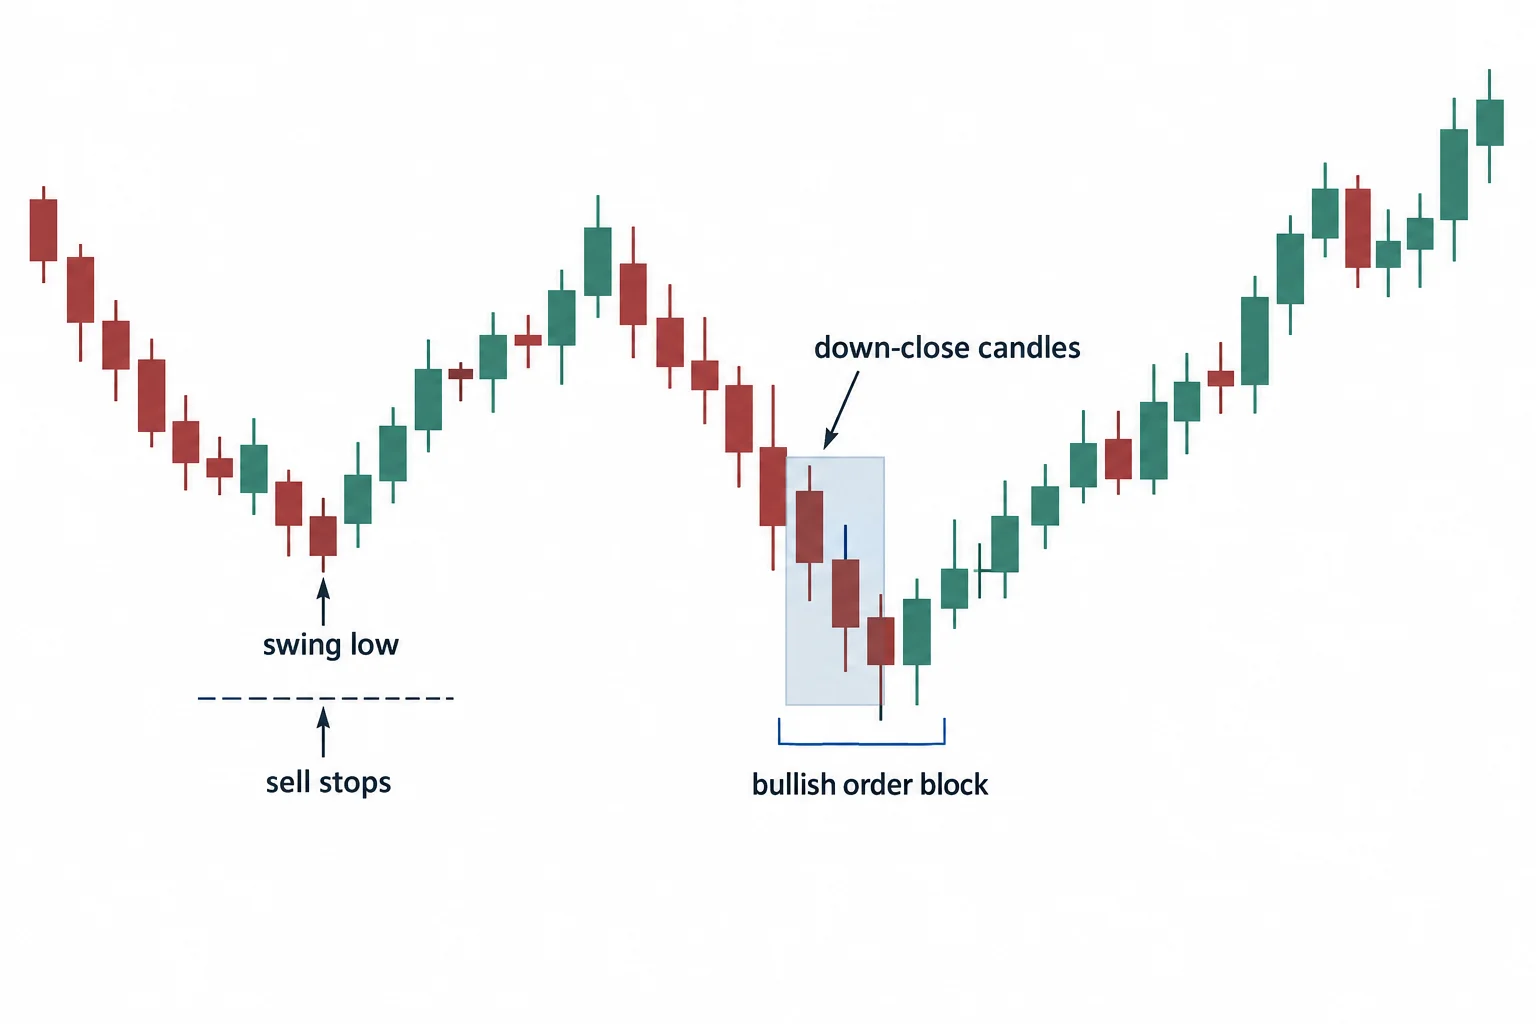
On the hourly chart, ICT carries forward the daily level and examines a short-term swing low. At 11:51, he defines a swing low as a candle with higher lows on each side and reasons that stops may sit beneath it.
His proposed sequence is:
- The higher-timeframe context is already interpreted as bullish.
- Price has demonstrated an ability to move higher.
- A short-term swing low forms, creating a possible pool of sell stops.
- Price trades beneath that low and into consecutive down-close candles.
- Price then rejects that area and resumes the anticipated direction.
At 13:23, ICT labels the consecutive down-close candles a bullish order block. He identifies the range from their high to the opening price as the sensitive portion of the area. He explicitly cautions that not every down-close candle qualifies; context, displacement away from the area and the interaction with nearby stops are central to his definition.
ICT Order Block Risk
ICT discusses hypothetical entries near the order-block high and protective stops below the group of down-close candles at 15:04. He advises beginners not to pursue extreme precision because very tight stops can be vulnerable to ordinary price and spread movement. ICT also makes broad assertions about broker behavior (that brokers have the right to widen spreads and take out tight stops) which are his characterizations, not independently verified facts.
Forex Market Liquidity and Session Flow
From 16:44, ICT points to repeated pullbacks below short-term lows followed by rallies. Under his bullish interpretation, he views these declines as runs on sell-side liquidity rather than automatic evidence of a full bearish reversal.
Near 18:22, he also describes the session pattern as a London low followed by continuation during New York trading. He names specific prospective levels, including 139.10 and the 139.20 institutional figure, but the transcript cannot establish whether they were subsequently reached.
ICT Forex Market Maker Takeaways
ICT closes by summarizing a top-down study process: establish a weekly hypothesis, mark clean highs and lows, identify the nearest opposing liquidity pool, and then use lower-timeframe structure to study potential entries consistent with that hypothesis. At 19:47, he recommends reviewing historical charts and marking prior examples to train pattern recognition.
A useful general interpretation is to treat this as a structured chart-reading exercise rather than a guaranteed model of market behavior. Historical review can help a learner apply definitions consistently, but it does not by itself establish predictive accuracy or profitability. Any live application requires independent testing and risk controls.
Further Resources
- ICT Mentorship — official site for Michael J. Huddleston’s Inner Circle Trader program, with community and core educational content.
- Babypips: Support and Resistance — beginner-oriented overview of how support and resistance levels are identified and tested, covering stops and breakouts.
- Investopedia: Stop-Loss Order — neutral reference for what a stop-loss order is, how it interacts with broker execution, and why tight stops can be vulnerable to spread widening.
- Babypips: MACD — basic introduction to momentum and moving-average concepts used in many top-down liquidity frameworks. (Educational reference, not an ICT-specific resource.)


