
Key takeaways
ICT Charter Price Action Model 8 is a top-down currency framework that targets an initial 25 pips per week, while 6% monthly growth and doubling equity over a calendar year are stated aspirations with no audited results, tested expectancy, sample size or drawdown record offered in the recording.
Read the full summary
ICT Charter Price Action Model 8 is a top-down currency framework that targets an initial 25 pips per week, while 6% monthly growth and doubling equity over a calendar year are stated aspirations with no audited results, tested expectancy, sample size or drawdown record offered in the recording. The model sets bullish or bearish direction from the weekly chart, seeks an anchor low or high formed between Monday and Wednesday, then waits for a later aligned setup – including a possible Thursday entry – rather than trying to catch the absolute weekly turning point. Bullish setups combine an early-week low, upward displacement, a retracement into a fair value gap, and liquidity above prior highs; bearish setups reverse that sequence and prefer a retracement into premium before targeting discount-side liquidity below prior lows. Supporting concepts include liquidity runs, premium and discount, equilibrium, fair value gaps, and consequent encroachment as the midpoint of a gap. Fibonacci is used only to illustrate premium, equilibrium and discount positioning. The 25-pip figure is a management milestone rather than a profit ceiling, and ICT states plainly that the setup will not appear every week, that losses are expected, and that his own example reads can be wrong. Percentage returns depend on position size, stop distance, costs, leverage, instrument characteristics and losses; the recording cannot verify its own chart markings, hypothetical entries, fills, spreads or performance.
How we researched this article
BestProps used document-based research from primary firm sources, checked September 24, 2026. The complete source list, scope, limitations, and commercial-state record appear near the end of this article.
In ICT Charter Price Action Model 8 – Targeting 6% Per Month, a 45-minute-41-second upload from the Inner Circle Trader, ICT presents the eighth of his twelve charter price action models. Although the title advertises a 6% monthly target, most of the lesson concentrates on the market narrative and trade-management logic behind a 25-pip weekly objective. The percentage target is his own stated aspiration, not a demonstrated or guaranteed return.
What ICT Price Action Model 8 does
At 0:02 ICT introduces a 6% monthly objective together with the aspiration of doubling equity over a calendar year, and immediately restates the practical model as building a career on 25 pips per week. The recording supplies no audited results, no compounding schedule and no evidence that the 6% target was reached.
The broader teaching point is deliberate simplification. From 1:48 he says each model is designed to reduce his wider mentorship material to something workable, and at 2:27 he rejects the “kitchen sink approach” of loading a model with every concept. His example: a swing-oriented framework does not need intraday standard deviations, a central-bank dealers’ range, or an Asian range deviation. He also states at 9:27 that the tools are not there to prevent losses or mistakes – “you’re going to lose” and “you’re going to get it wrong” – but to improve precision and trade management.
He also warns against an unrealistic pace: at 25:17 he says directly that a trader will not find something every single week to capture the 25 pips, and at 15:32 he advises against hunting the objective in a pair that looks range-bound. Those caveats sit alongside his confidence that 25 pips is achievable at 8:44.
How ICT Model 8 sets the weekly direction
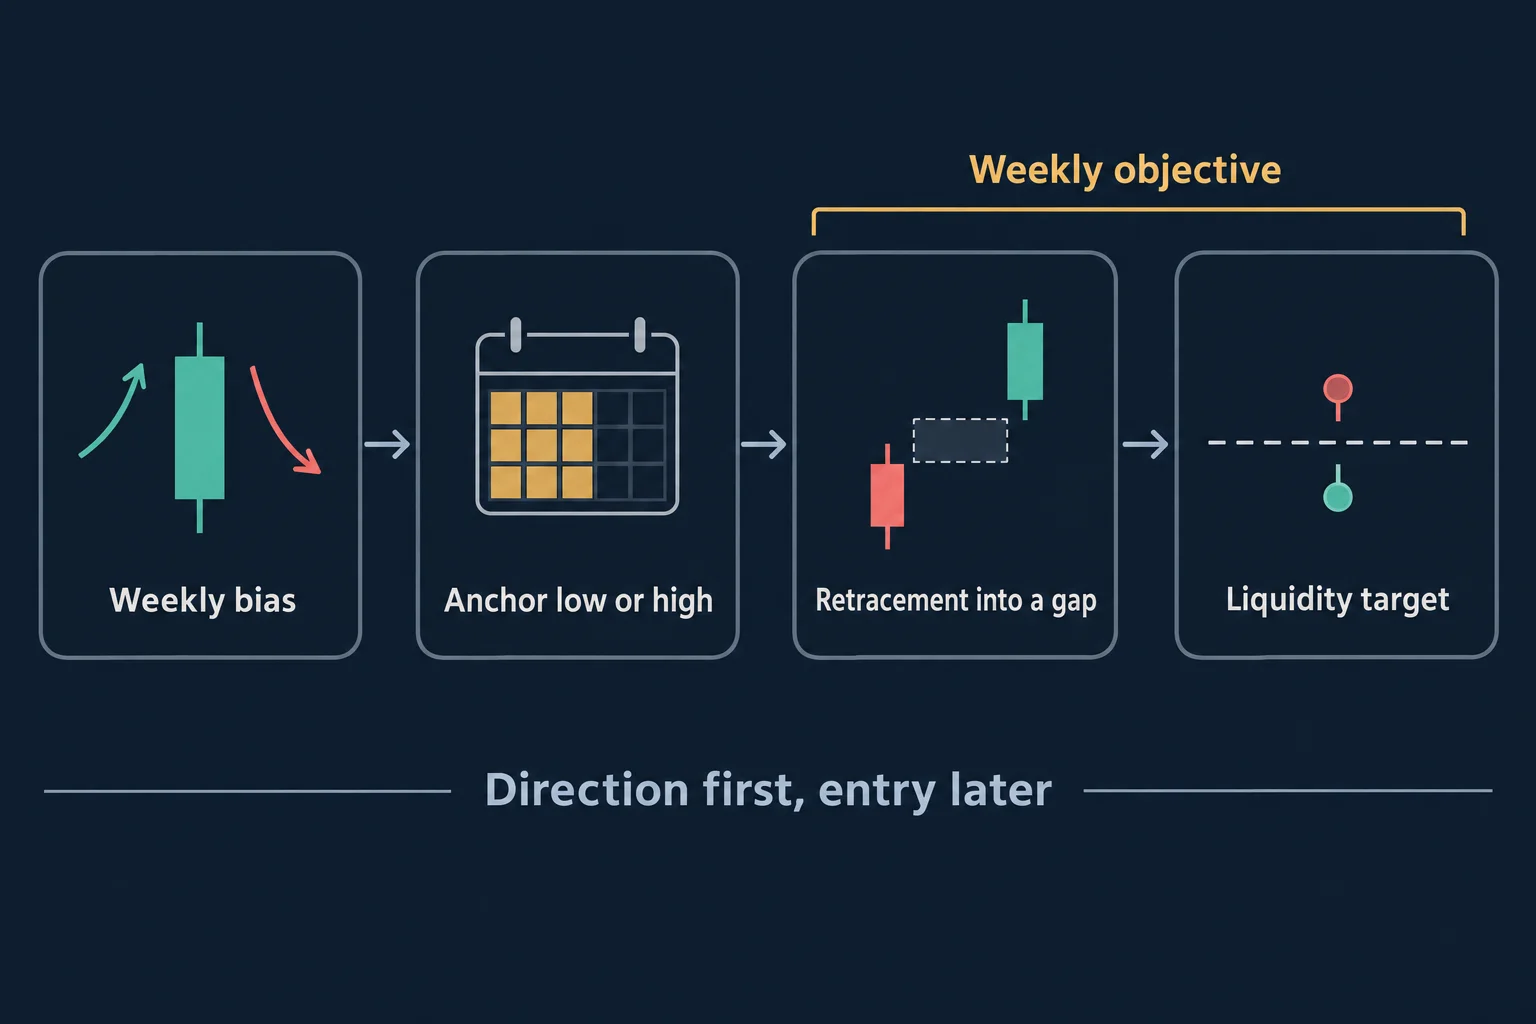
The first analytical task is to decide whether the weekly chart suggests expansion to the upside or the downside. ICT introduces this at 5:19 and ties it to his “institutional order flow” reading applied to the weekly chart from 10:00. In practical terms the weekly narrative acts as a directional filter:
- For an expected bullish weekly expansion, look for a low to form on Monday, Tuesday or Wednesday (17:28).
- For an expected bearish expansion, look for a high to form in the same three-day window (19:42).
- Wait for a later setup aligned with that weekly direction rather than predicting the exact weekly turning point.
He is explicit that the absolute weekly high or low is not required. At 13:43 he describes the target as repeatable “bread and butter” setups, the “easy reachable fruit” in the middle of the move, rather than nailing the extremes – and he says the “one shot, one kill” version of the problem belongs to Model 9.
Finding the weekly anchor point
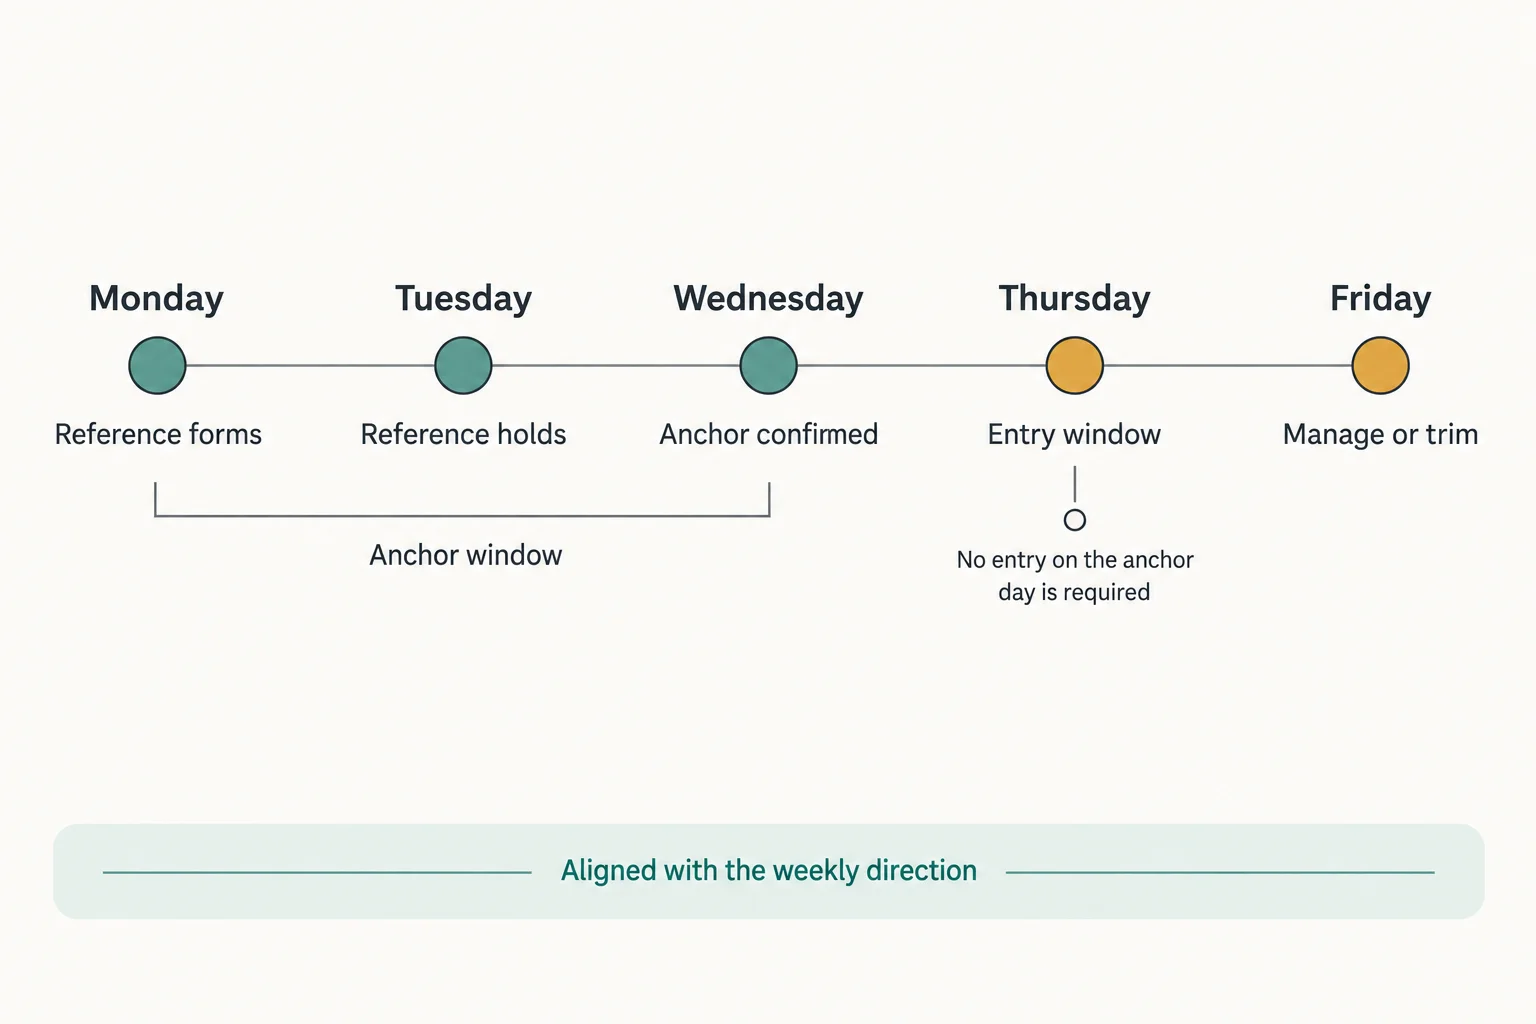
The day-of-week structure becomes specific at 16:42, where ICT says the setup begins with the day of the week. His term for the reference level is an “anchor point”; he acknowledges the term may be unfamiliar and defines it at 21:21 as simply the Monday, Tuesday or Wednesday high (for a bearish week) or low (for a bullish week) used to frame the idea.
His bearish illustration begins with a probable weekly high forming in that window. If price then moves away from that high, a retracement into a fair value gap may provide the setup context, and the downside objective is the liquidity sitting below old lows (21:05). The bullish version reverses the sequence: an early-week low, upward displacement away from it, a retracement, and liquidity above earlier highs.
Timing matters less than sequence. In the example he walks through beginning at 19:21, Monday consolidates, Tuesday begins to drop, and Wednesday pushes up into equal highs formed on Monday. Because Wednesday then creates the probable weekly high, he says the trade can be taken on Thursday (20:00). His phrasing is that entering on the anchor day itself is not mandatory – traders should stop “forcing yourself in an unrealistic mold” (20:26).
Gaps, liquidity, premium and discount
Model 8 combines the weekly narrative with several ICT-specific concepts:
- Liquidity runs: moves through old highs or lows where he interprets resting stop orders to be concentrated. In the USD/CHF example introduced at 22:22 he describes buy stops above equal highs being run before price turned lower.
- Fair value gaps or inefficiencies: ranges he considers imbalanced and likely to be revisited. He reads one such range as buy-side imbalance against sell-side inefficiency (28:42).
- Premium and discount: the upper and lower portions of a defined dealing range, with equilibrium between them.
- Consequent encroachment: his term for the midpoint of a fair value gap, defined at 28:50. He notes that the equivalent midpoint of an order block is instead called the mean threshold (28:59).
In the bearish walkthrough the preferred retracement sits in the premium portion of the range before price is expected to reach for discount-side liquidity. At 33:54 he explains that his Fibonacci overlay is not used because Fibonacci ratios generate entries: he calls it an easy way to communicate premium, equilibrium and discount to his students. The captions render his next sentence loosely – the automated transcript reads “it does not really work enough of possible trade entries” – so the exact wording about Fibonacci’s usefulness as an entry tool is not reliably recoverable from the audio alone. What is clear is that he presents the Fibonacci grid as a communication device layered on top of the price-action context, not as a standalone signal.
Managing the 25-pip objective
The 25-pip figure is presented as an initial management milestone rather than a hard ceiling. At 14:04 ICT describes looking for one good entry inside the weekly range, using it to fund the position – locking in 25 pips – and then letting the remainder run. Earlier, at 7:18, he says the model is not designed to convince a trader that 25 pips is all there is, and that the aim is to limit potential risk rather than potential reward.
In the later part of the walkthrough he describes taking partial profits in increments as the weekly range expands – ten, twenty and thirty pips beyond the initial objective – while keeping the stop fixed at the 25-pip level (37:17 and 37:45). Those are his stated intentions in a worked example, not records of executed trades.
While discussing a 15-minute USD/CHF chart he reiterates that the weekly bias governs the lower-timeframe interpretation. At 36:59 he warns against being “hypnotized” by the intraday chart into buying against a bearish weekly narrative. He also argues that a stop-out does not by itself invalidate the weekly thesis; at 31:07 he attributes a failed attempt to entering too early or too late, to placing the stop in the wrong spot, or simply to reading it wrong.
He closes the session with a reward-to-risk illustration rather than a performance claim: on the Friday re-entry he discusses, he describes a stop of less than 20 pips against a target run that he says would have been worth better than 55 pips, calling it a five-to-one setup (40:38, 41:30 and 44:02). He also sketches a lighter version of the whole exercise at 6:20, where he says the consistent pips matter more than the size of any single target. All of these are spoken examples on charts he is annotating; the transcript cannot confirm the marks, the levels, the fills or the outcome.
Limits of the recording
The most transferable lesson is process discipline: define a weekly directional thesis, wait for an early-week reference point, look for a retracement consistent with that thesis, and decide in advance what would complete or invalidate the idea. He repeatedly notes that readings can be wrong and that the pattern should be studied over many weeks rather than assumed to appear on demand.
What the lesson does not supply is evidence. A pip objective is not a percentage return: converting 25 pips into account performance depends on position size, stop distance, transaction costs, instrument characteristics, leverage and losses. Across 45 minutes ICT offers rough risk figures for particular examples, but no win rate, no sample size, no drawdown profile, no account statement and no test that compares the framework against the same levels traded without it. The 6% monthly figure and the notion of doubling equity in a year remain statements of intent.
One further limit is specific to this article’s source. The transcript used here is a local automatic speech recognition of the recording’s complete audio rather than human-checked captions, so unusual terms are occasionally garbled – it renders consequent encroachment once as “consequent encouragement” – and the video’s charts were not reviewed while writing. Prices, levels and pip distances that appear in the recording are therefore reported as the speaker’s statements and are not reproduced as verified chart data. This is why the timestamp links above point at the passages being described instead of claiming independent chart verification.
Watch the original recording
The embed above is the upload’s own YouTube player and it is left in place because it plays. This same iframe markup was loaded from a BestProps origin on 15 September 2026 and clicked: playback advanced past 18 seconds of the recording’s own 2741.0-second duration with no error notice and no owner restriction reported by the player, and the watch page reports the video as playable in an embed. All timestamp links in this article point into the same recording.
Source and further reading
- ICT Charter Price Action Model 8 – Targeting 6% Per Month – the recording itself. Watch page read 15 September 2026: about 77,000 views, 45 minutes 41 seconds, published 2 February 2024 at 4:00 p.m. Pacific (3 February 2024 UTC), playability status OK.[1]
- The Inner Circle Trader – the publishing channel’s own page, and the first-party record of what this channel uploads and when. It takes precedence over any reupload, mirror or third-party archive of the same lesson.[2]
- CFTC fraud advisory – commodity trading systems sold on the internet – the U.S. derivatives regulator’s warning that hypothetical results assume fills at specific prices, that stop orders may execute at a worse price or not at all, that spreads may not be reflected in hypothetical pricing, and that commissions raise the break-even point.[3]
- CFTC Learn & Protect – forex frauds – the regulator’s own statement that two out of three retail foreign exchange traders lose money each quarter and that past results do not guarantee future success, relevant to a weekly pip objective presented alongside a 6% monthly aspiration.[4]
- 17 CFR 4.41 – advertising by commodity pool operators and trading advisors – the rule governing hypothetical performance presentation, cited because the recording’s worked examples are annotated chart walkthroughs rather than an audited record.[5]
Any ICT, smart-money or third-party indicator, script, spreadsheet, note set, transcript or social-media summary circulating outside the publishing channel’s own upload page is unofficial and untested here. Anchor point, fair value gap, consequent encroachment, premium, discount and mean threshold are the speaker’s own vocabulary; this article reports his usage of them and does not endorse them as verified market mechanics.
- [1] ICT Charter Price Action Model 8 – Targeting 6% Per Month – The Inner Circle Trader (watch page read 15 September 2026)
- [2] The Inner Circle Trader – official YouTube channel
- [3] CFTC – Beware of fraudulent trading systems (read 15 September 2026)
- [4] CFTC Learn & Protect – Forex Frauds (read 15 September 2026)
- [5] 17 CFR 4.41 – Advertising by commodity pool operators and trading advisors (read 15 September 2026)
This is independent educational commentary on one speaker’s framework. It is not official ICT material, it is not a tested trading system, and it is not investment advice or a promise that the approach will produce profits. Leveraged trading involves substantial risk and is not suitable for everyone.



