
Key takeaways
The Inner Circle Trader reviews Nasdaq price action around the August 13, 2026 Producer Price Index release at eight thirty a.m.
Read the full summary
The Inner Circle Trader reviews Nasdaq price action around the August 13, 2026 Producer Price Index release at eight thirty a.m. ET, abandoning an initial lower-then-higher setup when price resisted the expected decline, closing the short and turning bullish. He describes taking a long, peeling off portions near Monday’s high and above Wednesday’s high, trailing below short-term lows, and retaining at most one or two contracts as runners. His framework uses fair value gaps, buy-side imbalance and sell-side inefficiency, PD arrays, relative equal highs, wick midpoints, and consequent encroachment at the 50% level, with last Friday’s daily high and Wednesday’s high acting as support references. Price reportedly cleared the prior week’s high and the smooth daily candle-body level at 30,094, but his announced stop at 30,120 removed him before the subsequent advance. He rejected further shorts or trades, while conditionally naming 30,600 and 30,975.5 as upside objectives if bullish delivery continued into the following week and suggesting, without predicting, that a new all-time high might develop. The review’s main lesson is to abandon a failed release-day thesis and separate expectations from observed price action. The article relies on an automatically transcribed recording and cannot verify chart labels, entries, fills, contract counts, profitability, or the reported price path, and it is independent educational commentary rather than investment advice.
How we researched this article
BestProps used document-based research from primary firm sources, checked September 24, 2026. The complete source list, scope, limitations, and commercial-state record appear near the end of this article.
In PPI Market Review August 13, 2026, ICT gives a deliberately brief Nasdaq review of the session around the 8:30 a.m. ET Producer Price Index release. He mentions a sinus headache and says he is keeping this one short, then explains how his initial expectation for a decline changed as price refused to move lower, which led him to drop the short idea and take a bullish intraday view instead.
He walks through the daily chart, the one-minute reaction to the 8:30 print, fair value gaps, wicks and the levels he says he used. The source for this article is a full timestamped transcript produced by automatic speech recognition of the recording’s audio rather than YouTube captions. It documents what ICT says; it cannot verify on-screen chart annotations, exact entries, fills, contract counts or the path of price, and none of it is investment advice.
ICT PPI Market View on the Daily Nasdaq Chart
ICT opens on the daily Nasdaq chart and points to the smooth alignment of recent candle bodies, describing that look as a condition where price can break through the nearby area quickly (0:23). He presents that as his own reading of price delivery, not a generally proven forecasting rule.
He says the market had already reached a downside objective he had set out earlier, and that up until the previous day’s CPI release he had no intention of looking for higher prices. By the morning of the PPI session he says the conditions were in place for a run at Wednesday’s high and possibly the prior week’s high. He also points to relative equal highs and an older inefficiency sitting above price as potential draws.
At 1:49 he says price traded up into that older inefficiency and through the relative equal highs, leaving behind the bodies he had flagged. In his framework, similar highs clustered around one level can act as a pool of resting liquidity, because protective stops tend to accumulate above them.
Everything below is what the narration states. The transcript alone does not confirm where any label sat on the chart, so the levels are reported as ICT’s spoken references rather than reconstructed chart coordinates.
ICT PPI Market Reaction and Abandoned Short
Around the 8:30 a.m. release, ICT says he first wanted to see price trade below the midpoint of a structure he had associated with a diagonal trend-line pattern. He notes almost in passing that he calls the event CPI before correcting himself to PPI. His stated sequence was a move lower first and then a rally toward Wednesday’s high; on the 15-minute view he summarises it as “go down to go up” to clear 30,000 (3:22).
Switching to a one-minute view, he says he treats trend lines less as tools than as things he looks for “victimized”, then discusses the 8:30 candle and says the opening push swept a prior day’s high before price came back into the range (3:56). He describes a structure he expected to trade down and take out a nearby low, with a short entry and a buy-back at or near that low, keeping at most one or two contracts as a runner for the move through Wednesday’s high.
In his account the decline did not develop: he says price showed an unwillingness to go lower, so he collapsed the position and went long (4:58). He also says that if he had not publicly framed the downside idea, price would probably have gone down there and taken the low out first. That is his interpretation of the session, and the transcript does not verify that any of the described fills occurred.
ICT PPI Market Gaps Wicks and Midpoints
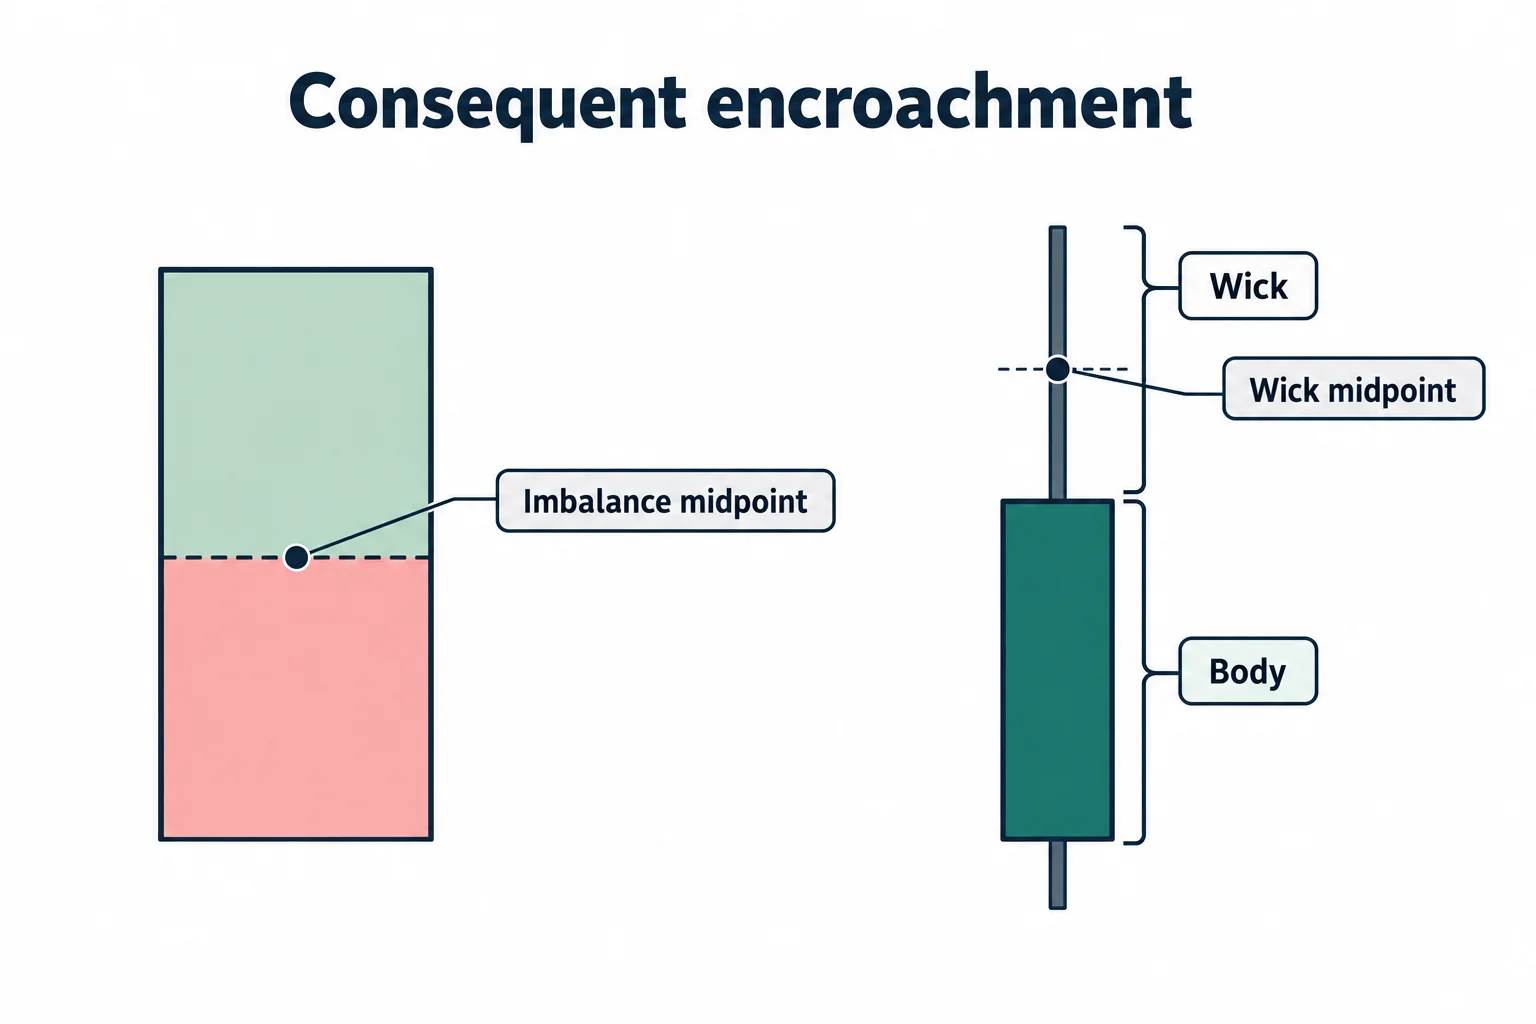
The middle of the review applies terms from ICT’s own vocabulary:
- Buy-side imbalance and sell-side inefficiency: his label for an upward price-delivery imbalance he treats as a fair value gap.
- PD array: his broad term for a price area used as a reference for support, resistance or a draw on liquidity.
- Consequent encroachment: the midpoint, or 50% level, of a referenced range, wick or imbalance.
- Relative equal highs: similar highs that he reads as a potential pool of buy-side liquidity.
At 5:11 he identifies an imbalance and says only part of the gap was filled, and he refers to last Friday’s daily high as a key PD array (5:41). According to his account, price rallied, he peeled off portions of the long once a nearby high was taken (5:49), and he trailed his stop to just below the short-term lows, a level he says the pullback then hit (6:04).
He stresses that a trader using a candle body or a gap should also check any wick immediately to its left. At 6:19 he measures the wick’s midpoint and notes that candle bodies appeared to respect it. He then describes price coming back down to touch last Friday’s daily high and the midpoint of the fair value gap before rallying (7:15).
ICT PPI Market Liquidity and Trade Management
ICT measures from Tuesday’s daily high to Monday’s daily high and marks the halfway point, which he calls an “event horizon” during this discussion (7:41). He reports taking a partial near Monday’s high and another as Wednesday’s high was exceeded (8:02). After a pullback, he says Wednesday’s daily high lined up with the midpoint of a wick and then acted as a platform for another advance, though he calls that alignment “probably random” (8:33).
At 8:35 he says price moved through the prior week’s high. He then says he made a public announcement of a stop at 30,120 (8:49), and later states that the 120 level “takes you out of the game” on that candle, leaving him out of the advance that followed (10:13). He identifies 30,094 as the level matching the smooth daily candle bodies and says that once it had been cleared he had no interest in seeing price come back into it (9:58).
ICT PPI Market Outlook for August 2026
He says he does not want to hold hard targets for the rest of the week, and that if bullish delivery continues into the following week, roughly 30,600 and 30,975.5 are the upside objectives he names, ahead of the older highs (10:41). He says a new all-time high could be in the making but stops short of declaring that outcome (10:51).
His immediate conclusion is that he is not interested in being short and not interested in taking any more trades. The recording is a conditional market interpretation, not a statement about what will happen next, and it does not establish that any of the described execution was profitable.
ICT PPI Market Lessons for Traders
The broader lesson in this review is less about predicting a PPI reaction than about adapting when the expected scenario fails. ICT describes starting with a lower-then-higher model, watching price resist the anticipated decline, closing the conflicting position, and then managing exposure around previously marked highs, gaps and midpoint levels.
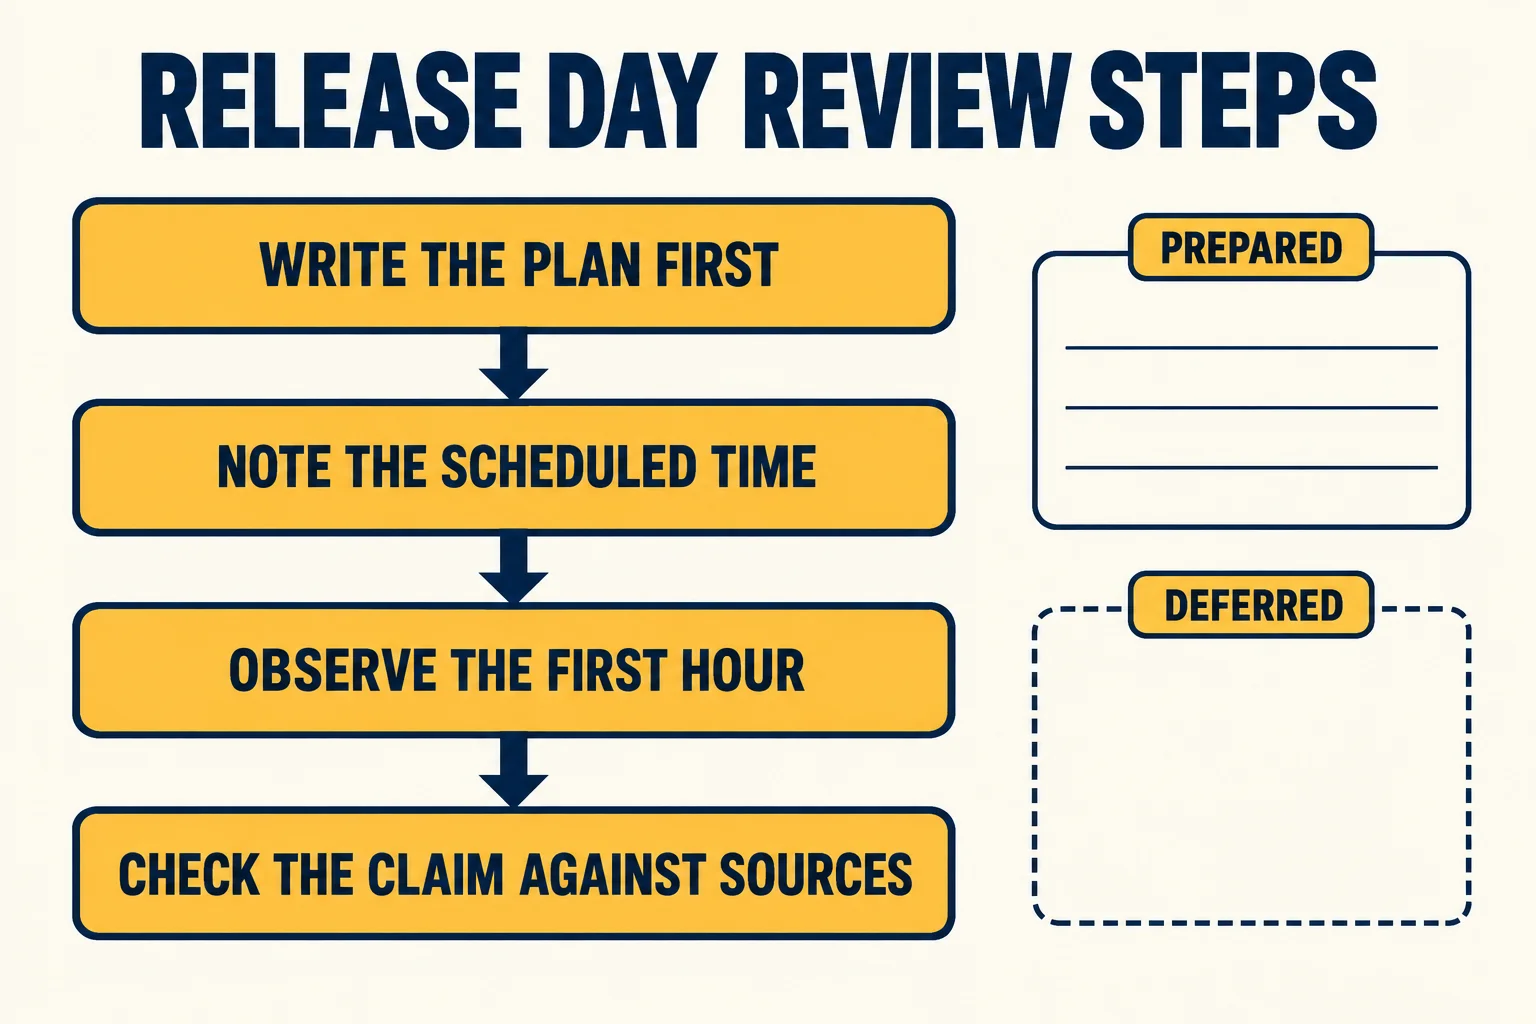
For a release-day recap, the transferable part is the order of operations rather than the levels themselves: record what the session looked like beforehand, keep expectations separate from outcomes, and check any retrospective chart explanation against the conditions that existed in real time.
Watch the ICT PPI Market Review
The mapped source for this article is PPI Market Review August 13, 2026 on the channel The Inner Circle Trader. This BestProps page is independent educational commentary: it is not a transcript, not an official ICT lesson, and not evidence that any entry, stop or result described in the recording occurred as described.
Watch the original review on YouTube
This video cannot be played inside another website: the embedded player itself reports “Playback on other websites has been disabled by the video owner.” That response was read from the player, so no player is reserved here and no embed is left blank. The full review is available directly on YouTube.
ICT PPI Market Sources and Account References
- The original Inner Circle Trader review: the recording summarised above; the timestamp links in this article point into it so each claim can be compared with its source.
- U.S. Bureau of Labor Statistics, Producer Price Index releases: the official primary record for the figures published on August 13, 2026. That site blocked automated requests during this check, so no PPI figure is quoted or summarised on this page; treat any number in a third-party recap as unverified until it is read there.
- BestProps: Prop Firm News Trading Rules: a dated comparison of news-window and restricted-period language that links the official firm documents it summarises.
- BestProps: Prop Firm Drawdown Rules Explained: compares static, trailing, intraday and end-of-day drawdown calculations in the same way.
The two rule pages are summaries with their own checked dates, and rules can change: the firm or platform that holds the account controls the current wording, and the reader’s own dashboard plus the current official document are final. Neither page is a rule set for any particular account, and neither is a performance record.
BestProps is not affiliated with The Inner Circle Trader or with the U.S. Bureau of Labor Statistics, and no source listed here endorses this article or any setup. Dealing range, liquidity, displacement and fair value gap are used on this page only as descriptive study terms, and nothing here demonstrates a tested, repeatable or profitable result. Articles like this are educational and are not individualized financial advice.


