
Key takeaways
ICT’s July 31, 2026 Nasdaq futures review defines the pre-market dealing range as the highest high and lowest low from seven a.m.
Read the full summary
ICT’s July 31, 2026 Nasdaq futures review defines the pre-market dealing range as the highest high and lowest low from seven a.m. to nine a.m. New York time, then divides it into the 50% midpoint, quadrants, octants, consequent encroachment and extensions to align price with timing and liquidity objectives. He identifies 28,723 as a projected session-high area, relative equal lows near 28,400 as the sell-side objective, the eight fifty to nine ten a.m. window as significant and eight thirty a.m. as algorithmically active. He argues that fair value gaps and order blocks require supporting structure and timing, says adjacent candles may define contact when a volume imbalance exists and treats a midpoint gap as a possible measuring gap. A second range uses the nine thirty a.m. open and prior four fourteen p.m. settlement, with a claimed 70% chance of returning toward the gap midpoint by ten a.m. He reports entering near nine thirty-four a.m., accidentally reducing three contracts instead of one, closing roughly twelve minutes later and gaining about $23,000, but no fills, position size, risk data or brokerage records verify the claim. On a one-second chart he uses one small contract to assess price behavior near a projected level, recommends counting candle bodies rather than wicks and suggests demo or micro positions for practice. The roughly 51-minute recording has recoverable speech only through 37 minutes 52 seconds, and the article presents the method as unvalidated educational commentary rather than signals or a reproducible trading system.
How we researched this article
BestProps used document-based research from primary firm sources, checked September 24, 2026. The complete source list, scope, limitations, and commercial-state record appear near the end of this article.
In Market Review NQ July 31, 2026, the Inner Circle Trader (ICT) reviews the Nasdaq futures session that closed the trading week. He begins on a daily chart and then moves down to one-minute and one-second views to explain how a pre-market dealing range, its internal divisions, and specific clock times framed his reading of the day. This article follows the recording’s own sequence and attributes the levels, the trade description and the outcome claims to the speaker, because a transcript can document what was said but cannot verify chart annotations, order fills, position size or results.
The recording runs about 51 minutes, but the recovered speech ends near 37:52. The final stretch is near-silent screen time with no spoken source, so nothing from that interval is described here, and no attempt is made to infer what the charts showed while he was not speaking. The source used for this article is automatic speech recognition of the full audio rather than YouTube captions, so specialized terms and numbers are normalized only where the surrounding context supports it, and ambiguous items are flagged rather than resolved by guesswork.
ICT Market Context and the Earlier Dealing Range
At 1:04 he opens the daily chart and describes the market rallying back into an area associated with the prior Friday’s volume imbalance. He says price then moved lower around what the transcript renders as “FMC,” and later found its way back inside the same volume balance. That acronym is ambiguous; it may be an ASR error for FOMC, so it should not be treated as established.
He states that the weekly low was, as he had suggested it probably was, already in place, and that the week had simply retraced to where it began (1:49). He also notes it was about 1 p.m. Eastern with hours still to run before the weekly settlement (2:13). His comments are therefore an intraday assessment, not a confirmed weekly close.
ICT Market Dealing Range Divisions
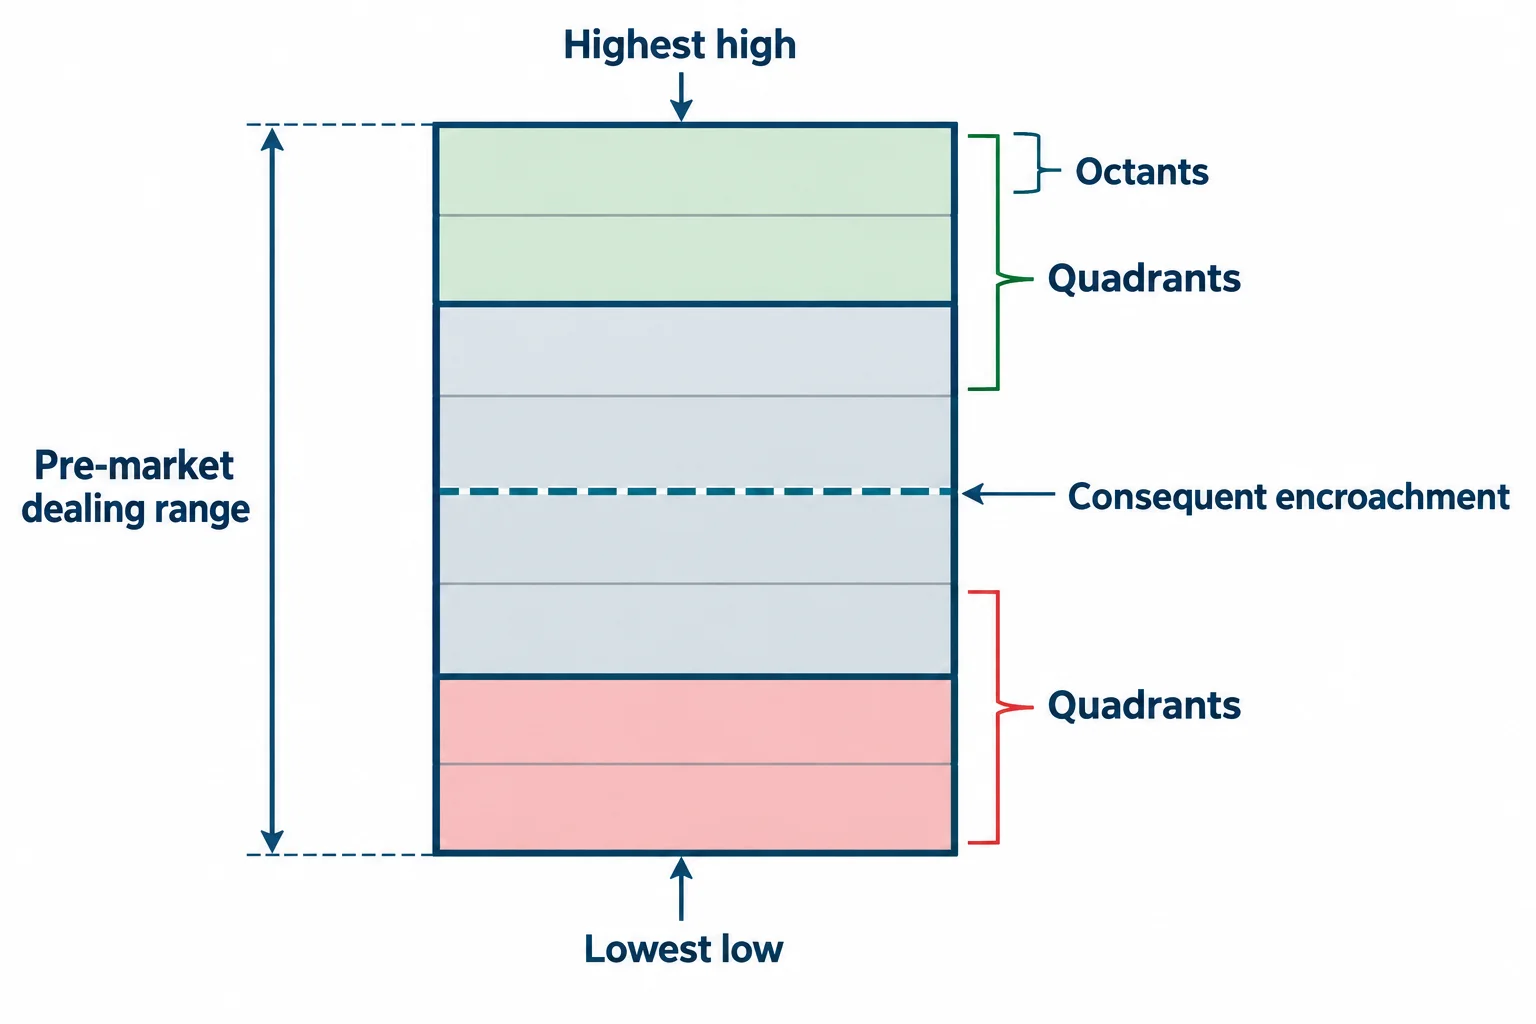
The core lesson is defined at 6:39: a pre-market dealing range is built from the highest high and the lowest low between 7 a.m. and 9 a.m. New York time. He compares that two-hour window with the first 30 to 60 minutes after the 9:30 a.m. regular-session open (6:51), and he stresses that all times are New York local time.
He then divides the selected range into progressively smaller sections, the midpoint or 50% level, quadrants, octants, consequent encroachment, and extensions beyond the range (13:18). At 8:09 he demonstrates a Fibonacci-style measurement taken from the pre-market low up to that high, and at 9:27 he identifies a projected level he reads as 28,723. In his interpretation that extension marked a candidate area for a session high; the transcript on its own cannot confirm the exact anchors or the plotted values.
ICT Time and Price Alignment Beyond Market Location
He repeatedly argues that a shape resembling a fair value gap or an order block carries no meaning by itself. Around 3:10 he says a setup needs supporting structure and a properly chosen range, with criteria that justify the label rather than resemblance alone.
His clearest illustration comes at 15:42, where he asks why price did not fall on first contact with a fair value gap. His answer is that the location was right but the timing was not, and that the level alone does not remove the need to judge where price is being drawn. Within that framework he singles out the 8:50 to 9:10 a.m. interval (11:34) and treats 8:30 a.m. as an algorithmically active time when scheduled news is often released (16:42). These are his stated timing rules, not evidence that the rules produce a dependable edge.
ICT Market Price Gaps and Candle Selection
A more technical qualification appears at 17:41. When a volume imbalance is present, he says the analyst should not use only the apparent gap candle to judge contact with an octant or other key level; the adjacent candle that allows the imbalance to exist may be the correct reference. He treats that as the reason a particular gap can be considered valid for an entry model.
He also labels gaps by their position and by what followed. Near 18:46 he points to a gap sitting at the midpoint of the pre-market range and calls it a possible measuring gap in a continuing move toward an earlier high, adding that once price breaches the 50% level it is, in his view, likely to keep going. Those labels belong to his own vocabulary and should be read through his definitions rather than inferred from appearance.
ICT Market Narrative and Dealing Execution
He says he flagged relative equal lows near 28,400 as a sell-side objective before the session, posting about it publicly (5:57, 29:07). At 21:02 he explains why he treated the projected upper level as a short area: it overlapped, in his reading, with buy-side liquidity layered into the prior Friday’s new-day opening gap and with a daily volume imbalance.
He then constructs a second range from the 9:30 opening price to the prior 4:14 p.m. settlement. He reads the two values aloud as 24.75 for the close and 76.75 for the open and corrects himself on air while checking them (23:52, 24:10). Because the readings are abbreviated, the full contract prices cannot be reconstructed from the transcript. He describes price first delivering back toward the midpoint of that opening-range gap, which he says he expected with a 70% likelihood by 10 a.m. (25:28) (a stated probability given without supporting test data) and then moving down to the 28,400 area.
On the execution itself he is specific about a mistake: he says he meant to reduce one contract and reduced three instead, which left him without the runner he had intended (28:31). He says the position was entered near 9:34 and closed about twelve minutes later, and he claims a gain of roughly $23,000 on a position he describes as not large (30:03). Those statements are his own account. The transcript provides no brokerage records, fills, contract quantities or risk information, so they remain unverified and should not be read as a performance claim or a recommendation to copy the trade. He also states plainly at 26:20 that he is not providing buy and sell signals.
ICT Market Feedback With One-Second Price Charts
The final spoken section moves to a one-second chart of the 9:45 a.m. period (31:56). He explains that he puts on a single small contract while price approaches a projected level, not to be positioned for the move but to give himself a direct read of how price behaves against his order (35:21). He advises counting candle bodies rather than wicks when assessing the run into a level (34:23), and suggests a demo or micro position as a way to build that read before committing funded capital.
The educational value is in the distinction between holding a higher-timeframe hypothesis and gathering lower-timeframe feedback. The recording also acknowledges how fast one-second data moves and how hard it is to act on. Nothing here establishes that a small live or simulated position improves forecasting accuracy, and the technique carries real financial risk in the hands of an inexperienced trader.
ICT Market Review Dealing Range Takeaway
The session’s lesson is not to mark every visible imbalance. He presents a layered process: define a time-bounded dealing range, divide it into structured levels, nominate a plausible liquidity objective, and then look for agreement between time, location and price delivery. The examples are retrospective interpretations by the speaker, and the recording does not demonstrate how consistently the method works on other sessions. Readers should treat it as one trader’s framework for study rather than a validated system.
Watch the ICT Market Dealing Range Lesson
Watch the original lesson on YouTube
This recording cannot be played inside another website. When its embedded player was opened from a BestProps origin on 13 September 2026, the player itself reported “Playback on other websites has been disabled by the video owner.” and settled on a “Watch on YouTube” prompt. A control video returned normal player metadata at the same time, so that response is specific to this recording and not a general outage. No embed is reserved or left blank here; the lesson is available directly on YouTube.
ICT Market Review Sources for July 2026
- The original Inner Circle Trader lesson: use the timestamp links above to compare each description with the recording. This article is independent commentary and is not affiliated with the channel.
- U.S. Bureau of Labor Statistics: Schedule of Selected Releases: the primary calendar for release names, reference periods and clock times, which is how a scheduled 8:30 a.m. release on a given Friday should be confirmed.
- Federal Reserve Board: FOMC meeting calendars and information: official meeting dates, plus the statement that minutes of a regularly scheduled meeting are released three weeks after the policy decision.
- BestProps: Prop Firm Drawdown Rules by Calculation Method: a document-based comparison of static, trailing and end-of-day drawdown rules. The page states it reports no first-hand account purchase, trading, support, identity-check or payout testing, so it is a reference for how rules differ, not a record of results.
This is independent educational commentary on a public recording. It is not official ICT material, not a tested trading system, and not a claim that the reported outcome can be reproduced. Futures are leveraged and can produce rapid losses; the speaker’s account of his own session is not evidence of what any other trader should expect.


