
Key takeaways
ICT’s April 30 review combines Tuesday’s daily-volume-imbalance discussion with Wednesday’s Venom example: a sell-side sweep, opposing imbalances and a move back above the low. He reports an entry, admits departing from his plan, and closes by urging new traders to reduce risk during the employment-report week. These are his narrated interpretations, not verified fills or profitability.[5]
How we researched this article
BestProps used document-based research from primary firm sources, checked September 24, 2026. The complete source list, scope, limitations, and commercial-state record appear near the end of this article.
In “2025 Lecture Series – NQ April 30, 2025 Review”, ICT reviews Nasdaq futures price action across Tuesday and Wednesday while connecting a daily-chart narrative to one-minute execution concepts. The lesson covers volume imbalances, wick consequent encroachment, fair value gaps, liquidity, opening gaps and a pattern he calls the “Venom” model.[5]
This is best treated as a study of ICT’s own market interpretation, not as evidence that the concepts produce a reliable trading edge. The transcript also cannot independently verify the chart markings, order execution or prices shown on screen.[5]
This review uses automatic transcription of the full original audio, not YouTube captions or independent chart inspection. The recording’s introduction says it combines yesterday and today; he identifies Tuesday and later Wednesday, consistent with the April 30 title. Recognition-sensitive candle terms remain qualified. The video description labels the displayed trading performance hypothetical.[5]
Daily-chart context and the proposed draw
ICT begins with Tuesday’s daily candle. He identifies a volume imbalance as an area where wicks “bridge” the space between candle bodies, but no body has yet occupied that area. He says the market traded down into this region after the open.[5]
He also measures the midpoint of a wick, which he calls its consequent encroachment. In ICT’s framework, these wick midpoints can act as reference levels. He describes another wick and its midpoint as possible upside draws ahead of the week’s employment-related news, while explicitly acknowledging that his expectation could be wrong.[5]
At 2:43, he summarizes Tuesday as a move into the daily volume imbalance and wick midpoint, followed by a rally through the prior day’s high and into another wick. He then adds 25% and 75% subdivisions alongside the wick midpoint as potential reference points. These are ICT’s anticipated targets, not outcomes established by the transcript alone.[5]
From higher-time-frame areas to the one-minute chart
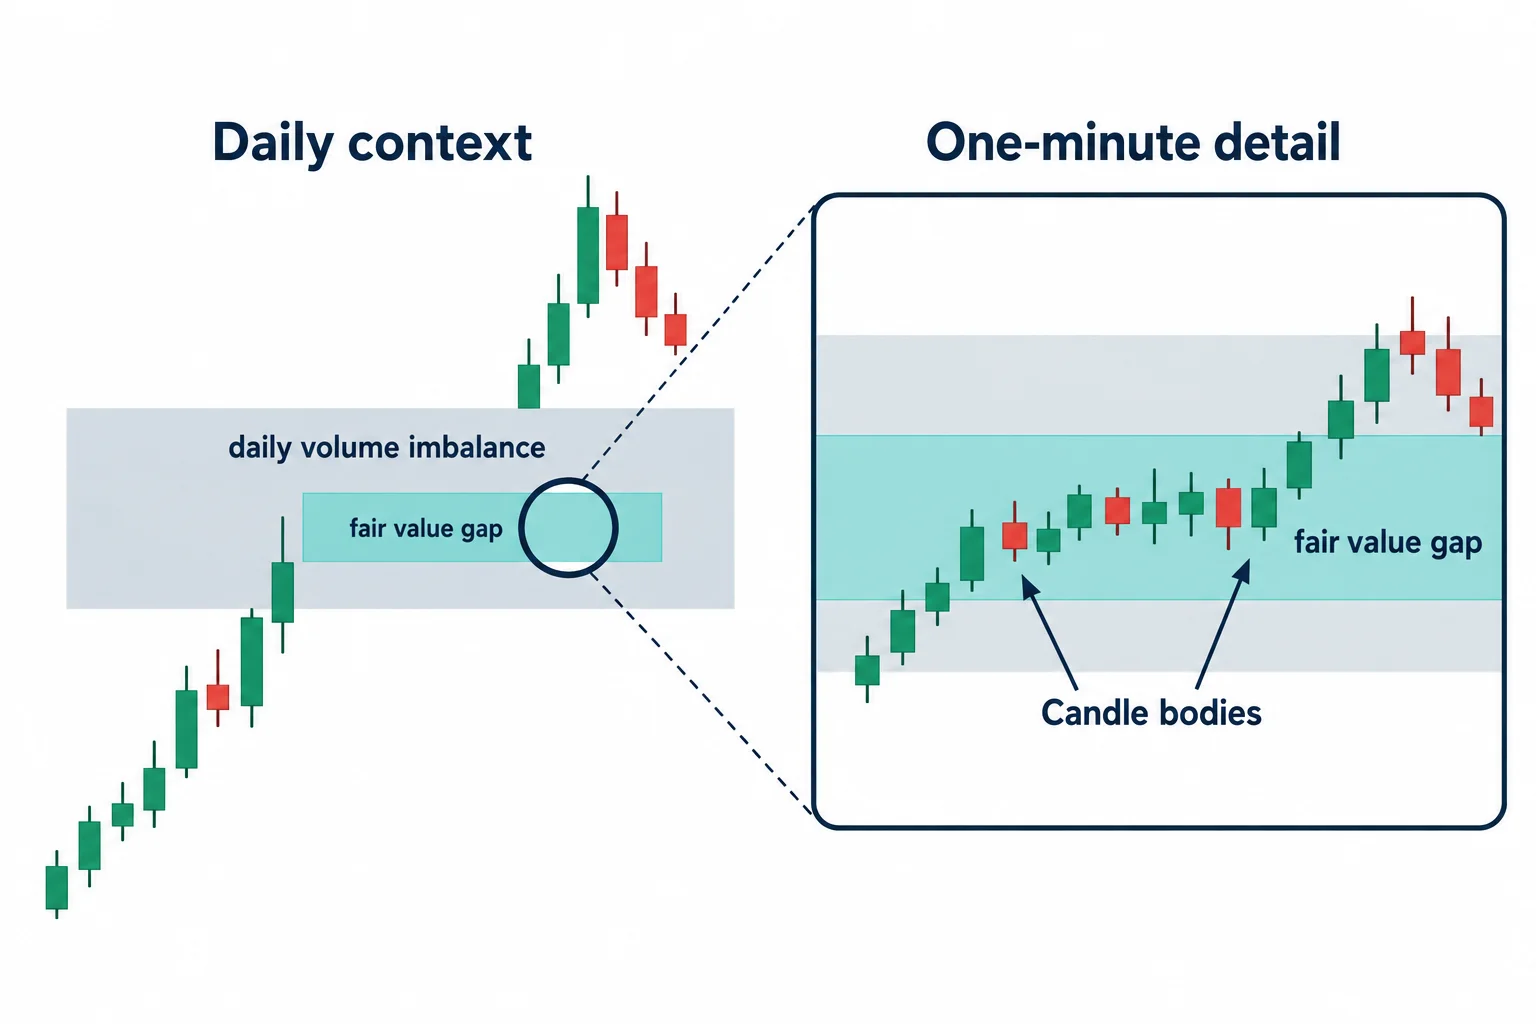
The review shifts to the one-minute chart around 3:56. ICT revisits a fair value gap that he says had been discussed in an earlier review. This intraday gap sits within the larger daily volume imbalance, illustrating the session’s central teaching idea: use a higher-time-frame area to frame lower-time-frame behavior.[5]
He then highlights several elements in Tuesday’s sequence:[5]
- Relative equal highs, interpreted in his terminology as buy-side liquidity.
- A move below a short-term low, described as taking sell-side liquidity.
- A reaction near the midpoint of the daily volume imbalance.
- Candle bodies respecting a fair value gap that he characterizes as an inversion fair value gap.
- Later interaction with the new week opening gap.
Beginning near 6:45, ICT emphasizes the candle bodies around the inversion fair value gap. In his reading, price tests the area, rallies, revisits it and then moves away before returning to the daily imbalance boundary. He subsequently describes price trading around the new week opening gap during the afternoon and Asian session.[5]
April 30 and the “Venom” model
For Wednesday’s action, ICT says he was monitoring an inversion area before price moved into a new week opening gap and then declined toward the April 25 opening range gap. The most detailed setup discussion starts at 9:25.[5]
ICT calls this sequence his “Venom” model. As presented here, it contains the following components:[5]
- A directional expectation—in this example, he was looking for higher prices after an extended decline.
- A move through a short-term low that he interprets as a sweep of sell-side liquidity.
- A strong bearish price imbalance followed by a strong bullish imbalance.
- Displacement back above the swept low.
He calls the opposing bearish and bullish imbalances the model’s two “fangs.” The automated transcript renders their abbreviations as “SIVI” and “BISI,” but the first term is ambiguous and may be an ASR error. The supported conceptual point is that ICT is pairing a forceful move below liquidity with a forceful reversal above it.[5]
Entry and invalidation logic
At 11:38, ICT explains two possible entries within his framework: a buy-stop at the referenced candle’s high or a limit order at its opening price or below. He states that he used the latter approach and cites 19,174.00 as the order level. Because the source supplied here is an audio transcript without chart verification, the claimed on-screen fill marker and execution cannot be independently confirmed.[5]
For invalidation, ICT points to the midpoint of the bullish imbalance he has marked, while describing the Venom structure as a balanced price range. His premise is that the proposed Venom setup should not return through that midpoint; if it does, he says the setup is probably wrong. This is a description of his trade-management logic, not a tested rule or assurance against loss.[5]
ICT also candidly says he closed the position for a discretionary reason rather than according to his intended plan. At 13:19, he explains that he became distracted, lost sight of the limits he had set for the demonstration and exited. That admission is one of the more generally useful lessons in the video: identifying a setup and following a process are separate skills.[5]
Opening gaps as reusable reference areas
Later in the session, ICT interprets reactions around the April 25 opening range gap and the current new week opening gap. He argues that an opening gap can remain relevant after its initial fill, serving within his method as a possible entry, resistance or target area.[5]
Near 16:30, he gives a compact example involving a wick midpoint. Once price is above the wick, he calls it a “discount wick” and treats a pullback to its consequent encroachment as a potential entry when aligned with an anticipated return toward the weekly opening gap. This is another example of his recurring hierarchy: directional context first, then a nearby liquidity or imbalance reference, followed by a lower-time-frame trigger.[5]
Risk is the closing lesson
The final section is notably cautious. From 17:08, ICT says the Wednesday afternoon action is not attractive to him during a major employment-report week. He advises inexperienced students to reduce exposure, leverage and trading frequency, particularly during the final hour on Wednesday and Thursday.[5]
He suggests observation, paper trading or tape reading instead of forcing trades under those conditions. Regardless of whether a viewer adopts ICT’s terminology, this closing point is broadly educational: uncertain conditions do not require participation, and a market thesis should not override predetermined risk limits.[5]
Key takeaway
The April 30 review demonstrates how ICT links daily imbalances and wick measurements to one-minute liquidity events and opening-gap reactions. Its central case study is the Venom sequence: a sweep below a low, opposing imbalances and displacement higher. Just as important, ICT describes his own failure to follow his planned execution constraints and ends by advocating less risk during a potentially volatile news week. The material is educational commentary on one speaker’s framework, not investment advice or a promise of performance.[5]
A repeatable study process
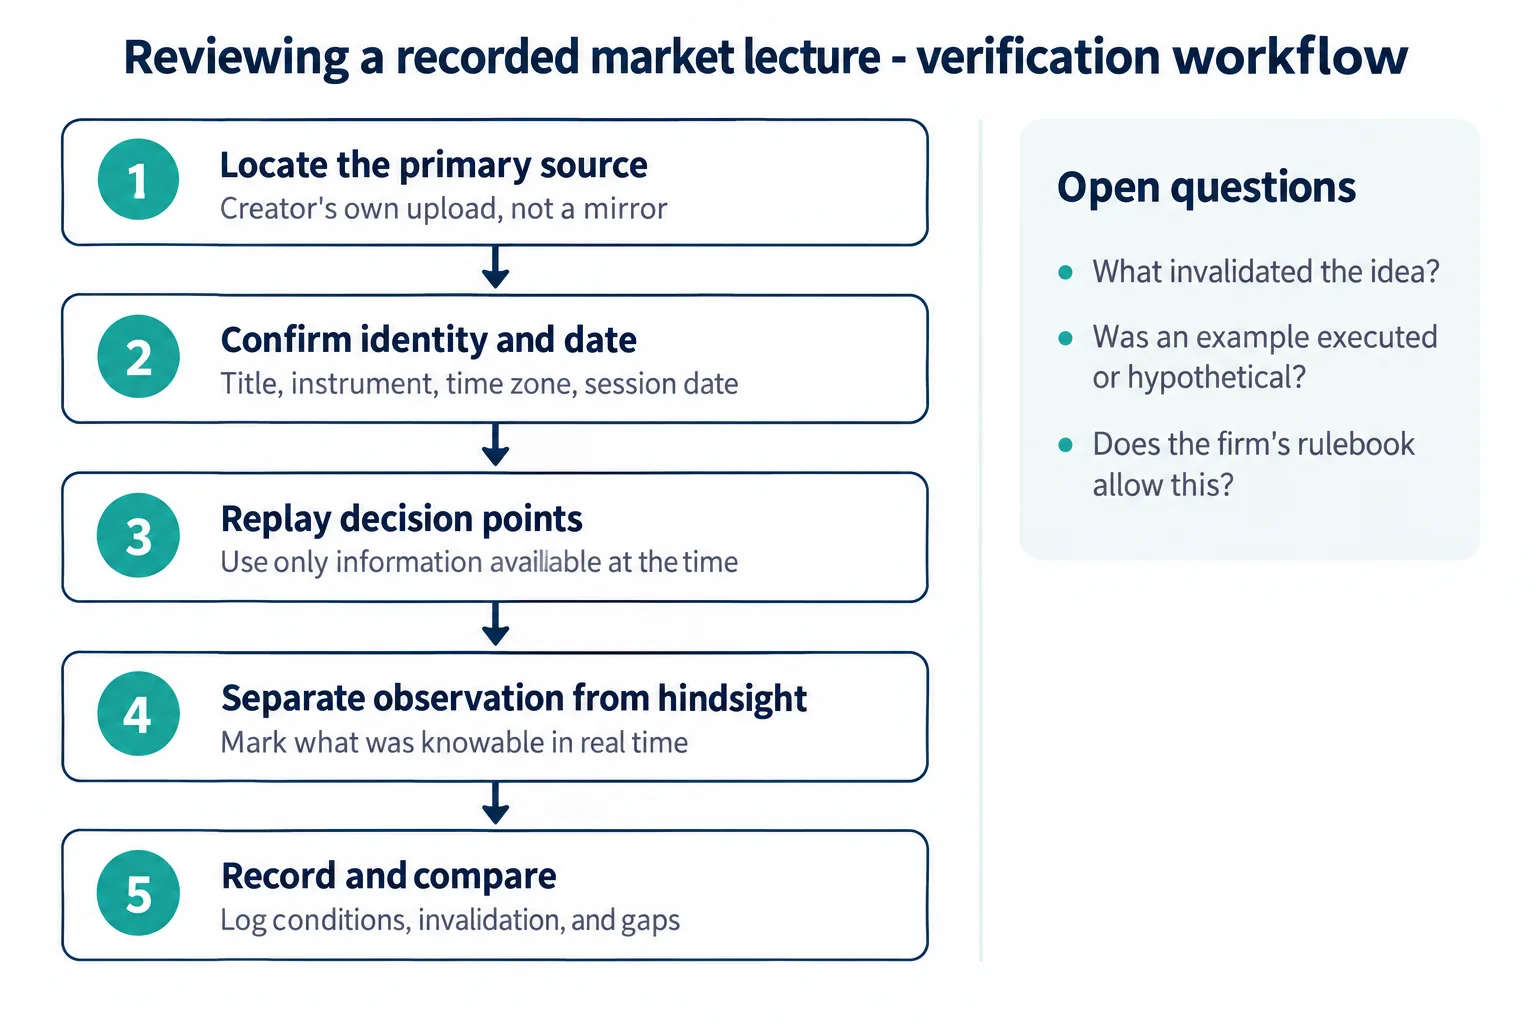
The following illustration is a general review workflow, not ICT’s own diagram or a reconstruction of the recording’s charts. The original source is identified above; use the later steps to keep interpretation and hindsight separate.
Watch the original review
2025 Lecture Series – NQ April 30, 2025 Review
The original player reported that playback on other websites was disabled by the owner in the saved playback test. Use the original YouTube watch page.
Watch the original lesson on YouTube ↗Resources for your own review
TradingView’s own Bar Replay guide explains selecting a historical starting point and advancing one step at a time. Its documentation also warns that ordinary Paper Trading and broker-panel orders use real-time data during chart replay. These are platform instructions, not a claim that this article tested a strategy.[1]
NinjaTrader’s Trading Hours documentation explains how session templates set chart session start and end times. Record your own template before comparing gaps; this does not establish which settings ICT used.[2]
For funded-account study, the BestProps drawdown reference distinguishes account-loss limits and their calculation methods. Confirm the current rulebook for your specific program rather than treating a narrated stop as proof of account compliance.[4]
Sources
- [1] https://www.tradingview.com/support/solutions/43000474024-how-do-i-turn-bar-replay-on — TradingView Help Center: How do I turn Bar Replay on?
- [2] https://support.ninjatrader.com/s/article/Trading-Hours-Desktop — NinjaTrader Support: Trading Hours Templates – Desktop
- [4] https://bestprops.com/rules/drawdown — BestProps: Prop Firm Drawdown Rules by Calculation Method
- [5] https://www.youtube.com/watch?v=mQsT-xux5Xk — The Inner Circle Trader: 2025 Lecture Series – NQ April 30, 2025 Review


