
Key takeaways
ICT reviews a one-minute index futures chart against a daily premium wick, marking its high, low, consequent encroachment and quadrants before tracing a premarket buy-side liquidity run near seven a.m., rejection, bearish fair value gap, premium retracement, breaker, bearish order block, measuring gap and late-session balance.
Read the full summary
ICT reviews a one-minute index futures chart against a daily premium wick, marking its high, low, consequent encroachment and quadrants before tracing a premarket buy-side liquidity run near seven a.m., rejection, bearish fair value gap, premium retracement, breaker, bearish order block, measuring gap and late-session balance. He reads the wick midpoint near 24,874.5, upper quadrant near 24,790.5, bounce near 24,836, larger-gap reference near 24,655 and lower quadrant near 24,629.5. At 2 minutes 22 seconds, he links the sequence of buy-side liquidity being taken, a market-structure shift and retracement into a premium fair value gap to his 2022 model. From 5 minutes 23 seconds, the main lesson is discretionary wick selection, starting with the first relevant wick to the left, plotting adjacent candidates and observing which gradients price respects rather than applying a mechanical rule. At 6 minutes 37 seconds, he says this comparison is especially important near all-time highs where overhead references are limited. The levels and labels are ICT’s retrospective interpretations from an automatic transcript, not independently verified chart markings, executions, results or predictive evidence.
How we researched this article
BestProps used document-based research from primary firm sources, checked September 24, 2026. The complete source list, scope, limitations, and commercial-state record appear near the end of this article.
In “Focus On Index Futures September 24, 2025 | Intermediate Term High Continued”, ICT reviews a one-minute index futures chart alongside a daily chart. The lesson focuses on how he marks premium-wick gradients, compares competing wicks and observes whether intraday price respects those reference levels.
This is a retrospective explanation of ICT’s chart-reading framework, not independent proof that the concepts predict market movement. Because the source is a timestamped automatic transcript of the recording’s full original audio, produced locally rather than from the channel’s captions, some contract terminology and quoted numbers should be checked against the original video, and the chart annotations themselves were not available for visual inspection.
One note on the title: it refers to an “intermediate term high continued”, but the spoken content does not develop that phrase. What the recording supports is the wick-gradient and one-minute sequence discussion set out below.
ICT Index Futures Daily Wick Levels
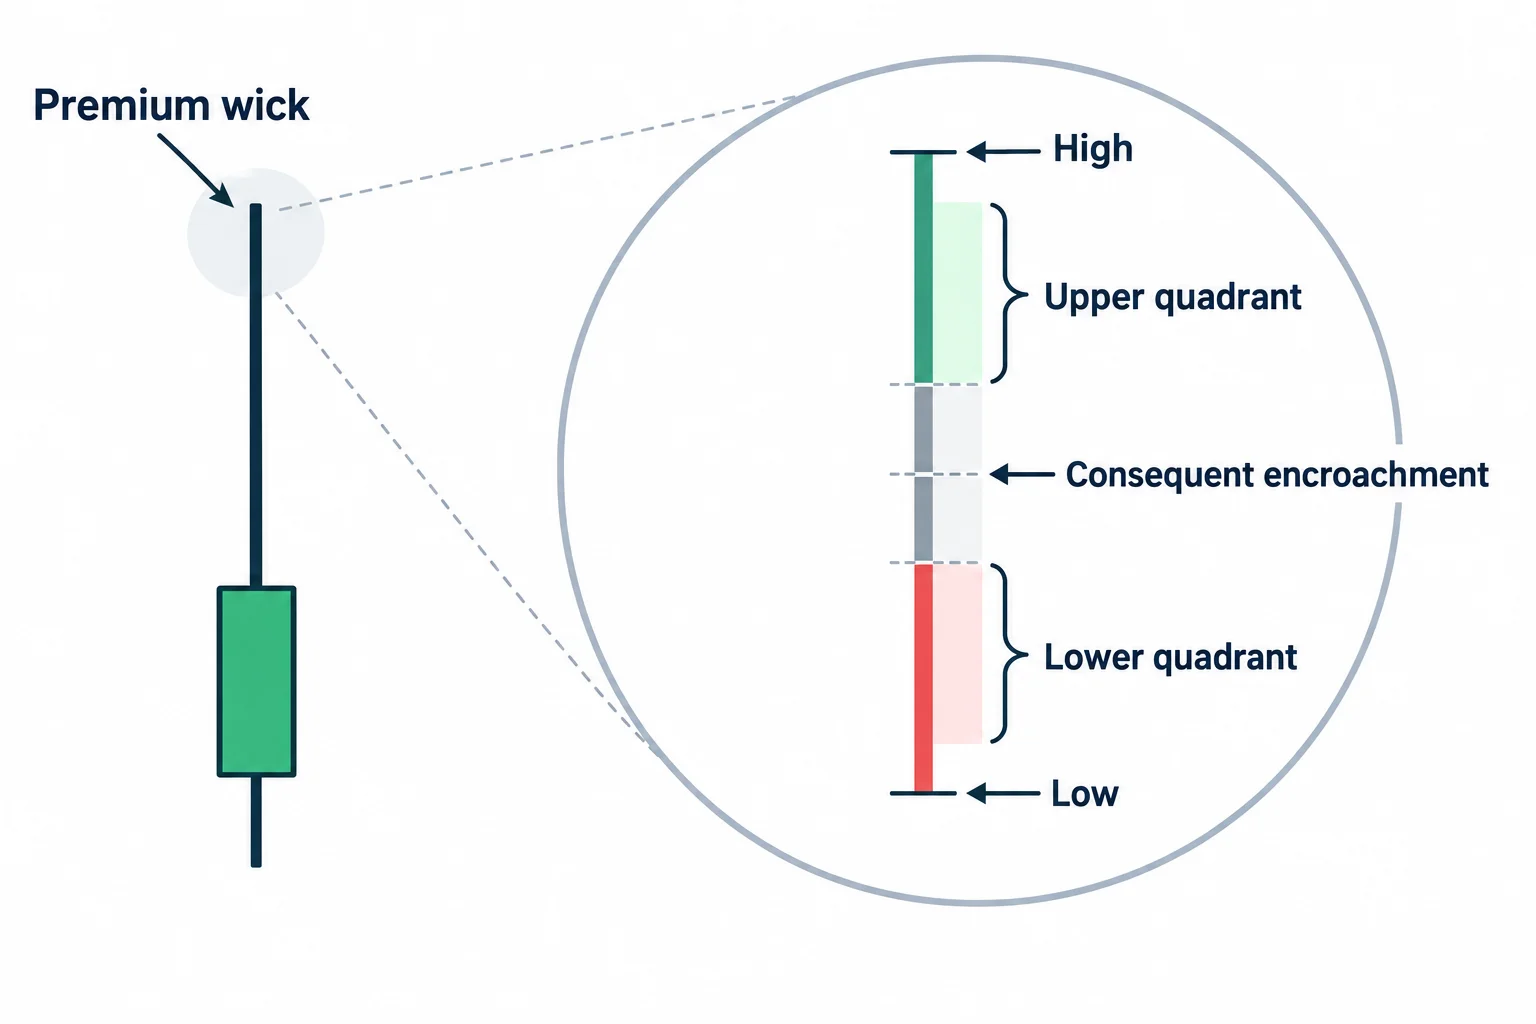
At the 0:27 mark, ICT introduces a premium wick divided into several references: its high, low, consequent encroachment and upper and lower quadrants. “Consequent encroachment” in ICT terminology generally denotes the midpoint of a selected range or imbalance. The quadrant levels subdivide that range further.
His main practical point is to carry these higher-time-frame references onto the smaller chart. He then interprets the intraday action in relation to premarket buy-side liquidity, the 9:30 a.m. Eastern open and the marked daily wick. In his reading, price had already formed and rejected a premarket high at around 7 a.m., reducing the likelihood that it needed to reach a more distant liquidity pool above.
ICT says price reached a nearer buy-side pool and subsequently moved toward sell-side liquidity inside the premium wick. Near 1:20, he describes a return to the wick’s consequent-encroachment level, which he reads out as 24,874.5, before price broke below the wick’s low. He then marks the upper quadrant of the same wick at about 24,790.5. Those figures come from automatic transcription of the audio and should be checked against the recording before they are reused.
ICT Index Futures Fair Value Gaps
The review then turns to the first fair value gap formed after the cash-session open. ICT labels it a bearish imbalance, apparently using the term “SIBI”, although the automated transcript renders that term inconsistently. He says price traded back into the gap and rejected lower, then bounced into the 24,836 area and formed relative equal highs.
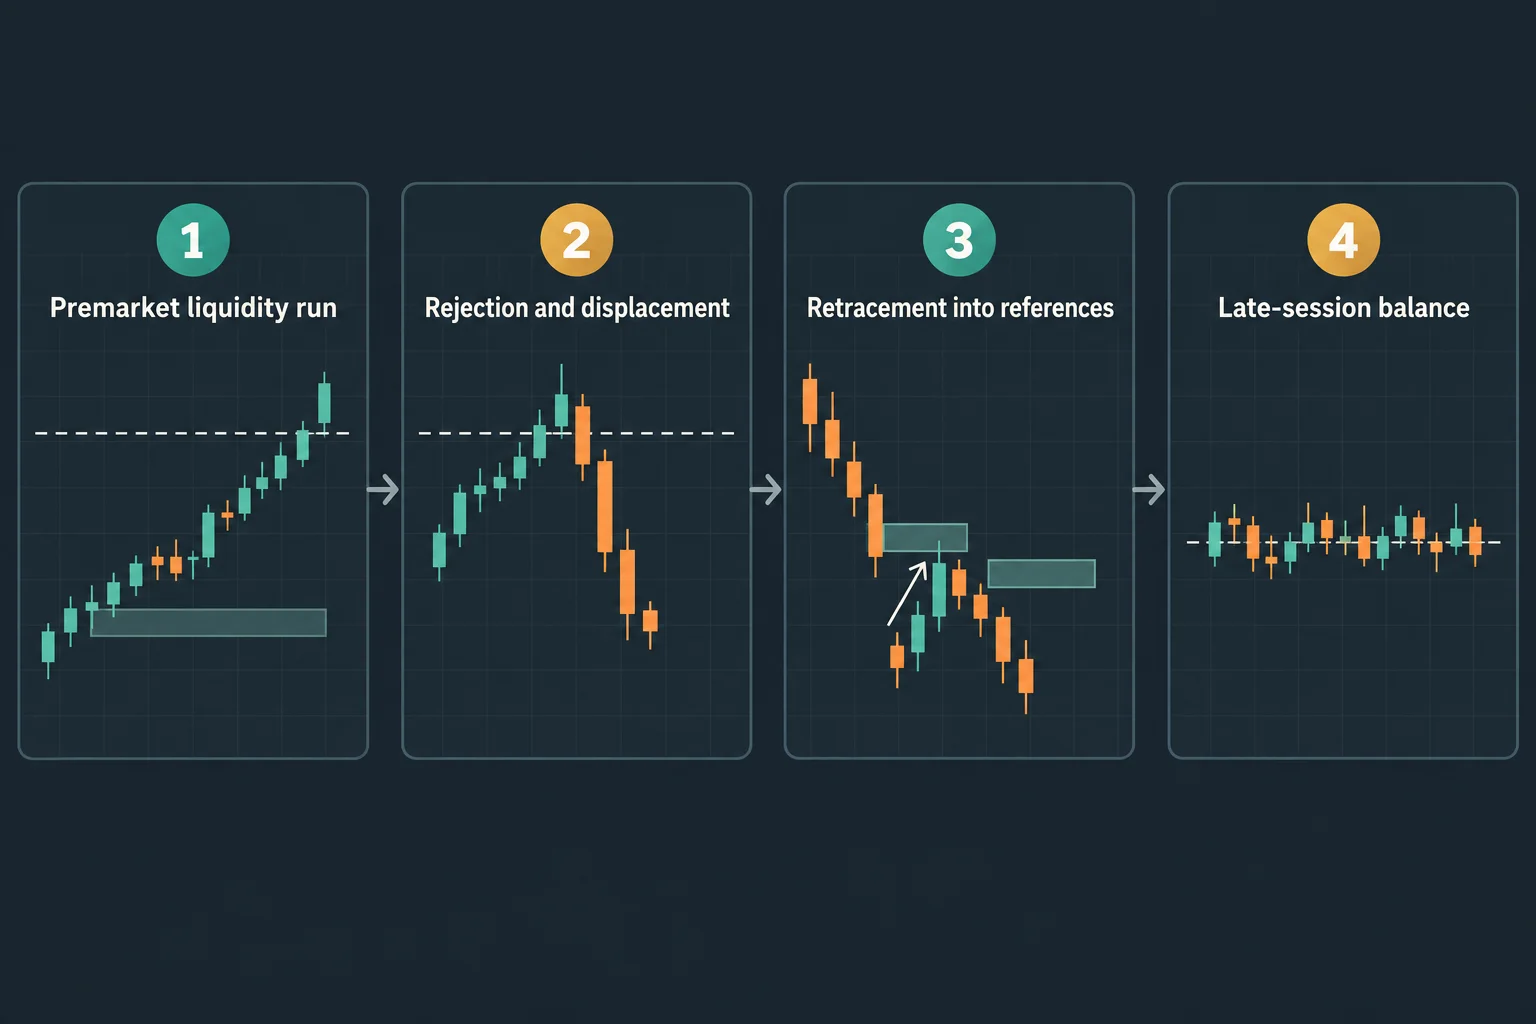
At 2:22, ICT advances the chart and outlines the following sequence:
- Price consolidated near a prior candle’s wick high.
- A bearish fair value gap appeared as price moved away from the consolidation.
- Price retraced into an imbalance situated in what ICT regarded as premium.
- The market then continued lower in the chart segment under review.
ICT associates this sequence with his “2022 model”: buy-side liquidity is taken, a market-structure shift occurs, and price retraces into a premium fair value gap before declining. He also identifies what he calls a breaker and a bearish order block, which he describes as changing the state of delivery. These labels represent ICT’s interpretation of the displayed price structure; the transcript alone cannot verify the chart markings or establish that another analyst would classify the formations identically.
ICT Index Futures Target Ranges
Beginning around 3:20, ICT applies the same gradient idea to a larger fair value gap. He marks its high, low, midpoint and quadrant divisions, then narrates price moving into those subdivisions, reading out levels around 24,655 and a lower quadrant near 24,629.5.
He later describes a measuring gap, another bearish fair value gap and a reaction near the upper quadrant of the larger gap. The remainder of the session, as presented by ICT, included consolidation, a deeper retracement into a bearish imbalance and trading into the close between the earlier premium-wick and fair-value-gap references. No unseen fills, executions or later results can be inferred from this narration.
Why ICT Selects One Index Futures Wick
The most broadly useful teaching begins at 5:23. ICT addresses why he selected one wick rather than an adjacent candidate. He says he starts with the first relevant wick when looking left, plots its gradient levels and then evaluates the next available wick as well.
His selection is not presented as a fixed mechanical rule. Instead, ICT tells viewers to plot the candidates and watch which set of levels price appears to respect. He argues that adjacent wicks will rarely produce perfectly aligned gradients or confluence with the same premium and discount arrays.
At 6:37, he emphasises observing whether price responds to one inefficiency or wick more clearly than another. When an index is trading around all-time highs, he says available wicks should be considered because historical overhead reference points may be limited, and he adds that following the method does not remove the workload of plotting the candidates and judging them while price is still delivering.
ICT Index Futures Trading Lessons
The lesson is less about memorising a single wick-selection formula and more about maintaining multiple hypotheses. Within ICT’s framework, a student would mark plausible higher-time-frame wicks, subdivide them consistently and then compare live reactions at those levels. That process still involves discretion: “respect” has to be defined in advance if the idea is to be reviewed objectively rather than selected only after the move.
For study purposes, screenshots or replay notes could record every candidate wick before the subsequent action is evaluated. That would help separate ICT’s conceptual framework from hindsight-based chart annotation. This material is educational commentary and is not investment advice or a promise of trading performance.
Watch the ICT Index Futures Lesson
This article draws on the timestamped transcript of “Focus On Index Futures September 24, 2025 | Intermediate Term High Continued”. A transcript is evidence of what the speaker said, not independent proof of the levels he read out or of any trading outcome. The recording’s own chart annotations remain the primary reference when following the explanation.
Watch the original lesson on YouTube
The video cannot be played inside another website: when its embedded player was opened and clicked on 14 September 2026, the player itself again reported “Playback on other websites has been disabled by the video owner.” and settled on a “Watch on YouTube” prompt, with no duration and no playback progress reported. That message is the reason no player is reserved or left blank here; the recording itself is available directly on YouTube.
Watch Focus On Index Futures September 24, 2025 on YouTube ↗
ICT Index Futures Sources and Further Reading
- The original Inner Circle Trader recording: the source for every timestamp link in this article.
- CME Group: Micro E-mini S&P 500 contract specifications: an exchange reference for how index futures contracts are defined, not a source for anything in the recording.
- YouTube Help: Restrict embedding: platform documentation listing the owner rule that disallows embedding on any website, which is why the watch card above replaces a player.
BestProps is not affiliated with The Inner Circle Trader, YouTube or CME Group, and no source listed here endorses this article, this site or any setup. Premium wick, discount wick, consequent encroachment, quadrant, buy-side and sell-side liquidity, fair value gap, SIBI, breaker, order block, measuring gap and PD array are used on this page only as descriptive study terms, in the sense the speaker uses them in the recording. No entry, stop, target, size or result is presented here as verified fact, and the levels quoted are read from an automatic transcript and may be misrecognised. This is independent educational commentary, not investment advice.


