
Key takeaways
On September 22, 2025, ICT walks through the December Nasdaq E-mini (NQ) contract from a daily and five-minute view down to a one-minute opening-range study.
Read the full summary
On September 22, 2025, ICT walks through the December Nasdaq E-mini (NQ) contract from a daily and five-minute view down to a one-minute opening-range study. He says NQ opened below Friday’s close, traded into the consequent encroachment of a wick he had marked, rejected that decline and then advanced above 25,000 into new highs. His directional teaching is not to try to pick a top in a market that keeps making all-time highs, but to keep taking buy signals until they stop working. He also flags a practical charting habit: remember which timeframe each reference was marked on. The levels, labels and readings are his own account; the transcript does not verify chart markings, fills or later results, and the recording itself is a shorter, NQ-only session.
How we researched this article
BestProps used document-based research from primary firm sources, checked September 24, 2026. The complete source list, scope, limitations, and commercial-state record appear near the end of this article.
In “Focus On Index Futures September 22, 2025”, ICT reviews the December Nasdaq E-mini futures contract (NQ). He compares daily, five-minute and one-minute perspectives while discussing the session through his concepts of liquidity, fair value gaps, order blocks, opening-range quadrants and market structure.
The lesson is primarily a retrospective chart walkthrough, not a live trade record. The transcript does not establish entries, fills, exits or the market’s subsequent outcome, and the chart itself was not available for independent visual verification. The source used here is a timestamped automatic transcript of the recording’s full original audio, produced locally rather than from the channel’s captions, so specialised terms and spoken numbers carry transcription risk.
Session context and bullish premise
ICT opens by identifying the date as September 22, 2025 and saying the discussion will focus on the December NQ contract (0:06). He also explains at the outset that this will be a shorter session than usual, following a personal loss that week, and says he intends to bring the S&P E-mini (ES) into the coverage when he has more capacity.
Beginning with daily and five-minute charts, he connects the session to a volume imbalance discussed in an earlier recording. According to his narration, NQ opened below Friday’s close, traded lower, rejected that decline, and then advanced above the 25,000 level into what he describes as all-time highs (0:56).
His central directional lesson is that traders should be cautious about trying to select a top while a market is repeatedly reaching new highs. ICT says he would instead continue looking for buy signals until that behaviour stopped working (1:39). This is ICT’s market interpretation and preferred framework, not evidence that such signals provide a reliable or profitable edge.
London and New York session framework
ICT next describes price action during what he calls the London Kill Zone, defined in this presentation as 1:00 to 5:00 a.m. He identifies a fair value gap and says price moved into the lower portion of a wick-based area before rallying. In his terminology, the area acted as a discount array. He then points to a bullish market-structure shift and another fair value gap (2:10).
For the New York morning, he broadly groups 7:00 to 11:00 a.m. together while acknowledging that it can be divided into the premarket and the 9:30 to 11:00 regular-hours segment. He interprets a retracement into a bullish fair value gap, an open gap that functions as a measuring reference, and respect for a bullish order block as components of the subsequent rise (2:49).
Opening range, liquidity and lower-timeframe sequencing
Switching to a one-minute view, ICT distinguishes regular trading hours from electronic trading hours. He marks relative equal lows from Friday as a sell-side liquidity area and defines the opening range as the first 30 minutes after the 9:30 a.m. Eastern open (3:50).
His account of the intraday sequence includes:
- An opening below the prior regular-session close and movement among opening-range quadrant levels.
- A return to the area he labels as sell-side liquidity near relative equal lows.
- A breakaway gap and movement above short-term highs.
- A minor decline into a bullish fair value gap, followed by another lower-timeframe market-structure shift.
- A later move through Friday’s high, which he classifies as a buy-side liquidity pool.
ICT states that an opening-gap condition carries a 70% likelihood of reaching a referenced quadrant (4:12), but the recording provides no study, sample definition or test data with which to evaluate that percentage. It should be treated as a claim made during the lesson rather than a verified statistic.
Keeping higher-timeframe annotations clear
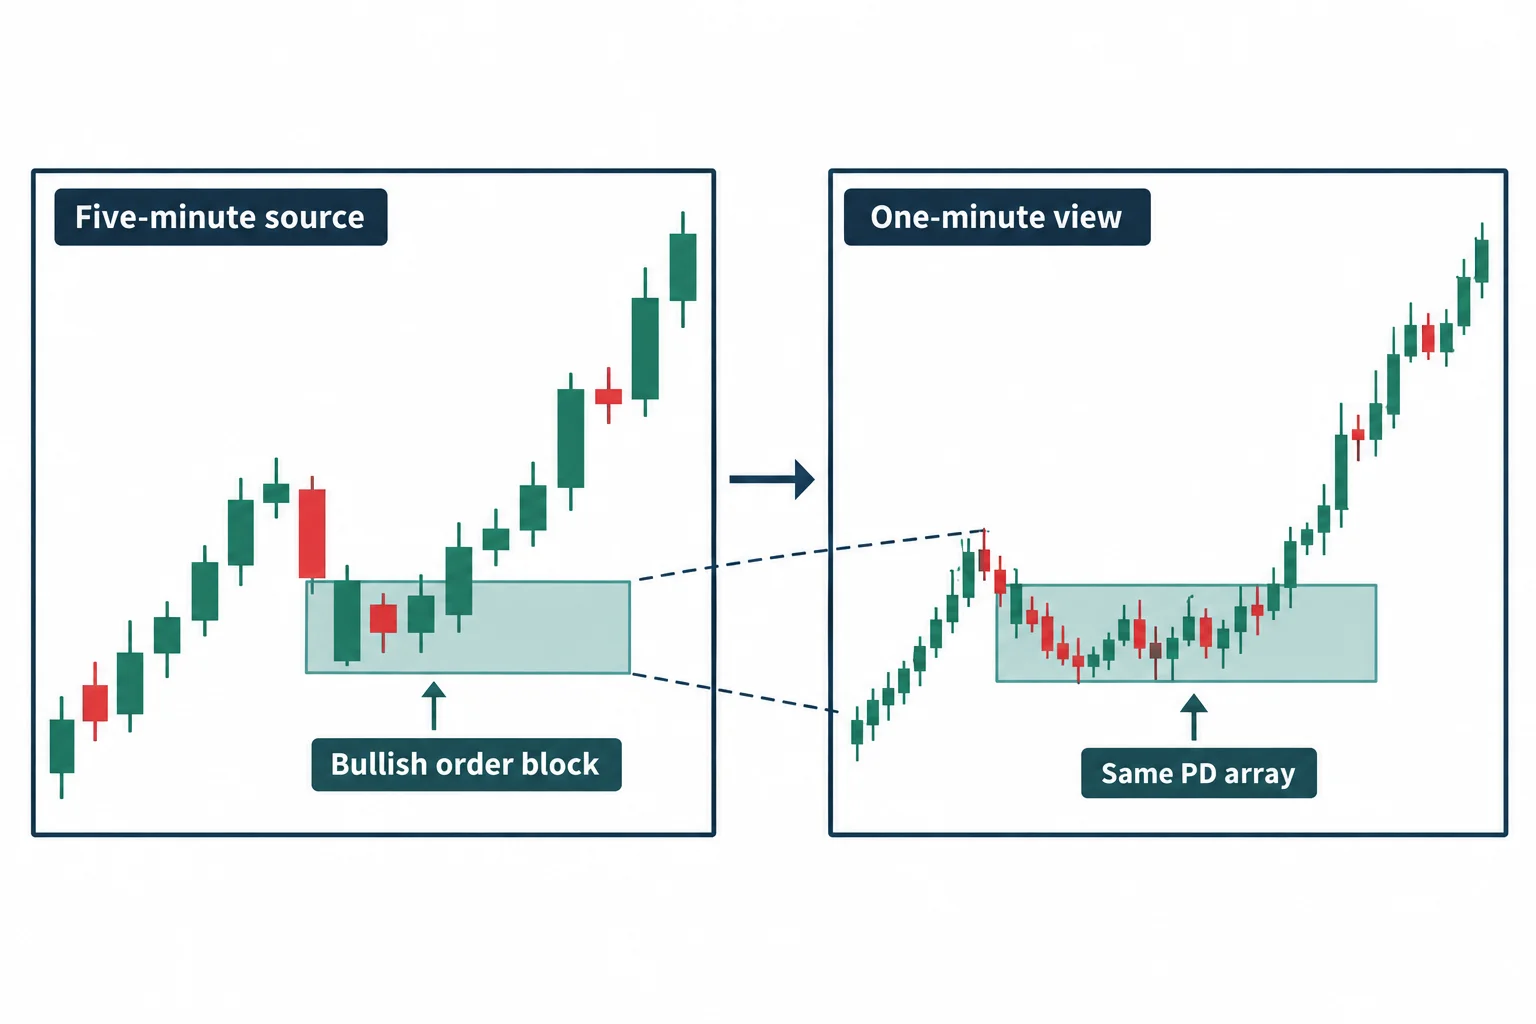
A practical charting point appears when ICT revisits the area around Friday’s high. He explains that a five-minute bullish order block looks different when viewed on a one-minute chart. His advice is to track the timeframe on which each “PD array” was originally marked, so that lower-timeframe detail does not obscure the higher-timeframe reference (5:46).
This is the most broadly applicable educational idea in the presentation: an annotation should retain its timeframe context. A zone derived from a five-minute candle should not silently become a one-minute setup merely because the chart interval changes.
Noon behaviour and the possibility of an intermediate high
Near the end, ICT says the advance did not retrace into the lunchtime areas he was monitoring. He interprets the persistent upward movement as a possible characteristic of an intermediate-term high beginning to form, while expressly saying that he did not believe the high was in place yet (6:19).
That distinction matters: he does not present a confirmed top and does not document a later reversal. The transcript ends without showing what happened after the chart snapshot. The session is best understood as ICT’s explanation of how he organised a strongly advancing NQ day using his own vocabulary, alongside his warning against prematurely fading an all-time-high market.
Recording the contract and session details
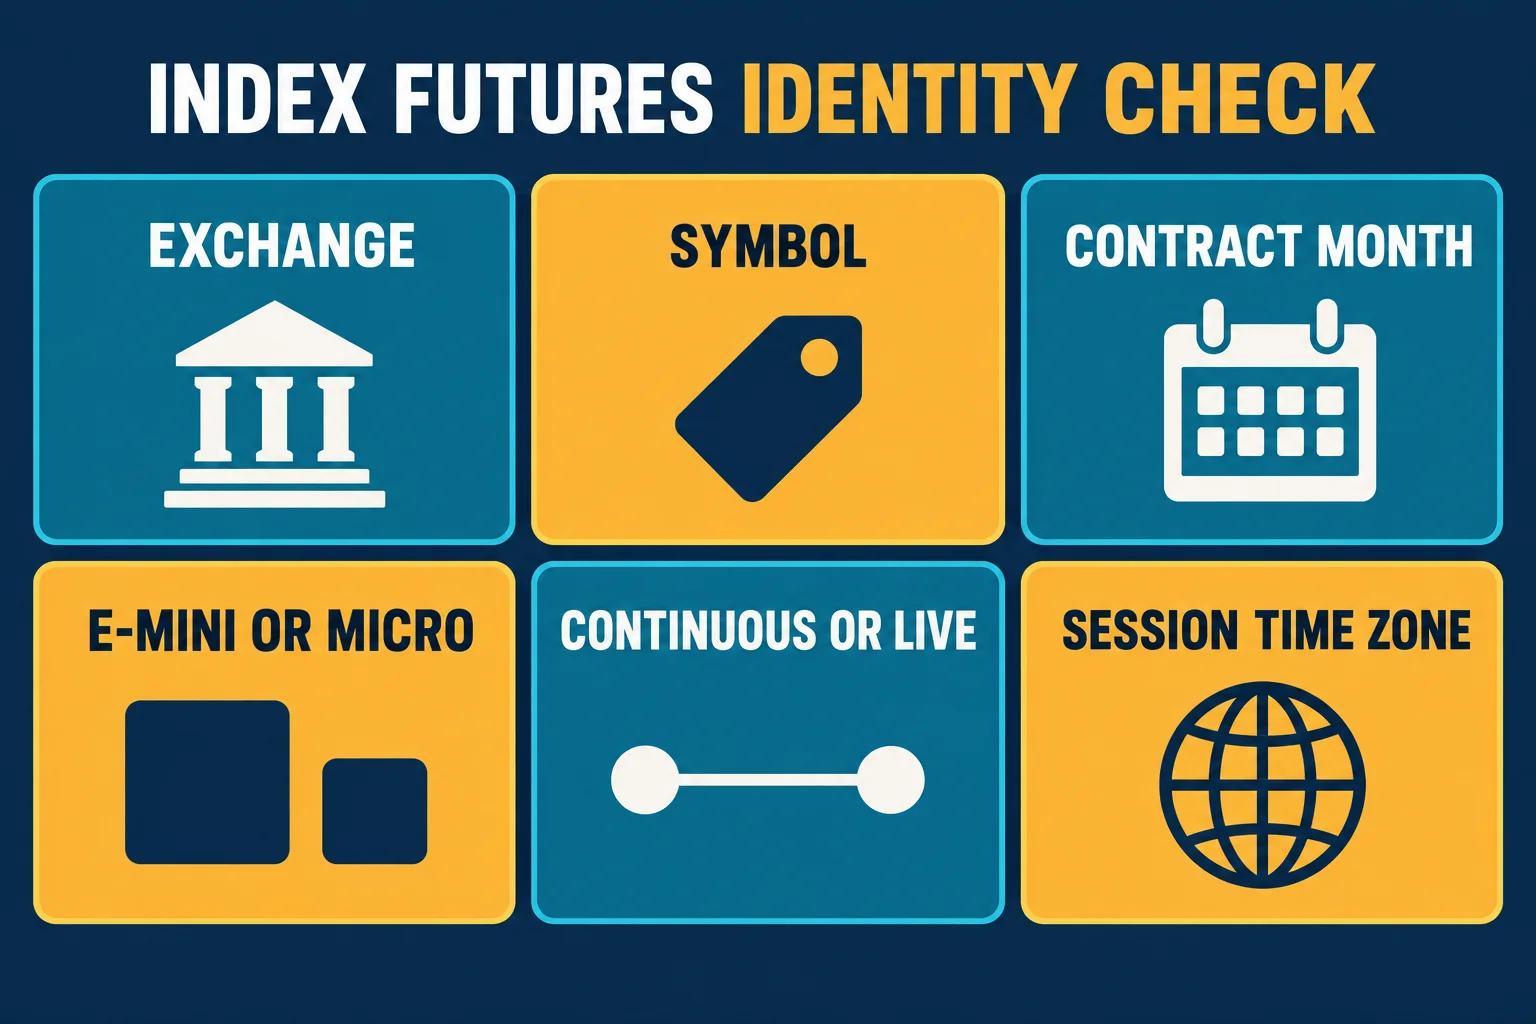
The recording itself is specific about what is being charted, and that specificity is worth copying when a session is studied or quoted. He names the December NQ E-mini contract, separates regular trading hours from electronic trading hours, and anchors the discussion to a 9:30 a.m. Eastern open. Stating the exchange, symbol, contract month, contract size family, whether the series is continuous or a single contract, and the session time zone keeps a chart reference unambiguous when it is revisited.
Watch the original lesson
This article draws on the timestamped transcript of “Focus On Index Futures September 22, 2025”. A transcript is evidence of what the speaker said, not independent proof of the levels he described or of any trading outcome. The recording’s own chart annotations remain the primary reference when following the explanation.
Watch the original lesson on YouTube
The video cannot be played inside another website: when its embedded player was opened and clicked on 14 September 2026, the player itself again reported “Playback on other websites has been disabled by the video owner.” and settled on a “Watch on YouTube” prompt, with no duration and no playback progress reported. That message is the reason no player is reserved or left blank here; the recording itself is available directly on YouTube.
Watch Focus On Index Futures September 22, 2025 on YouTube ↗
Primary source and further reading
- The original Inner Circle Trader recording: the source for every timestamp link in this article.
- CME Group: E-mini Nasdaq-100 contract specifications: an exchange reference for the contract the recording discusses, not a source for anything he says about it.
- YouTube Help: Restrict embedding: platform documentation listing the owner rule that disallows embedding on any website, which is why the watch card above replaces a player.
BestProps is not affiliated with The Inner Circle Trader, YouTube or CME Group, and no source listed here endorses this article, this site or any setup. Volume imbalance, consequent encroachment, discount array, premium wick, fair value gap, measuring gap, breakaway gap, order block, buy-side and sell-side liquidity, PD array, opening range and kill zone are used on this page only as descriptive study terms, in the sense the speaker uses them in the recording. No entry, stop, target, size or result is presented here as verified fact, and the levels quoted are read from an automatic transcript and may be misrecognised. This is independent educational commentary, not investment advice.



