
Key takeaways
The Inner Circle Trader lecture on YouTube reviews ICT’s February 19, 2025 NASDAQ commentary, combining selected daily wick midpoints, the prior three days’ OHLC data, and a one-minute first presented fair value gap to separate a directional target from an entry mechanism.
Read the full summary
The Inner Circle Trader lecture on YouTube reviews ICT’s February 19, 2025 NASDAQ commentary, combining selected daily wick midpoints, the prior three days’ OHLC data, and a one-minute first presented fair value gap to separate a directional target from an entry mechanism. ICT identifies 22,131.25 as a daily gray pool reference near the 22,124 candle level, adopts a bearish bias while price is above the objective, and uses an inversion fair value gap as confirmation after price crosses sell-side and buy-side liquidity. He says the setup returned to the gap, declined toward 22,131.25, rallied, revisited the gap, and later exceeded an earlier intraday high. His stated process is to establish higher-time-frame bias first, wait for lower-time-frame confirmation, and do nothing if price opposes that bias. ICT reports two trades, zero losses, and just under $11,000, but the automatic transcript does not provide charts, orders, fills, account records, Telegram archives, market data, or independent verification, and the gray pool framework is not disclosed as a complete testable rule set.
How we researched this article
BestProps used document-based research from primary firm sources, checked September 24, 2026. The complete source list, scope, limitations, and commercial-state record appear near the end of this article.
ICT 2025 Lecture Series Telegram Commentary Review 02/19/2025 is a source-grounded recap of the original February 19 recording.
ICT 2025 Lecture Key Takeaways
ICT combines daily wick references with a one-minute first presented fair value gap, separates his directional objective from an entry mechanism, and says he stands aside when price opposes his bias. The lesson documents his explanation, not independently verified trading performance.[1]
In “2025 Lecture Series – Telegram Commentary Review 02/19/2025”, uploaded February 19, 2025, ICT reviews his intraday NASDAQ commentary and explains how he combined daily candlestick wicks, what he calls a “gray pool,” and a first presented fair value gap. His central lesson is not simply that price reached a nominated level. It is that higher-time-frame references supplied a directional objective, while a lower-time-frame pattern was used as confirmation.[1]
This review is based on an automatically transcribed audio track and cannot independently verify the chart, Telegram posts, orders, fills, or reported result shown in the recording. The terminology and market interpretations below are ICT’s.[1]
ICT 2025 Lecture Daily Chart Reference
ICT begins on the NASDAQ daily chart and identifies two candle wicks. At 0:45, he describes measuring one wick from the candle’s close to its high and another from the close to the low. At 1:31 and 1:53 he refers to a midpoint and consequent encroachment. An earlier percentage is inconsistent in the automatic transcript, so this summary does not reproduce that numerical instruction as a validated measurement rule.[1]
He gives 22,131.25 as his resulting reference at 3:16 and labels the surrounding area a “gray pool.” That price is reported as spoken, not independently calculated or checked against the chart. The arithmetic is difficult to reconstruct from audio alone because one of the spoken numbers near 2:30 is unclear in the automated transcript. The visible chart coordinates are also unavailable here, so readers should consult the source video rather than relying on the transcription for replication.[1]
At 3:31, ICT says he blends this calculated reference with the high, low, open, and close of the preceding three days. He compares it with nearby daily candle structure, including a candle high he gives as 22,124. According to his explanation, this produces a narrow zone where he is looking for a potential turning point, not an automatically actionable line.[1]
ICT Gray Pool Explained
In this lecture, “gray pool” refers to the area between selected wick midpoint references. ICT presents it as his own framework and says more conditions governing its use remain to be disclosed. That limitation matters: this video demonstrates one application but does not provide a complete, independently testable rule set.[1]
ICT also makes confirmation a requirement. At 5:06, he says a trader already short might treat the zone as an area to exit, while a potential long would still require a “PD array” after price enters it. In ICT vocabulary, that phrase generally denotes a price-delivery reference; the recording does not fully define the term.[1]
ICT 2025 Lecture One-Minute Chart Setup
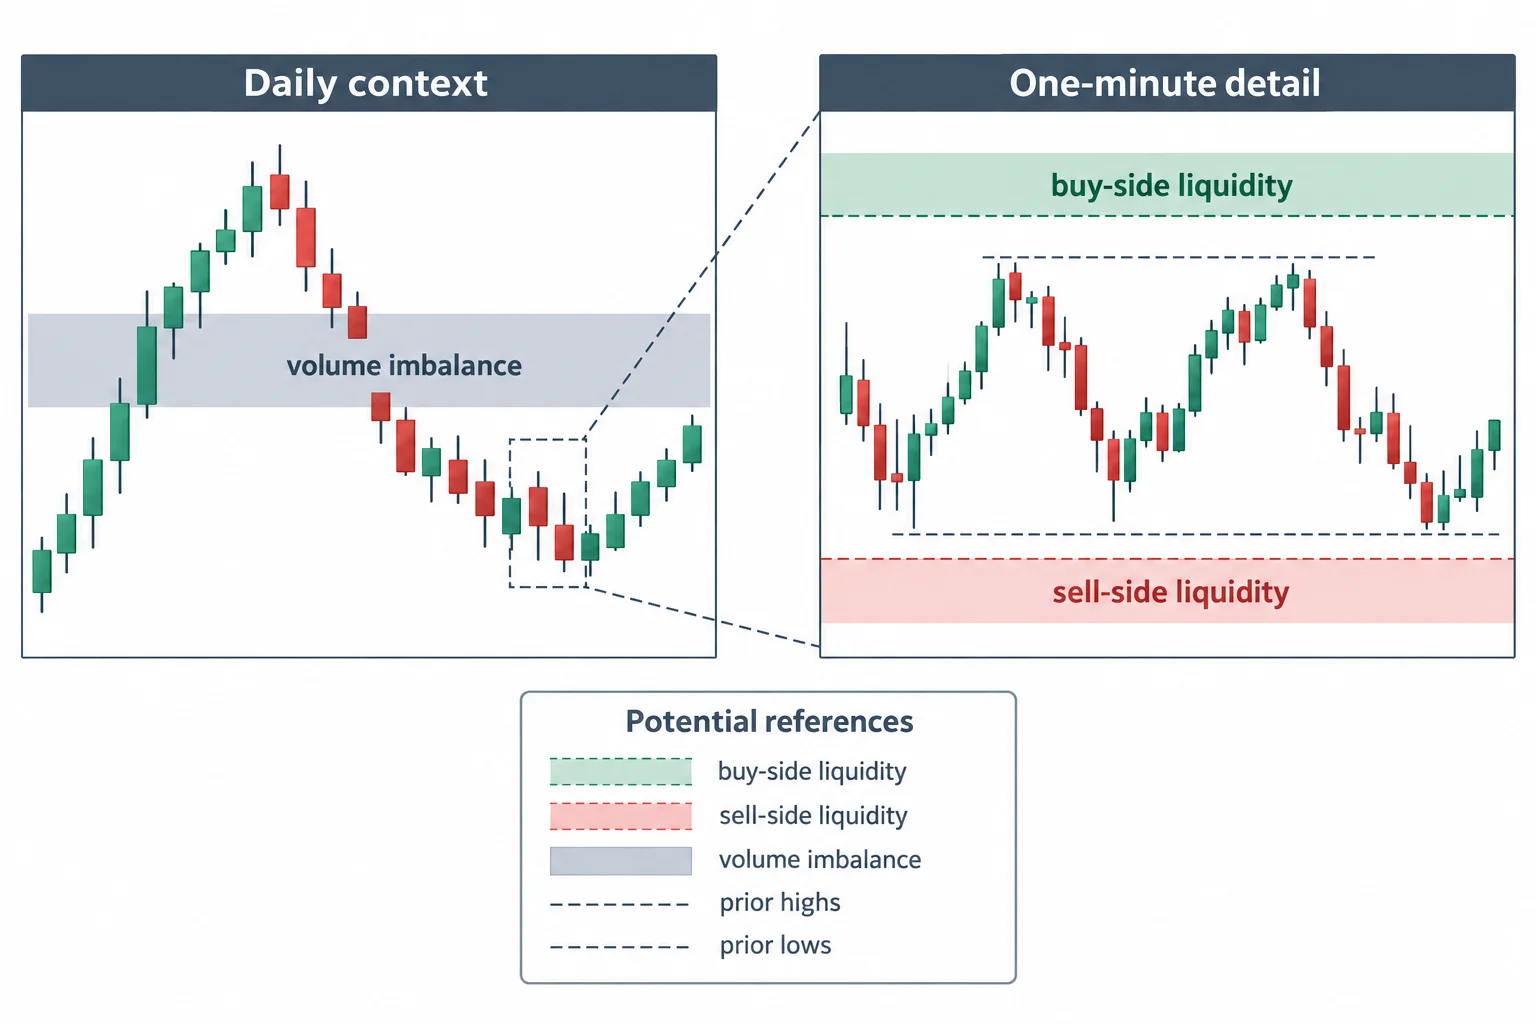
The review shifts to a one-minute chart around 5:26. ICT points out an old high and a daily-chart volume imbalance. He also discusses a small opening-range gap between the previous regular-hours settlement and the new regular-hours opening price.[1]
As ICT narrates the sequence, the gap was partially filled before price moved lower. Price then traded through sell-side liquidity and later buy-side liquidity. These labels express ICT’s reading of prior lows and highs as liquidity references; the transcript alone cannot establish order flow or the cause of the subsequent movement.[1]
ICT Fair Value Gap Explained
ICT says that before the decline, his directional objective was 22,131.25. Because price was above that objective, his bias was bearish rather than bullish. At 8:17, he identifies the first presented fair value gap and says he wanted it to behave as an inversion fair value gap. In his recap, price returned to that area, moved lower, retested it, and then continued toward the daily objective.[1]
The phrase “first presented fair value gap” is important because later portions of the automated transcript inconsistently render it as “first percent” or “first percentage.” Context strongly favors “first presented,” but viewers should confirm the label against the audio and chart.[1]
Near 9:31, ICT places additional emphasis on 22,124. He says a candle body respected that reference even though the wick extended through it. He then describes price returning to 22,131.25 and rallying. Later, according to his narration, price revisited the first presented fair value gap and eventually moved through an earlier intraday high.[1]
ICT 2025 Lecture Trading Lessons
ICT summarizes his intended process at 11:39: establish directional bias first, then use the first presented fair value gap as a possible mechanism for entering with that bias. In rarer circumstances, he says the gap may instead serve as the draw associated with a reversal.[1]
- Start with higher-time-frame context: Selected daily wicks and recent daily OHLC data define the area of interest.
- Form a directional expectation: A level below current price supported ICT’s bearish intraday interpretation in this example.
- Wait for lower-time-frame confirmation: He used the first presented fair value gap as the principal intraday reference.
- Stand aside when the premise fails: At 12:06, ICT says that if price moves contrary to his stated bias, he does nothing rather than forcing a trade.
As a general educational interpretation, the useful distinction is between a target and a trigger. The daily “gray pool” acted as ICT’s proposed destination, whereas the one-minute fair value gap supplied his proposed execution framework. That separation can make a chart narrative more structured, but this single retrospective review does not demonstrate reliability, profitability, or a general market edge.[1]
ICT 2025 Lecture Claims to Treat Carefully
At 10:57, ICT reports two trades, no losing trades, and a result just under $11,000. He also says his Telegram recordings document the live sequence. Those are speaker-reported claims; the transcript does not expose account records, complete fills, the Telegram archive, or independent verification. Likewise, his statements about precision, originality, audience size, and calling the move in advance should be treated as his own characterization.[1]
The most defensible use of this lecture is therefore as a study of ICT’s chart-reading logic: identify a daily destination, compare it with nearby candle references, establish a bias, and wait for a specified intraday formation. It is educational commentary, not investment advice or evidence that the same setup will produce comparable outcomes.[1]
ICT 2025 Commentary and Supporting Evidence
Telegram’s own FAQ is the original platform guide for basic questions about using the service; it is not a verification of ICT’s channel, post chronology or reported trades.[2] For independent risk context, the CFTC warns that there is no risk-free trade or investment.[3]
Watch the ICT 2025 Lecture
The Inner Circle Trader (Telegram Commentary Review, 02/19/2025)
Watch the original recording on YouTube
The tested player reported that the owner disabled playback on other websites, so this page uses a visible watch link.



