
Key takeaways
ICT’s March 22, 2025 lecture reviews the week ending March 21 and uses Nasdaq futures to explain his 30-minute opening ranges, hourly macros and journaling process. The usable study task is to record what happens inside predefined windows, not assume that the speaker’s algorithmic interpretation proves a profitable edge.[1]
How we researched this article
BestProps used document-based research from primary firm sources, checked September 24, 2026. The complete source list, scope, limitations, and commercial-state record appear near the end of this article.
Source note: This independent companion was checked against a timestamped automatic transcription of the full original audio, not human-verified YouTube captions. Specialized terms were normalized only where context supported them. The review does not independently verify the chart visuals, trade fills or performance. Timestamp links are navigation aids, not official chapter markers.
In “2025 Lecture Series – Algorithmic Timing & Journaling \ 03/22/2025”, ICT reviews Nasdaq futures price action for the week ending March 21, 2025 and explains how he organizes intraday observations around recurring time windows. The session moves from a weekly market review into a detailed discussion of opening ranges, “macros,” fair value gaps and journaling.[1]
The central argument is ICT’s interpretation that price delivery exhibits repeatable, time-based signatures. That is the speaker’s market theory, not an independently established fact or a demonstrated trading edge. The most broadly applicable educational lesson is methodological: define observations in advance, record them consistently and compare them over a meaningful sample instead of relying on memory or a single chart.[1]
Weekly context and conditional analysis
ICT begins by identifying the presentation as a weekly summary for the week ending March 21, 2025, focused exclusively on Nasdaq futures. He compares a continuous NQ chart with the June 2025 delivery contract, although the transcript cannot verify what was visible on either chart.[1]
A useful qualification appears early in the analysis: ICT says he does not know where the Sunday session will open and therefore treats his weekend outlook as conditional rather than certain. At 3:50, he explains that the opening price can change the projections he would make for the coming week. He also explicitly acknowledges that his forecast may be wrong.[1]
Within the reviewed chart, ICT describes a daily “volume imbalance” as an area between two candles whose wicks touch while their bodies do not. He interprets that separation as a possible area for price to revisit before another decline. He then discusses internal highs and lows within a wider March range, arguing that traders need not require price to reach the absolute boundaries of a large range before studying a setup.[1]
The March 21 intraday case study
The detailed example concerns the June 2025 Nasdaq contract on Friday, March 21. ICT says price moved slightly beneath the low of a “balanced price range” formed during March 18–19 and then reversed higher. This is his reported reading of the chart, not an independently verified price sequence or evidence of an executed trade.[1]
ICT uses this sequence to illustrate several concepts from his framework:[1]
- A move through a previously identified liquidity objective.
- Displacement and a subsequent change in short-term market structure.
- A “breakaway gap” early in a projected move and a “measuring gap” near its midpoint.
- Fair value gaps that may later be treated as inversions or reclaimed areas after price changes direction.
At 35:21, he demonstrates his measuring-gap idea by describing a Fibonacci measurement from a swing high and aligning its 50% level with the midpoint—or “consequent encroachment”—of an imbalance. This is an explanation of ICT’s own chart-reading procedure. The transcript does not provide an independently reproducible test of its predictive value.[1]
ICT’s 30-minute opening ranges
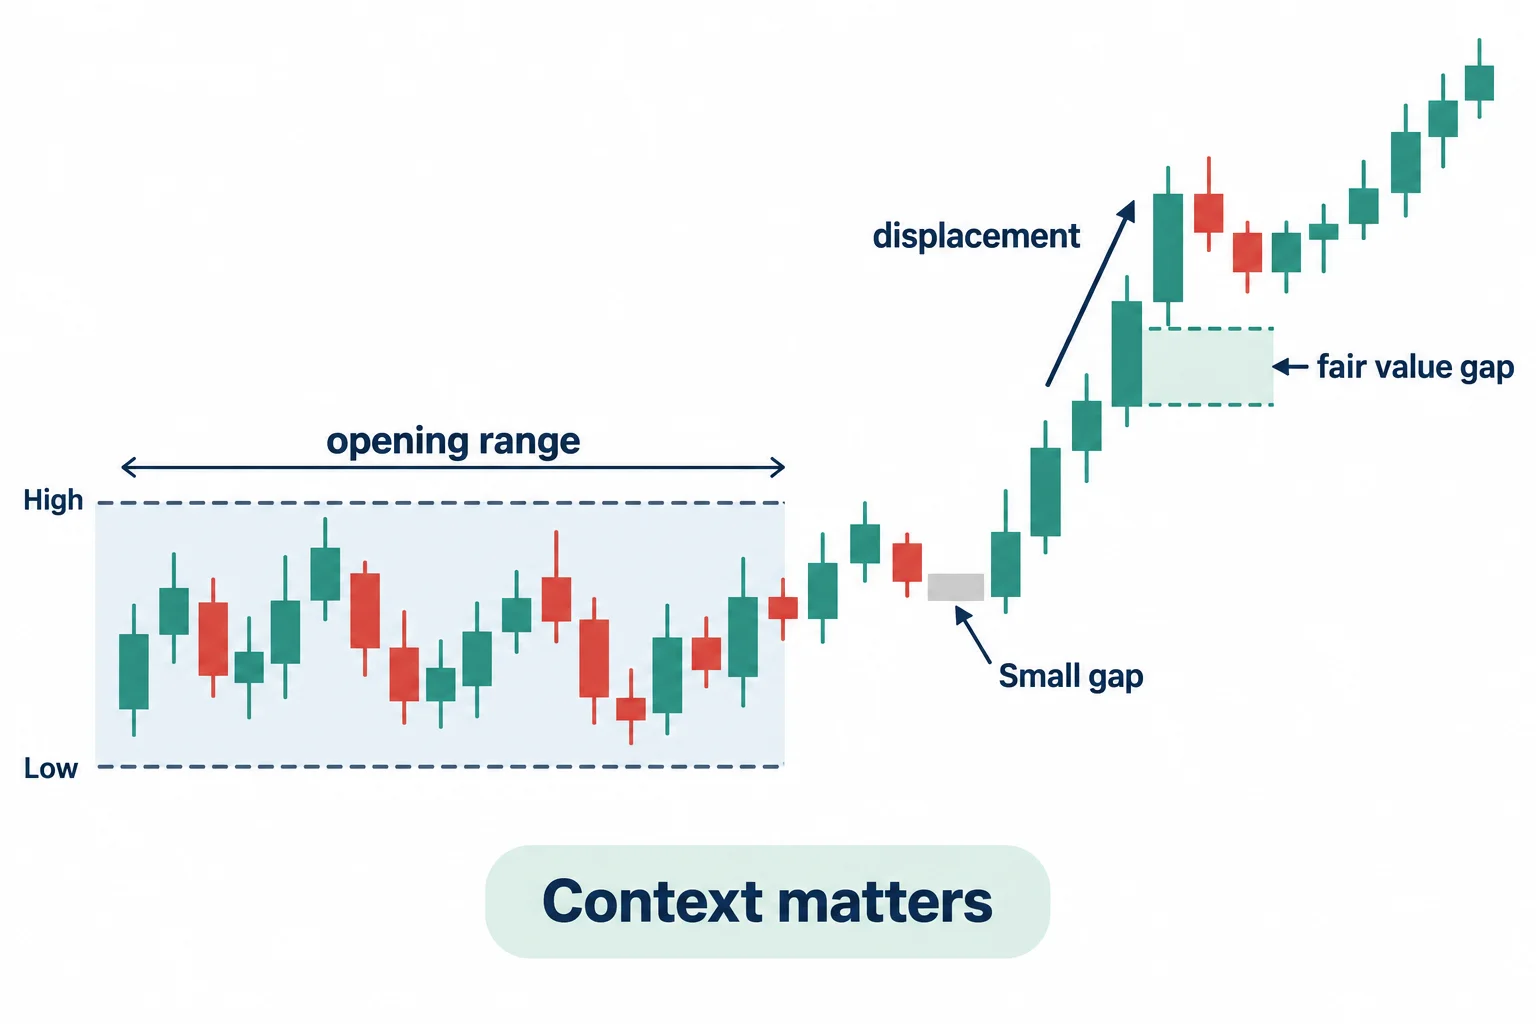
The lecture’s main timing lesson starts around 41:56. ICT defines the morning opening range as 9:30–10:00 a.m. Eastern Time. He instructs students to mark its high and low and then identify the first relevant price-delivery array inside it, emphasizing the first meaningful fair value gap.[1]
He adds an important discretionary filter. In the example, the first gap was very small and did not produce the structural behavior he considered significant. He therefore preferred a later, larger gap whose displacement aligned with his bullish interpretation after the downside objective had been reached. This means the method described is not simply “always trade the first gap”; context, direction and the perceived significance of displacement remain part of the selection process.[1]
ICT then applies Fibonacci quadrants and range projections, which he calls “standard deviations,” to the opening range. These are his charting labels; the transcript does not establish a statistical standard-deviation calculation. During what he calls the New York lunch window—11:30 a.m.–1:30 p.m. Eastern—he describes price returning to the upper quadrant of the morning range before moving higher. Later, he defines a second opening range from 1:30–2:00 p.m. Eastern for the afternoon session.[1]
Time windows named in the lecture
All times below are Eastern Time as stated by the speaker, not fixed UTC offsets. The 1:15:01–1:15:45 recap covers hourly macros and both opening ranges; the 1:07:27–1:08:09 passage connects the 3:15–3:45 window with his market-on-close idea. These are observation windows in this lecture, not a claim that every exchange or contract trades identical hours.[1]
- New York Killzone (29:00–29:29): 7:00–9:00 a.m. Eastern under what ICT calls the original or “purist” definition.
- Morning opening range: 9:30–10:00 a.m.
- Hourly macro: the last ten minutes before an hour through the first ten minutes after it.
- New York lunch: 11:30 a.m.–1:30 p.m.
- Afternoon opening range: 1:30–2:00 p.m.
- Additional cited windows: 2:50–3:10 p.m. and 3:15–3:45 p.m. (1:03:40–1:04:10).
- Market-on-close reference: ICT highlights a possible price run around 3:50 p.m.
These windows are presented as elements of ICT’s framework. His stronger assertions—that an overarching algorithm controls price delivery or that particular formations occur every day—are not established by the single session reviewed here.[1]
How ICT recommends journaling
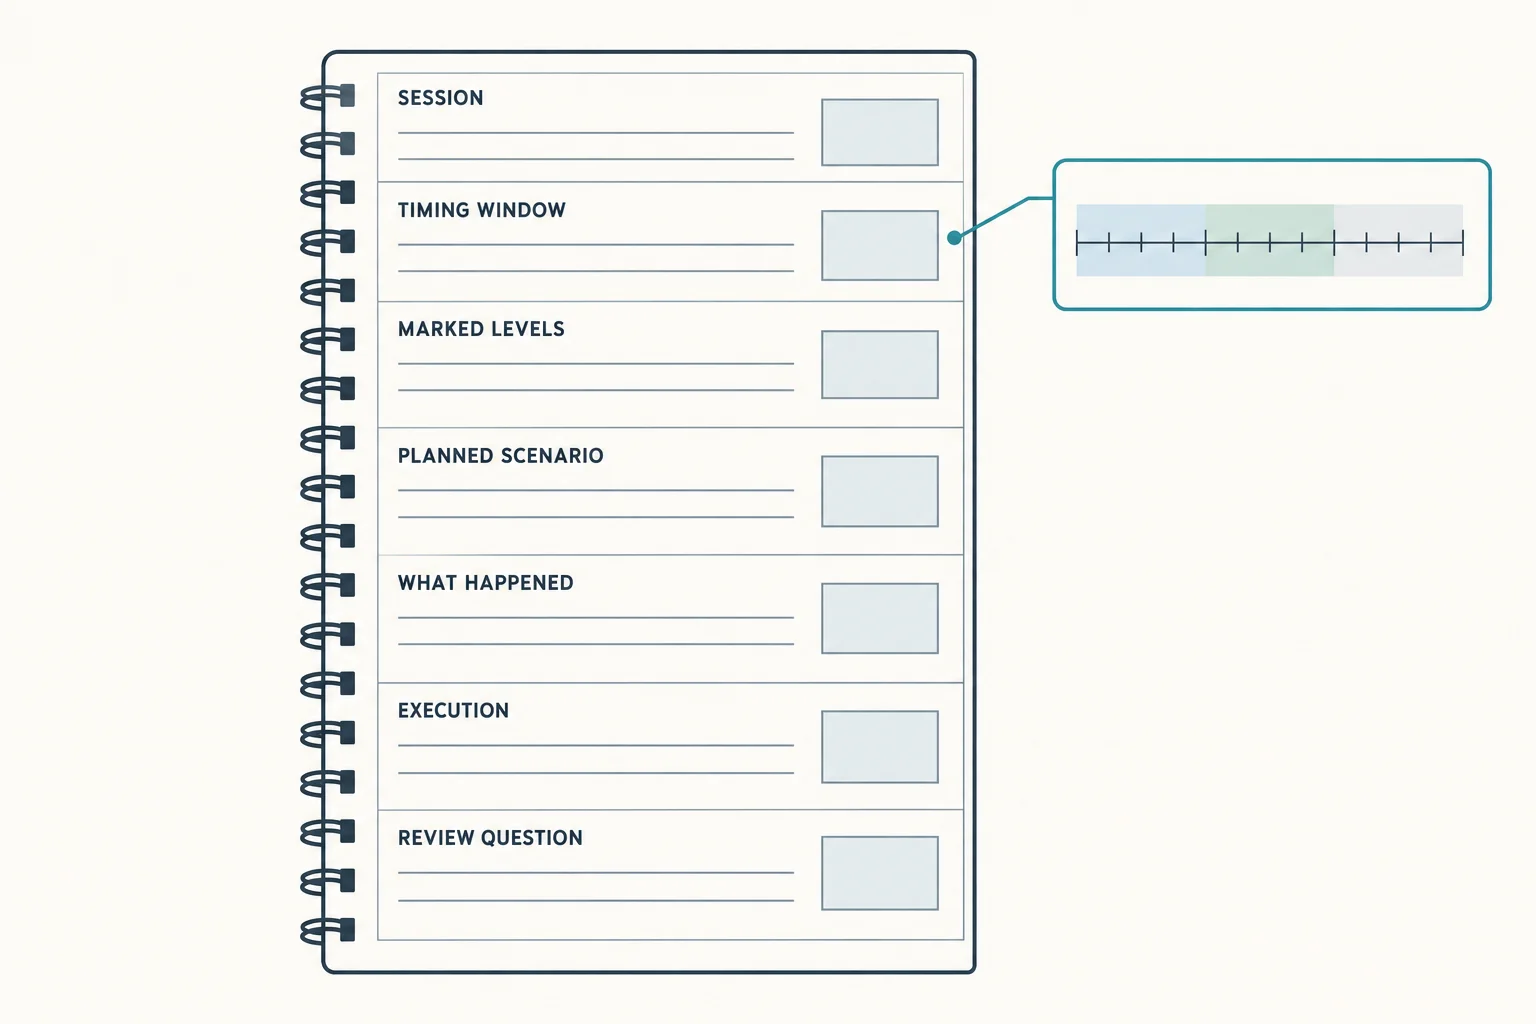
The practical journaling section begins at 1:09:06. ICT argues that a journal should do more than list wins and losses. It should preserve the conditions surrounding each observation so a student can evaluate progress daily and weekly, revisit examples handled well and separate one poor decision from a broader conclusion about a method.[1]
His suggested study process is to annotate one- and five-minute charts with the recurring timing windows, morning and afternoon opening ranges, relevant price-delivery arrays and opening-range standard deviations. At 1:15:15, he specifically recommends recording the hourly 20-minute macro windows. He also proposes tracking:[1]
- Which setup or price structure formed during each window.
- The objective toward which price appeared to move.
- Any adverse movement or drawdown associated with the observed setup.
- How long the idea took to develop.
- When the move completed or ceased behaving as expected.
As an editorial research suggestion, rather than a quoted instruction from ICT, this can be made more rigorous by defining each label before collecting examples, retaining failed and ambiguous cases, and avoiding hindsight-based relabeling. Screenshots should include the instrument, contract, date, timezone and timeframe. Paper observation is more appropriate than assuming that a chart pattern has demonstrated profitability.
Bottom line
This lecture combines a March 21 Nasdaq case study with ICT’s broader theory of time-based price delivery. Its clearest takeaway is a structured research routine: mark fixed windows, document what formed, include failures and compare observations over time. ICT himself closes with a necessary limitation at 1:18:11: improved familiarity with candlesticks is not the same as profitable or consistently profitable trading.[1]
Watch the original lecture
2025 Lecture Series — Algorithmic Timing & Journaling, March 22, 2025
The Inner Circle Trader · approximately 1 hour 22 minutes.
Watch the full lecture on YouTube ↗
This watch card opens the original recording directly. The saved embedded-player test reported that playback on other websites was disabled by the video owner.
Session and time-reference resources
Nasdaq’s official stock-market schedule lists the regular stock session as 9:30 a.m.–4:00 p.m. Eastern.[2] NYSE’s schedule lists a 3:50–4:00 p.m. closing imbalance period for its Tape A market.[3] These exchange references help distinguish published stock-market session mechanics from ICT’s personal timing framework; neither verifies his NQ futures case study or a predictable price response. Use the relevant futures contract’s own specifications for futures trading hours.
IANA provides the Time Zone Database and its release history.[4] As a practical journaling convention, record the chart’s time-zone setting and date so that clock changes do not silently alter comparisons.
Sources
- [1] https://www.youtube.com/watch?v=l4phBVDs2d4
- [2] https://www.nasdaq.com/market-activity/stock-market-holiday-schedule
- [3] https://www.nyse.com/markets/hours-calendars
- [4] https://www.iana.org/time-zones
Educational commentary only, not investment advice. A chart-reading framework is not verified profitability. No paid tool, indicator or strategy performance was tested for this article.


