
Key takeaways
ICT’s 2022 Mentorship Episode 8 applies an institutional-order-flow framework to EUR/JPY using TradingView, starting with daily relative equal lows, a sell-side-liquidity run, swing-high take-outs and fair value gaps before examining the February 10 session on 15-minute, five-minute and three-minute charts.
Read the full summary
ICT’s 2022 Mentorship Episode 8 applies an institutional-order-flow framework to EUR/JPY using TradingView, starting with daily relative equal lows, a sell-side-liquidity run, swing-high take-outs and fair value gaps before examining the February 10 session on 15-minute, five-minute and three-minute charts. The Forex kill zones are 2 a.m. to 5 a.m. for London and 7 a.m. to 10 a.m. for New York, always in New York local time. The lower-timeframe setup requires price to trade below a prior swing low, rally above a prior swing high, form one or more fair value gaps in the upward leg and retrace into a selected gap, though price may pass through the first gap. For expansion targets, ICT anchors a Fibonacci tool to a prior leg and uses the standard-deviation -1 projection, read around 133.153. He also compares euro futures 6E with yen weakness to support the bullish EUR/JPY thesis while stressing that he dislikes trading yen pairs. The walkthrough does not document fills, stops, costs, risk parameters or verified performance, so it demonstrates methodology rather than a validated trading result.
How we researched this article
BestProps used document-based research from primary firm sources, checked September 25, 2026. The complete source list, scope, limitations, and commercial-state record appear near the end of this article.
2022 ICT Mentorship Episode 8 Overview
The recording is the eighth instalment of ICT’s 2022 mentorship and is positioned as an answer to viewer requests to apply his institutional-order-flow concepts to Forex. It opens by noting the data feed ICT is using on TradingView (0:37) and quickly moves to a daily chart of Euro-Yen (EUR/JPY). ICT reiterates early in the lesson that he personally dislikes trading yen pairs (0:58); the episode is therefore presented as a demonstration of methodology rather than a recommendation to trade EUR/JPY.
Because the recording is a single continuous walkthrough rather than a study of historical outcomes, the transcript cannot, on its own, establish trade fills, transaction costs, stop placement, risk parameters, or longer-term performance. The aim of this article is to summarise and contextualise ICT’s own description of the chart, not to validate his framework statistically.
ICT Forex Model on Higher Timeframes
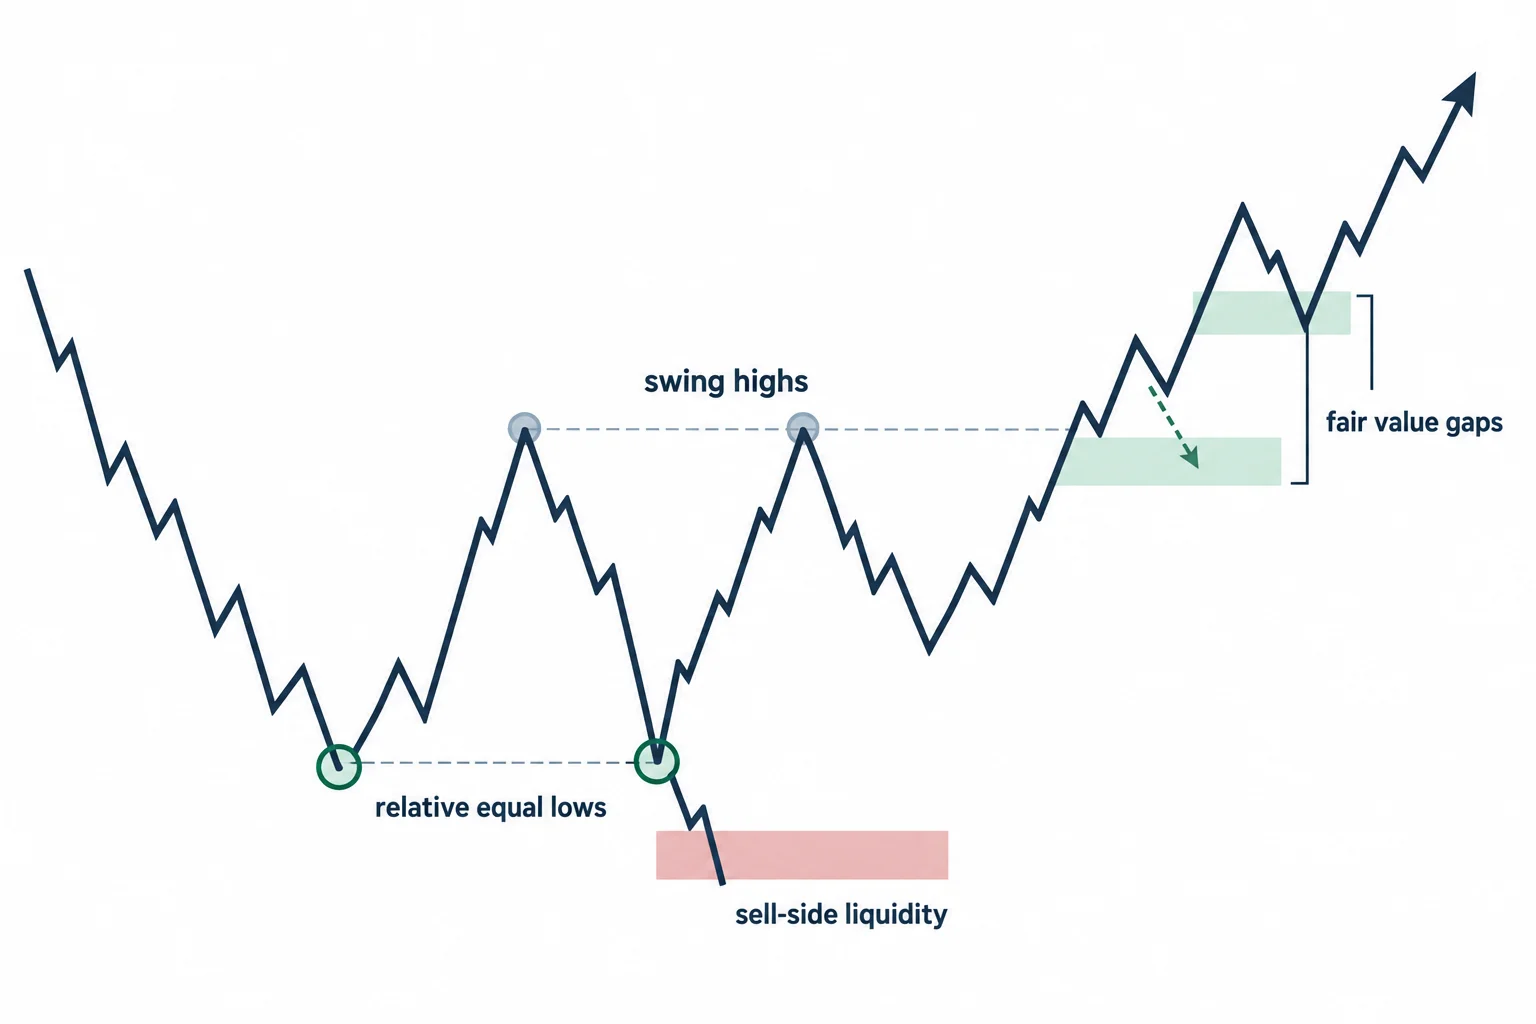
ICT opens a daily EUR/JPY chart and addresses whether the same framework taught on shorter charts can be used on higher timeframes. At 1:45, he identifies what he calls relative equal lows. In his terminology, price subsequently trading beneath those lows represents a run on sell-side liquidity.
He then points to two earlier swing highs that price moved above. Within the upward price leg that follows, he identifies fair value gaps and describes a retracement into one of them before another move higher (2:25). Under ICT’s framework, the combination is read as a possible bullish change in market structure followed by a return to an imbalance.
At 3:01, ICT discusses buy-side liquidity above the market, including an old high that could act as a draw. His horseshoe analogy makes the distinction clear: the old high supplies a directional objective, but does not have to be reached or passed (3:20). The same caveat appears again at 3:54: a failure swing that reaches but does not exceed old highs can still be enough to attempt the trade idea.
Applying the ICT Model to Intraday Forex
The analysis then narrows to the February 10 daily candle shown in the lesson (3:36). ICT first changes to a 15-minute chart (4:18) and marks the portion of the session he wants to inspect. He then moves to a five-minute chart (5:14) to introduce the time window associated with the example.
ICT Forex Windows for New York and London
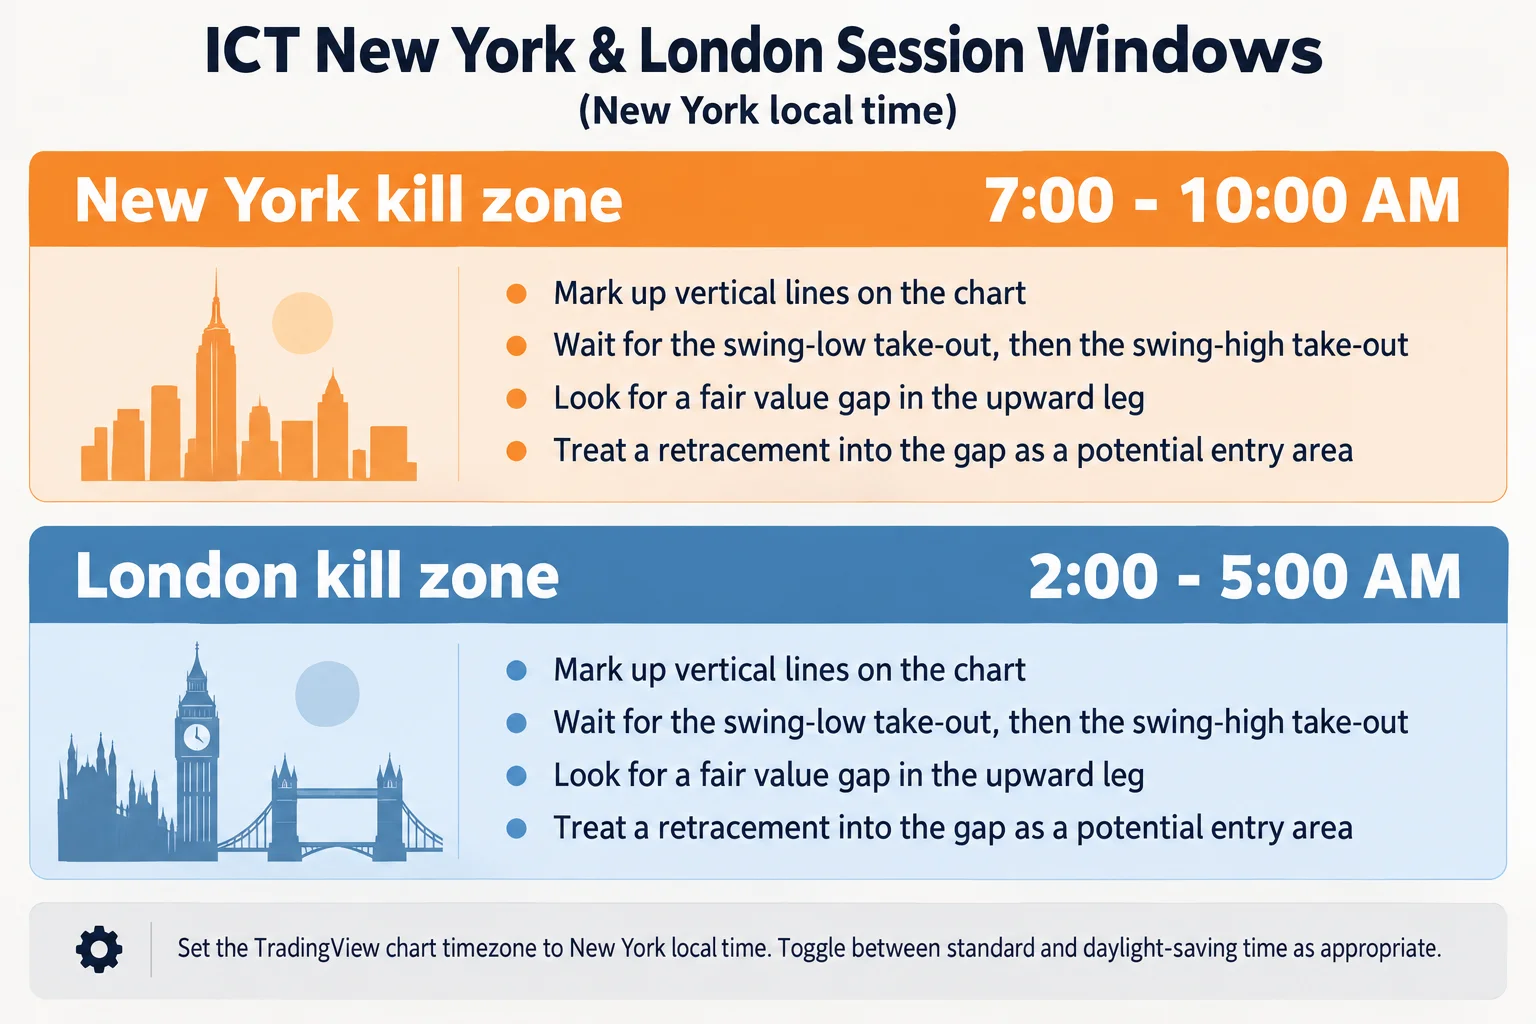
At 5:34, ICT defines his New York "kill zone" for this Forex lesson as 7:00 a.m. to 10:00 a.m. New York local time. He repeatedly emphasises that the chart timezone must be set to New York time rather than the viewer’s local timezone (6:06, 11:35). Later, at 10:07, he gives a corresponding London window of 2:00 a.m. to 5:00 a.m. New York local time.
Because New York observes both standard and daylight-saving time, "New York local time" is the operative wording. A fixed UTC conversion would not remain correct throughout the year.
- London window: 2:00 a.m.–:00 a.m., New York local time.
- New York window: 7:00 a.m.–:00 a.m., New York local time.
- Purpose: Restrict setup hunting to a defined session period, then require the price pattern described in the lesson.
ICT Forex Model on Lower Timeframes
Beginning around 6:19, ICT describes the conditions he looks for on the lower timeframe: the market trades below a swing low, then rallies above a swing high, and the resulting upward leg contains one or more fair value gaps. The relevant upward leg is then reviewed for a fair value gap he treats as a potential entry area.
On the three-minute chart at 7:06, he repeats the sequence:
- Price trades beneath a prior swing low.
- Price then trades above a prior swing high.
- The intervening upward leg is checked for one or more fair value gaps.
- A retracement into a selected gap is treated as a potential entry area within ICT’s model.
ICT also cautions that price can move through the first area toward another (7:35). That qualification matters: the transcript does not support treating every gap touch as a precise reversal signal.
ICT Model Targets During Forex Expansion
The lesson next considers how to frame a target when price is expanding rather than trading inside an obvious nearby range. Around 7:57, ICT asks how far a move might extend when the visible old high is relatively distant. His solution is to anchor a Fibonacci tool to a prior price leg and read the "standard deviation -1" level (9:00). He reads the projected value as 133.153 (9:10) and later repeats it as ".15 and 3" (9:27). Because the source is automated speech recognition and the on-screen chart cannot be verified from the audio alone, the anchors, tool orientation, and displayed value should be checked directly in the recording.
This is a description of ICT’s projection technique, not evidence that the level was knowable in advance or executable at the displayed price.
Applying the ICT Forex Model to Component Currencies
The final section adds intermarket context. At 11:49, ICT summarises the bullish EUR/JPY thesis, then at 12:10 he opens a chart of 6E, the euro futures contract, to discuss what euro has been doing. He then turns to the yen (12:28) and reasons that a relatively strong euro and relatively weak yen would support a bullish EUR/JPY narrative (12:40).
As a general educational interpretation, a cross such as EUR/JPY expresses the value of one currency relative to another. Comparing the apparent direction of its components can help organise a hypothesis; it does not, by itself, determine the cross’s next move, and labels such as "strong" and "weak" depend on the timeframe and evidence selected.
2022 ICT Mentorship Episode 8 Takeaways
Episode 8 presents a top-down process:
- Establish a daily directional idea using relative equal lows and a swing-high take-out.
- Identify a structural shift and an associated fair-value-gap imbalance on the daily chart.
- Restrict attention to the New York or London kill zone in New York local time.
- On a five-minute or three-minute chart, look for a swing-low take-out followed by a swing-high take-out and a fair value gap inside the upward leg.
- Frame a possible objective with a Fibonacci standard-deviation level, and check cross-currency context for the pair.
ICT frames EUR/JPY as an illustration while reiterating that he personally dislikes trading yen pairs (9:48, 9:54). The transcript alone does not provide enough information to reconstruct an actual trade, verify chart markings, or evaluate the model statistically.
This summary is educational. It is not investment advice, a trading signal, or a promise of performance.
2022 ICT Mentorship Episode 8 Resources
- 2022 ICT Mentorship Episode 8 (YouTube) The primary recording narrated in this article.
- ICT 2022 Mentorship Episode 18 (YouTube) Primary-source mentorship lesson covering fair value gap annotations and market structure shifts.
- ICT Trading Books and PDF Guide – The Inner Circle Traders Companion-site overview of the 2022 ICT Mentorship series. Unofficial, untested third-party tutorial.
- Fair Value Gaps vs Order Blocks – The Inner Circle Traders Companion-site primer on the FVG three-candle pattern. Unofficial, untested third-party tutorial.



