
Key takeaways
ICT 2022 Mentorship Episode 33 presents a conditional confluence model in which price breaks the preselected 3915.25 liquidity level, displaces lower, creates a five-minute fair value gap, returns to test that imbalance, then continues toward the 3855 sell-side liquidity objective.
Read the full summary
ICT 2022 Mentorship Episode 33 presents a conditional confluence model in which price breaks the preselected 3915.25 liquidity level, displaces lower, creates a five-minute fair value gap, returns to test that imbalance, then continues toward the 3855 sell-side liquidity objective. The hourly chart establishes context, the 15-minute chart confirms the consequential break and displacement, and the five-minute and one-minute charts reveal the execution pattern, with ICT rejecting smaller lows and consolidation as too sloppy during elevated volatility. At nine minutes six seconds he distinguishes the setup from conventional broken support becoming resistance and says the old low is insufficient without an imbalance, while around eleven minutes fifteen seconds he notes that the gap was visible on the five-minute chart but not the 15-minute chart. The required sequence is an advance-selected liquidity level, a confirmed break, displacement, a lower-time-frame fair value gap, a retracement into that gap, and another liquidity pool as the target. The afternoon review describes a reversal from around one thirty into equilibrium, premium and an older overhead imbalance near the close. The article treats the episode as educational chart-reading commentary rather than verified evidence of profitability because the transcript is automatically generated, the chart is unavailable, and no controlled test, performance statistics, exact fills or independently replicable rules are provided.
How we researched this article
BestProps used document-based research from primary firm sources, checked September 25, 2026. The complete source list, scope, limitations, and commercial-state record appear near the end of this article.
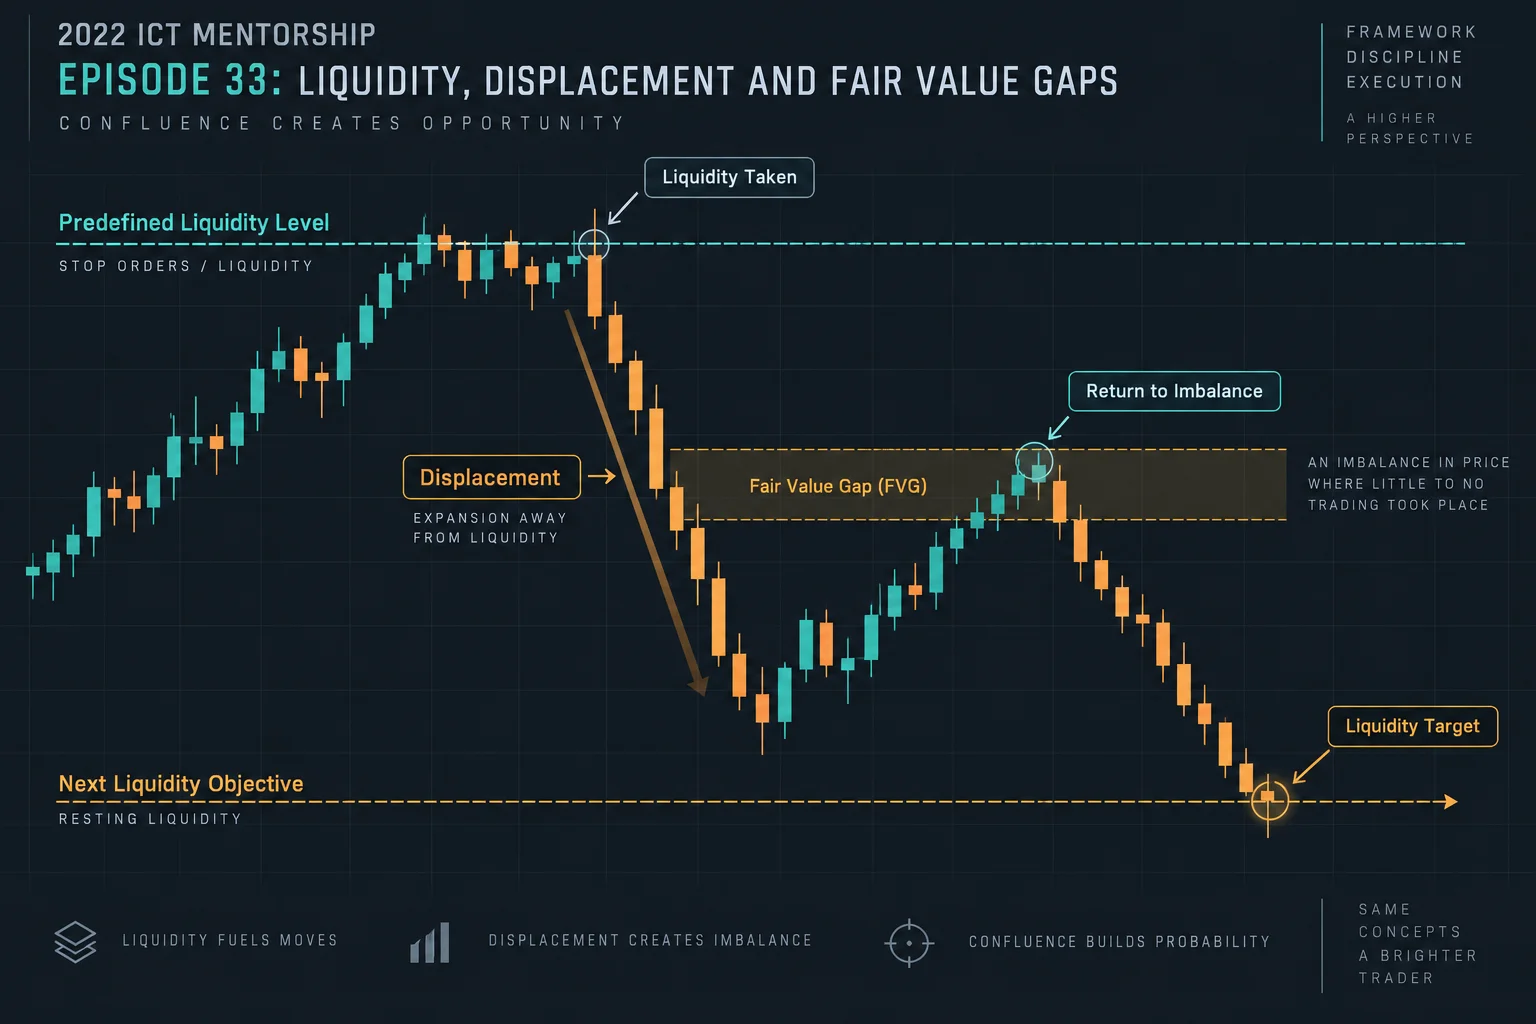
In 2022 ICT Mentorship Episode 33, ICT reviews a Friday trading session through hourly, 15-minute, five-minute and one-minute perspectives. His central lesson is that a level break alone was not enough for the setup he wanted. He waited for a selected low to be breached, then looked for displacement and a fair value gap that could frame a continuation toward another liquidity objective.
The discussion is a retrospective explanation of ICT’s market model, not independent proof that the model predicts prices or produces profitable trades. Because the transcript was generated with automatic speech recognition and does not include the chart itself, the review below explains only the relationships ICT describes.
ICT Episode 33 Trade Conditions and Liquidity
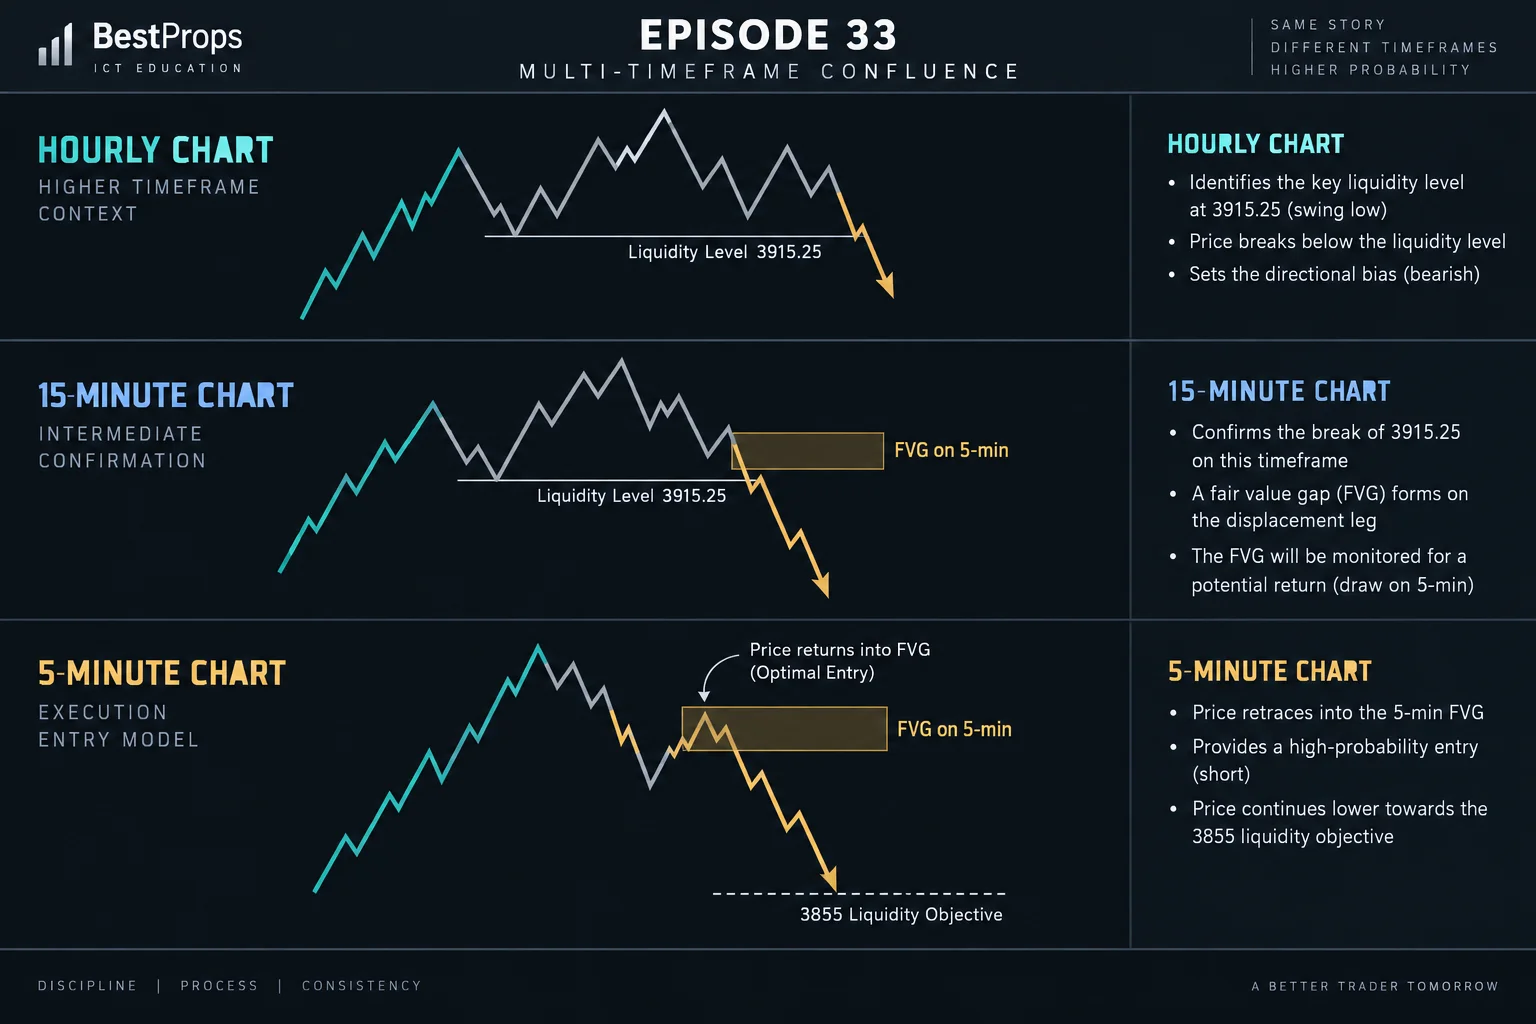
ICT begins by saying the market had traded below a May 12, 2022 low. He then identifies 3915.25 as the intraday level whose break mattered to his analysis. According to ICT, the earlier action was consolidation, and he did not want to act while price was moving back and forth within that area. He regarded the eventual break as a turning point rather than treating every minor low as an equivalent signal.
At 4:23, he explains that price could instead have moved higher and taken nearby highs. This is an important qualification: his bearish scenario was conditional, not presented as the only possible path before the break occurred. Once the chosen low was breached, he says price took nearby sell-side liquidity and continued toward the 3855 level.
Later, at 10:30, ICT returns to the reason for waiting. The smaller short-term lows could have supported a more aggressive interpretation, but he says elevated volatility made him prefer confirmation through the more consequential 15-minute level.
ICT Displacement and Fair Value Gaps
After the level broke, ICT shifted attention to a fair value gap visible on a lower time frame. In ICT terminology, a fair value gap is an imbalance associated with a forceful price movement across a sequence of candles. His lesson here is not simply to sell because prior support was broken. Instead, he looks for a rapid move away from the level (described as displacement) and then a return into the imbalance created by that move.
The distinction is explicit at 9:06. ICT compares the sequence with a conventional “broken support becomes resistance” explanation, but says that is not how he classifies it. In his framework, the preselected liquidity level and the presence of a fair value gap must work together. He says he would not trust the old low by itself if the imbalance were absent.
This also explains why a setup might not appear clearly on every chart interval. Around 11:15, ICT notes that the relevant gap was not visible on the 15-minute chart but appeared on the five-minute chart. The higher time frame supplied the broader condition, while the lower time frame supplied the pattern he used for execution analysis.
ICT Liquidity Objectives and Trade Confluence
ICT characterizes his marked lows as liquidity references rather than arbitrary support and resistance lines. In his interpretation, resting orders may cluster around old highs and lows, making those areas potential objectives. After the 3915.25 break and the formation of a fair value gap, he expected price to reach toward the stated 3855 area.
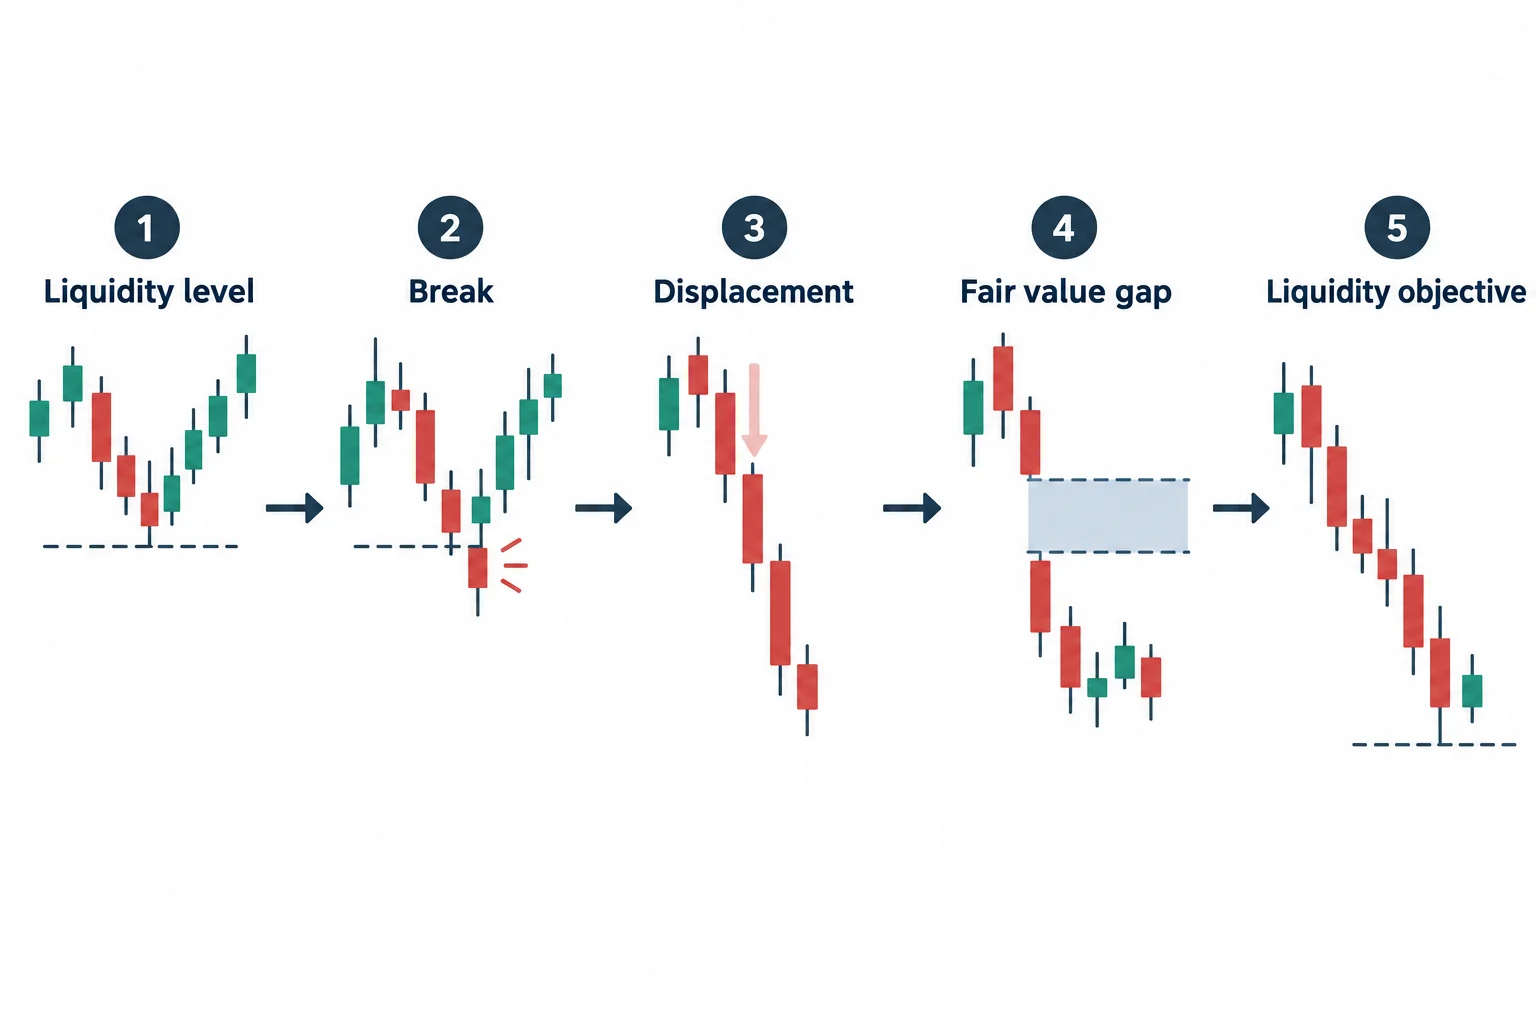
At 11:56, he summarizes the setup as a confluence of several conditions:
- A meaningful liquidity level was identified in advance.
- Price broke that level rather than remaining in consolidation.
- The break produced displacement.
- A lower-time-frame fair value gap formed.
- Another liquidity area supplied a directional objective.
ICT’s point is that no single item supplied the complete rationale. The decision depended on the sequence and alignment of the conditions. This is also why he rejected the earlier, less organized price action as “sloppy” and said he did not yet have a setup.
ICT Premium Liquidity and Afternoon Reversal
The episode also addresses why price need not retrace deeply into every dealing range. ICT discusses equilibrium as the midpoint of a selected short-term range, with the area above that midpoint described as premium. During the faster bearish move, he says he did not expect a larger retracement because, in his interpretation, price was moving urgently toward the lower weekly objective.
He then reviews an afternoon move in the opposite direction. From the low formed around 1:30, ICT describes price returning toward the middle and premium portion of a range, eventually reaching an older imbalance near the close. This illustrates that his directional reading was session-dependent: the morning discussion focused on a downside liquidity objective, while the later discussion examined a rebound into an overhead imbalance.
At 14:08, ICT revisits the one-minute view and describes a return into the fair value gap followed by the move toward the next liquidity pool. The transcript supports the conceptual sequence, but it cannot independently verify the candles, exact entries or fills shown on the unseen chart.
2022 ICT Mentorship Episode 33 Takeaways
The most transferable lesson is procedural rather than predictive: define the scenario that would make a setup valid, wait for that condition, and distinguish a structured move from undirected consolidation. ICT also urges viewers to collect historical examples instead of expecting one demonstration to build pattern recognition. He calls this backtesting, although the episode does not provide a controlled test, performance statistics or a complete set of rules suitable for independent replication.
The video includes claims about trades and account growth involving ICT’s son. Those statements are part of the speaker’s anecdotal commentary and cannot be verified from the transcript. ICT himself says the reported return was atypical and does not promise viewers similar results. The episode is therefore best treated as an explanation of ICT’s chart-reading framework, not evidence of expected profitability or investment advice.
2022 ICT Mentorship Episode 33 Resources
- 2022 ICT Mentorship Episode 33 (YouTube) Primary source video.
- ICT Mentorship Episode 32: Order Flow and Liquidity Concepts Previous episode in the series covering foundational liquidity and order flow concepts.
- ICT Mentorship Episode 34: Session Open Types and Bias Next episode in the series discussing session-specific bias and open types.
- What Are Fair Value Gaps (FVG)? BestProps educational guide explaining fair value gaps as price imbalances.



