
Key takeaways
ICT’s 2022 Mentorship Episode 17 applies his forex model to EUR/USD by building a bearish daily liquidity narrative from swept relative equal highs and untouched equal lows, then refining it across hourly, 15-minute, five-minute, and four-minute charts.
Read the full summary
ICT’s 2022 Mentorship Episode 17 applies his forex model to EUR/USD by building a bearish daily liquidity narrative from swept relative equal highs and untouched equal lows, then refining it across hourly, 15-minute, five-minute, and four-minute charts. The projected objective combines sell-side liquidity near 1.09 with Fibonacci-derived extensions, while 00, 20, 50, and 80 endings are classified as institutional price levels. The intraday framework favors a counter-directional rally or Judas swing before a decline, following the Power of Three sequence of accumulation, manipulation, and distribution. For forex, the New York open kill zone is seven a.m. to ten a.m. New York time, compared with eight thirty a.m. to eleven a.m. for indices. Bearish setups should preferably form above the relevant opening price, and when the eight thirty a.m. open is below the midnight open, that lower price becomes the minimum threshold for upside protraction, with the rule reversed for bullish conditions. Lower-time-frame confirmation uses imbalances, bearish order blocks, displacement, and fair value gaps, while scheduled news such as the ten a.m. ISM Services PMI release is treated as a volatility catalyst that may sweep nearby stops. ICT advises allowing several pips for spread rather than exiting exactly at an obvious target. The trade was retrospective and hypothetical, ICT says near 25 minutes 40 seconds that he did not take it and had not traded FX during 2022 up to that point, and the article provides no charts, independently verified trades, or performance evidence.
How we researched this article
BestProps used document-based research from primary firm sources, checked September 25, 2026. The complete source list, scope, limitations, and commercial-state record appear near the end of this article.
In 2022 ICT Mentorship Episode 17, ICT explains how he applies the mentorship model to the foreign-exchange market. Using a EUR/USD example, he moves from a daily directional narrative to hourly, 15-minute, five-minute, and four-minute charts. The lesson emphasizes liquidity, opening prices, time-of-day windows, fair value gaps, order blocks, and practical allowances for spreads.
This is a summary of ICT’s interpretation of the illustrated session, not independent proof that the concepts predict markets. The transcript does not provide the charts themselves, independently verified trade data, or evidence of subsequent performance.
ICT Forex Model for Building a Daily Liquidity Narrative
ICT begins with a EUR/USD daily chart. At 3:50, he identifies what he calls relative equal highs and says price had moved above them, taking buy-side liquidity or buy stops. He then looks below the market for relative equal lows (at 1:49 and 1:56), which he treats as possible pools of sell-side liquidity.
Because one daily low had not yet moved beneath another marked low (at 2:09), ICT describes the lower area as “unfinished business” (at 2:13). His resulting narrative for the next candle is bearish, despite several consecutive down-close candles. In his framework, the prior move above the highs and the remaining lows below create the directional premise.
He also discusses chart annotation. Newer students are encouraged to draw relevant highs, lows, and levels while learning. ICT says he personally prefers cleaner charts once the recognition process becomes familiar, partly so an existing annotation does not prevent him from noticing evidence that could invalidate the original premise.
ICT Forex Big Figure at 1.09
At 4:53, ICT introduces 1.09 as a “big figure” or zero level. He groups 00, 20, 50, and 80 endings under his term “institutional price levels,” arguing that these areas can attract transaction activity. He then compares the 1.09 region with levels derived from a Fibonacci extension applied to the swing shown on his chart.
The captions render one nearby phrase as “falcon point” (at 6:42), followed by “fulcrum point” (at 6:44). The first term is unclear and may be a transcription error, so it should not be treated as a defined concept based on this transcript alone. The supported point is that ICT makes his projected extension levels conditional on the referenced low first being broken.
Applying the ICT Forex Model From Hourly to Intraday
On the hourly chart (at 7:06), ICT describes price trading into a buy-side liquidity area and then breaking through several short-term lows. By the start of the illustrated day, his stated expectation is for price to seek the equal lows and the 1.09 area.
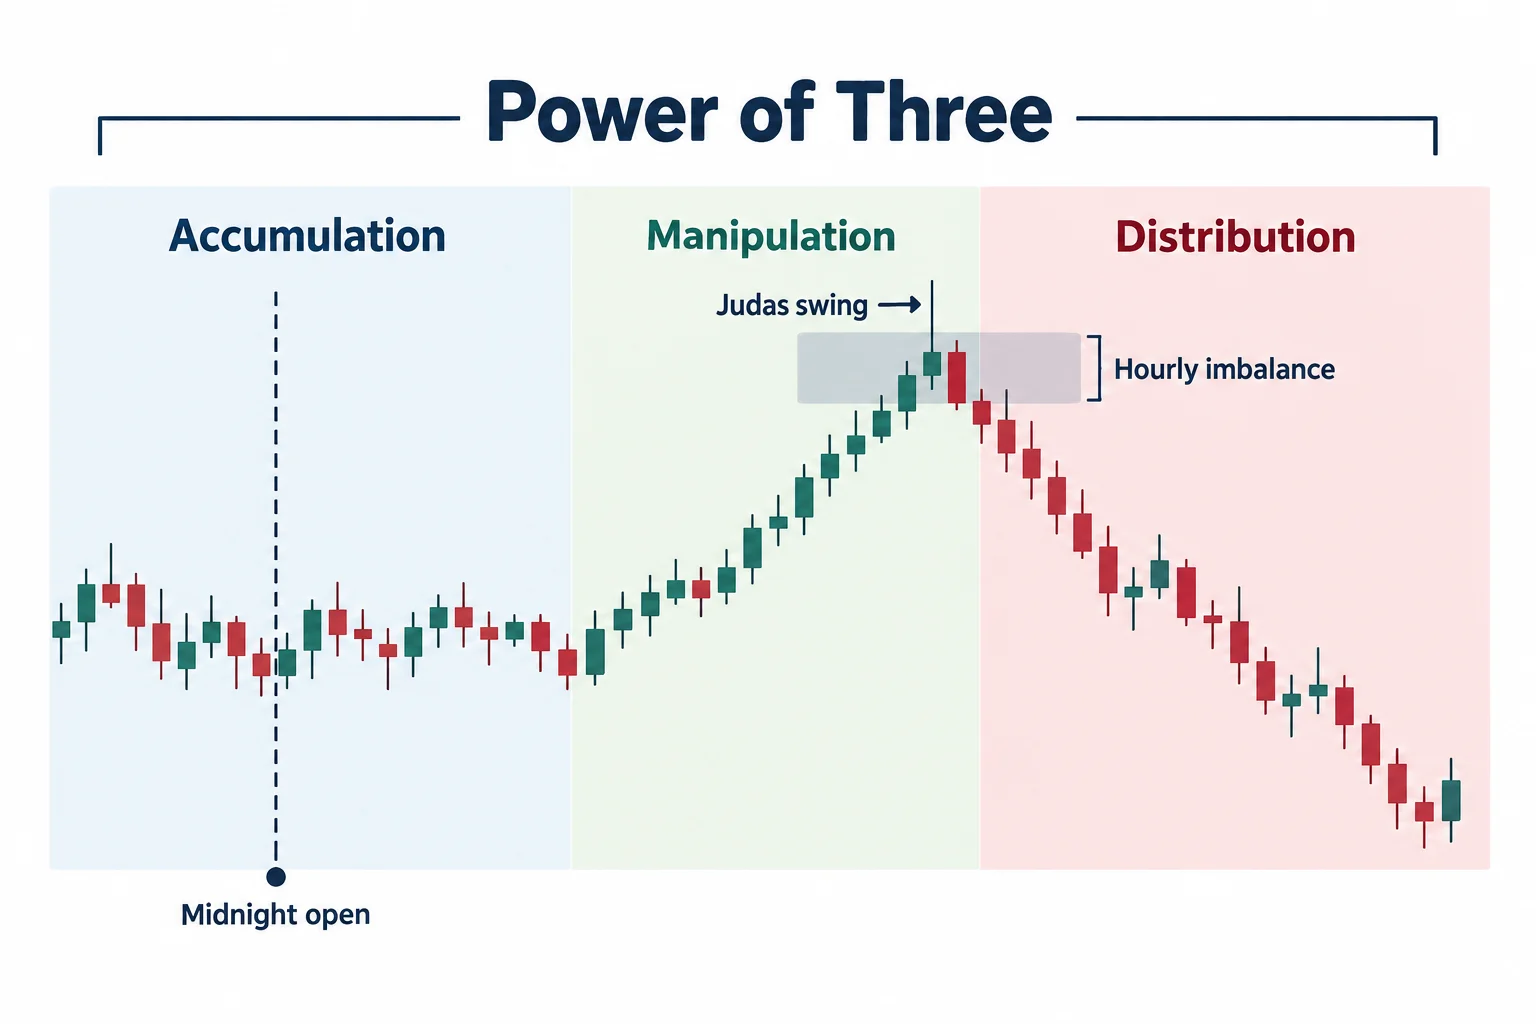
Rather than expecting an immediate decline, he says a bearish day preferably begins with a rally against the anticipated direction. At 7:45, he anchors the analysis to midnight New York local time. He calls the initial counter-directional move a “Judas swing” (at 8:09) or market protraction and places it within his “Power of Three” sequence (accumulation, manipulation, distribution at 8:18):
- Accumulation
- Manipulation
- Distribution
In the example, the desired rally enters an hourly imbalance before the anticipated move lower. ICT then drops to a 15-minute chart and extends the midnight opening price across the session (at 9:13). Under his bearish narrative, he prefers potential short setups to form above that opening price rather than below it.
ICT Forex Timing Around the New York Open
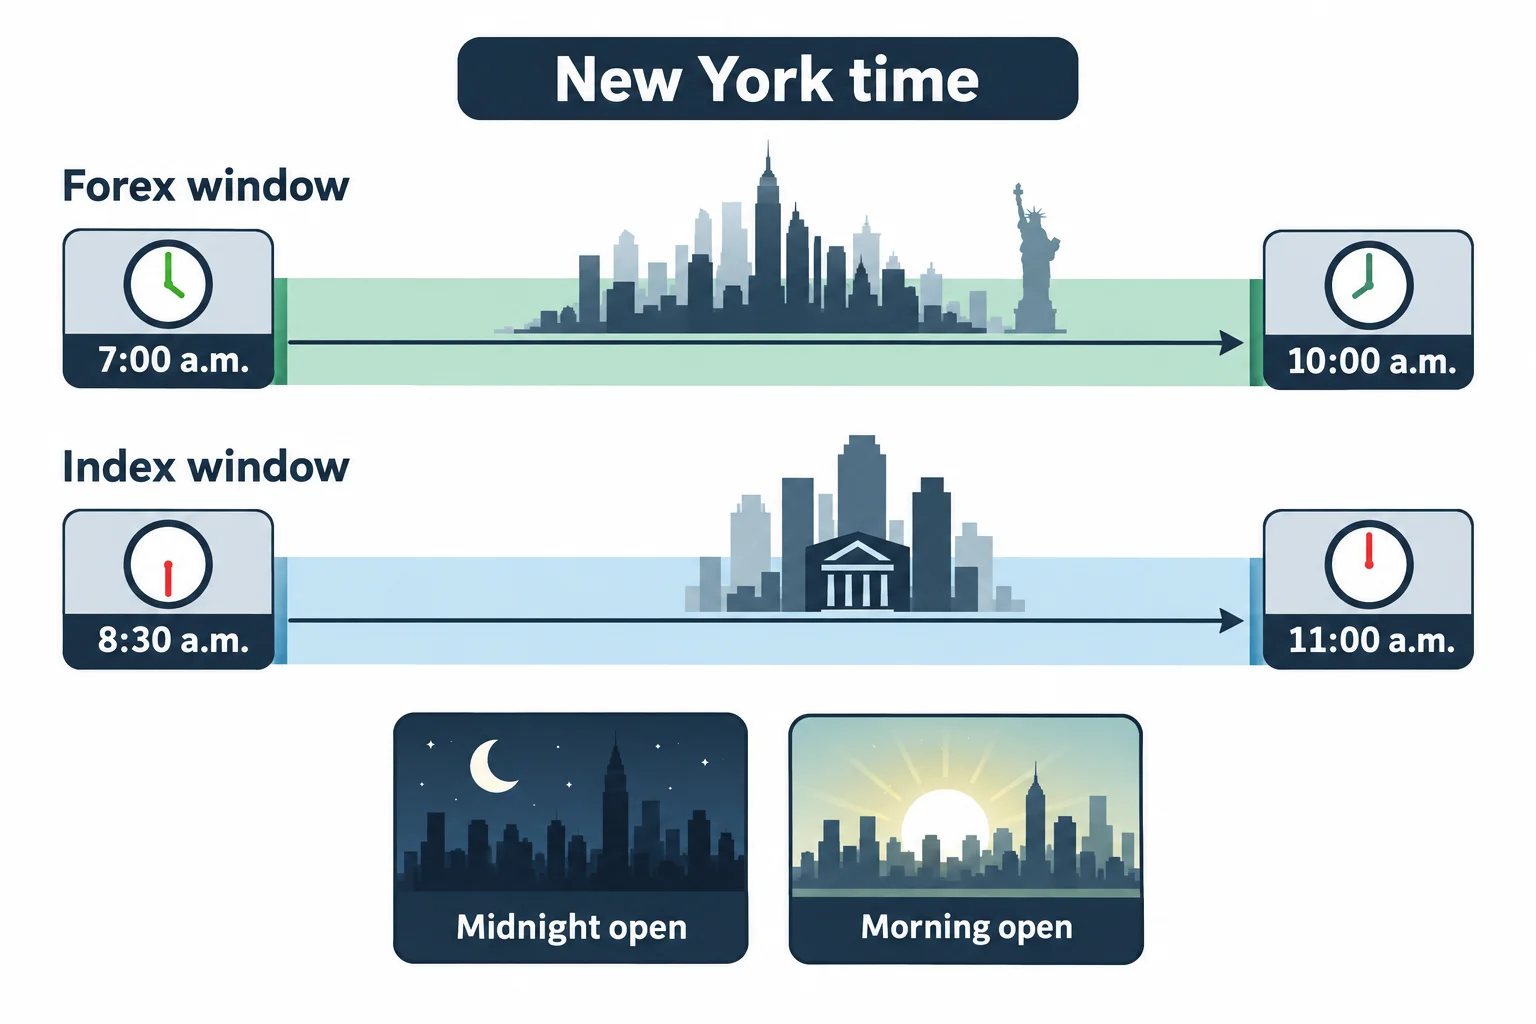
At 10:17, ICT combines an imbalance, a return during the New York morning, and what he labels a bearish order block (at 10:59). He defines the forex “New York open kill zone” in this lesson as 7:00 a.m. to 10:00 a.m. New York time (at 10:22). He contrasts that with an 8:30 a.m. to 11:00 a.m. window used in his index discussion.
For a New York-session forex setup, he says traders should reference both midnight and 8:30 a.m. opening prices. At 18:45, he explains his rule for the illustrated bearish case: if the 8:30 opening price is lower than the midnight opening, use the lower opening as the minimum threshold for an upside protraction. He says the logic is reversed for a bullish narrative, where the preferred move would first pass below the relevant opening price.
ICT Fair Value Gaps and Order Blocks
ICT uses progressively lower time frames to refine the example. On the five-minute chart (at 16:23), he describes a return above the midnight opening, a reaction around a bearish order block (at 15:35), and a later retracement associated with the scheduled 10:00 a.m. news release. He says the bearish narrative, rather than the mere presence of an imbalance, is what gives the swing high contextual importance.
At 20:05, he switches to a four-minute chart and identifies a small fair value gap within the price leg. In his reading, price fills that gap and then displaces lower toward the daily objective. He says the move reached the old relative equal lows and a Fibonacci-derived extension, while acknowledging that it did not trade exactly to 1.0900.
ICT Forex Model for News and Volatility
The example includes a 10:00 a.m. ISM Services PMI release (at 12:21). ICT says he is less concerned with interpreting the reported economic data than with anticipating volatility near the scheduled release. He characterizes the news move as a “wild card” capable of reaching nearby stops before price continues in the direction of the broader narrative.
Later, he says high-impact releases after 10:00 a.m. can extend the practical observation window, giving a Canadian-dollar and crude-oil-inventory example. This is presented as ICT’s market interpretation, not a guarantee that a scheduled announcement will produce a particular direction or setup.
ICT Forex Execution and Exit Considerations
From 20:20, ICT cautions against placing an exit exactly at a conspicuous target. He discusses allowing several pips for the bid-ask spread and illustrates a hypothetical entry, stop, and target. He also presents a hypothetical risk-to-reward calculation, but the transcript does not establish a live fill or realized result.
Importantly, ICT states near 25:40 that he did not take the illustrated trade and had not taken an FX trade during 2022 up to that point. The example is therefore retrospective instruction rather than documentation of an executed position.
2022 ICT Mentorship Forex Takeaways
The lesson’s central workflow is to begin with a higher-time-frame liquidity narrative, identify a likely objective, wait for a counter-directional move near a relevant opening price, and then inspect lower time frames for the patterns ICT calls displacement, fair value gaps, and order blocks. Time of day and scheduled news are treated as filters rather than standalone entry signals.
Those ideas are specific to ICT’s methodology and terminology. Anyone studying the episode should separate the internally consistent walkthrough from empirical validation, which this single retrospective example does not provide. This commentary is educational and is not investment advice or a promise of trading performance.



