
Key takeaways
2022 ICT Mentorship Episode 16, uploaded April 2, 2022 on the Inner Circle Trader YouTube channel, uses June 2022 E-mini S&P 500 futures to show how daily, hourly, 15-minute, five-minute, and one-minute analysis can reveal multiple New York intraday setups.
Read the full summary
2022 ICT Mentorship Episode 16, uploaded April 2, 2022 on the Inner Circle Trader YouTube channel, uses June 2022 E-mini S&P 500 futures to show how daily, hourly, 15-minute, five-minute, and one-minute analysis can reveal multiple New York intraday setups. ICT defines the morning window as eight thirty a.m. to noon, highlights volatility around the nine thirty a.m. cash open, avoids new entries during the noon to one p.m. lunch hour, and treats the afternoon as a separate PM session. His top-down process begins with a higher-time-frame liquidity objective, then filters entries by time of day, premium or discount, displacement, market-structure shifts, fair value gaps, order blocks, mitigation blocks, and retracements. The bearish example moves from relatively equal daily highs toward relatively equal lows and a daily bullish order block, using midnight and eight thirty a.m. New York opens as references. A 15-minute projection measures a prior range from the highest and lowest candle bodies rather than wick extremes and projects extensions below a broken swing low. One-minute short models break a short-term low with bearish displacement, leave a fair value gap, retrace into that gap, and target prior lows or other liquidity, with partial profits possible at an initial objective and a remainder held for a farther target. After the downside daily objective is reached, the PM example shifts from discount toward premium and morning buy-side liquidity, showing that continuation and reversal setups can occur as context changes. ICT stresses that traders should not take every lower-time-frame signal, missing the first move does not necessarily invalidate the directional idea, some days provide only one opportunity, probabilities are not guarantees, and annotated chart review and journaling do not by themselves prove profitability.
How we researched this article
BestProps used document-based research from primary firm sources, checked September 25, 2026. The complete source list, scope, limitations, and commercial-state record appear near the end of this article.
In 2022 ICT Mentorship Episode 16 (YouTube upload date April 2, 2022), ICT explains how he identifies multiple potential setups within the New York morning and afternoon sessions. Using a June 2022 E-mini S&P 500 futures example, he moves from a daily directional narrative to hourly, 15-minute, five-minute, and one-minute charts.
The central lesson is not that traders should take every lower-time-frame signal. Rather, ICT argues that lower-time-frame setups become more meaningful when they align with a higher-time-frame objective, time of day, and his concepts of liquidity, imbalance, premium, and discount. These are ICT’s market interpretations, not independently established rules or guaranteed trading edges.
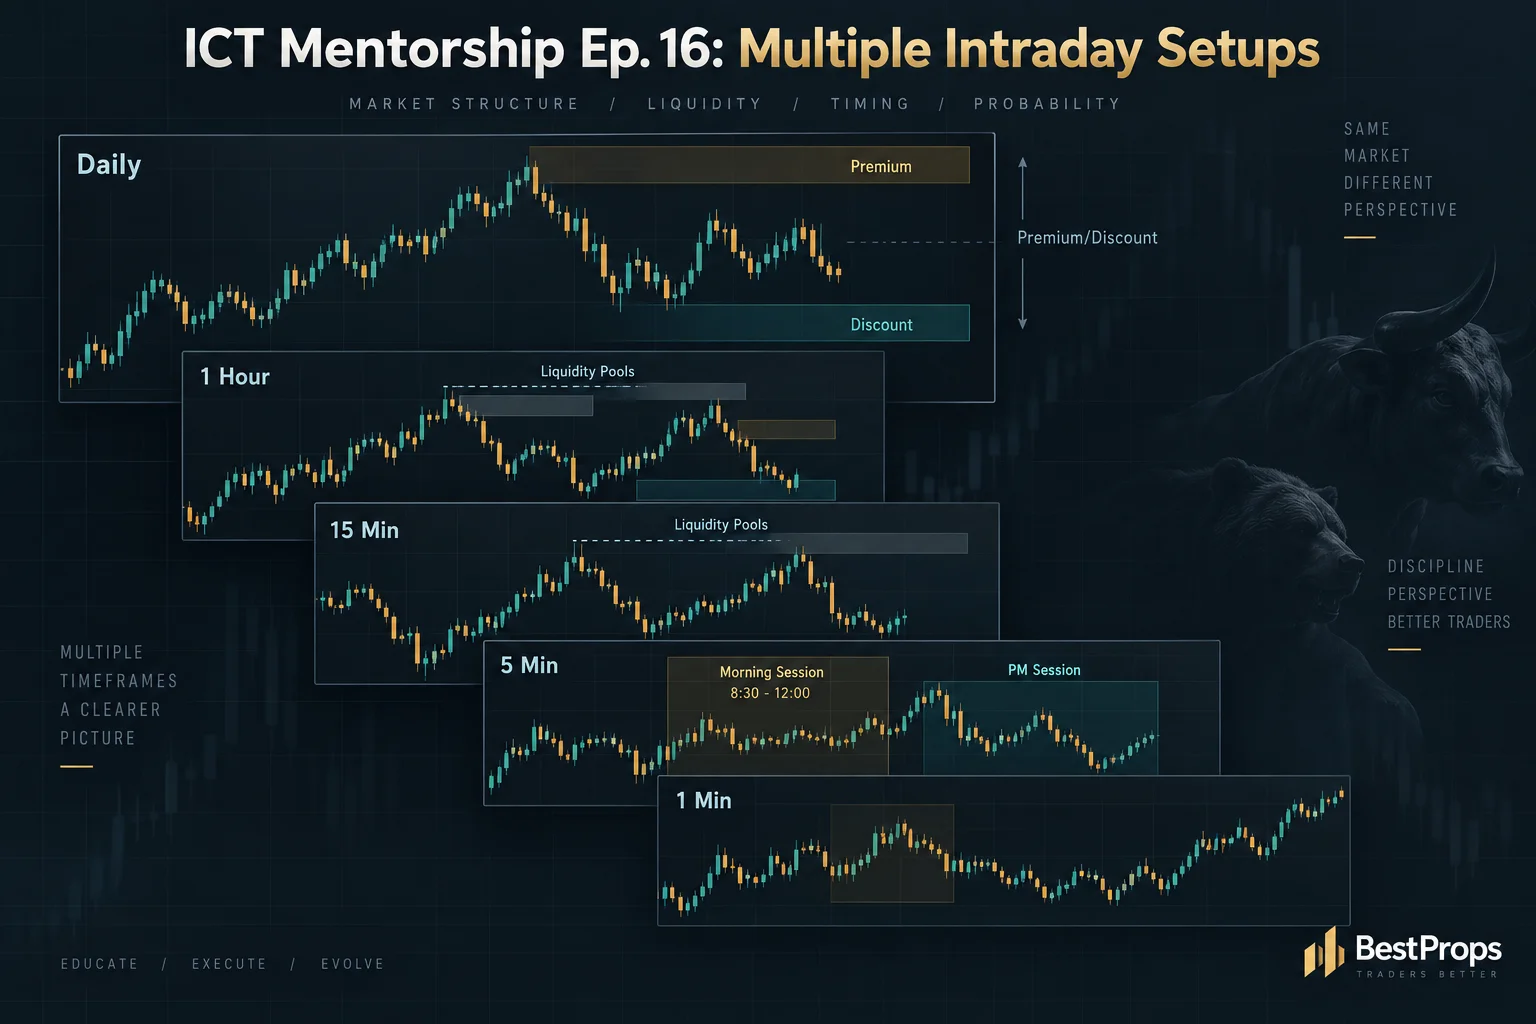
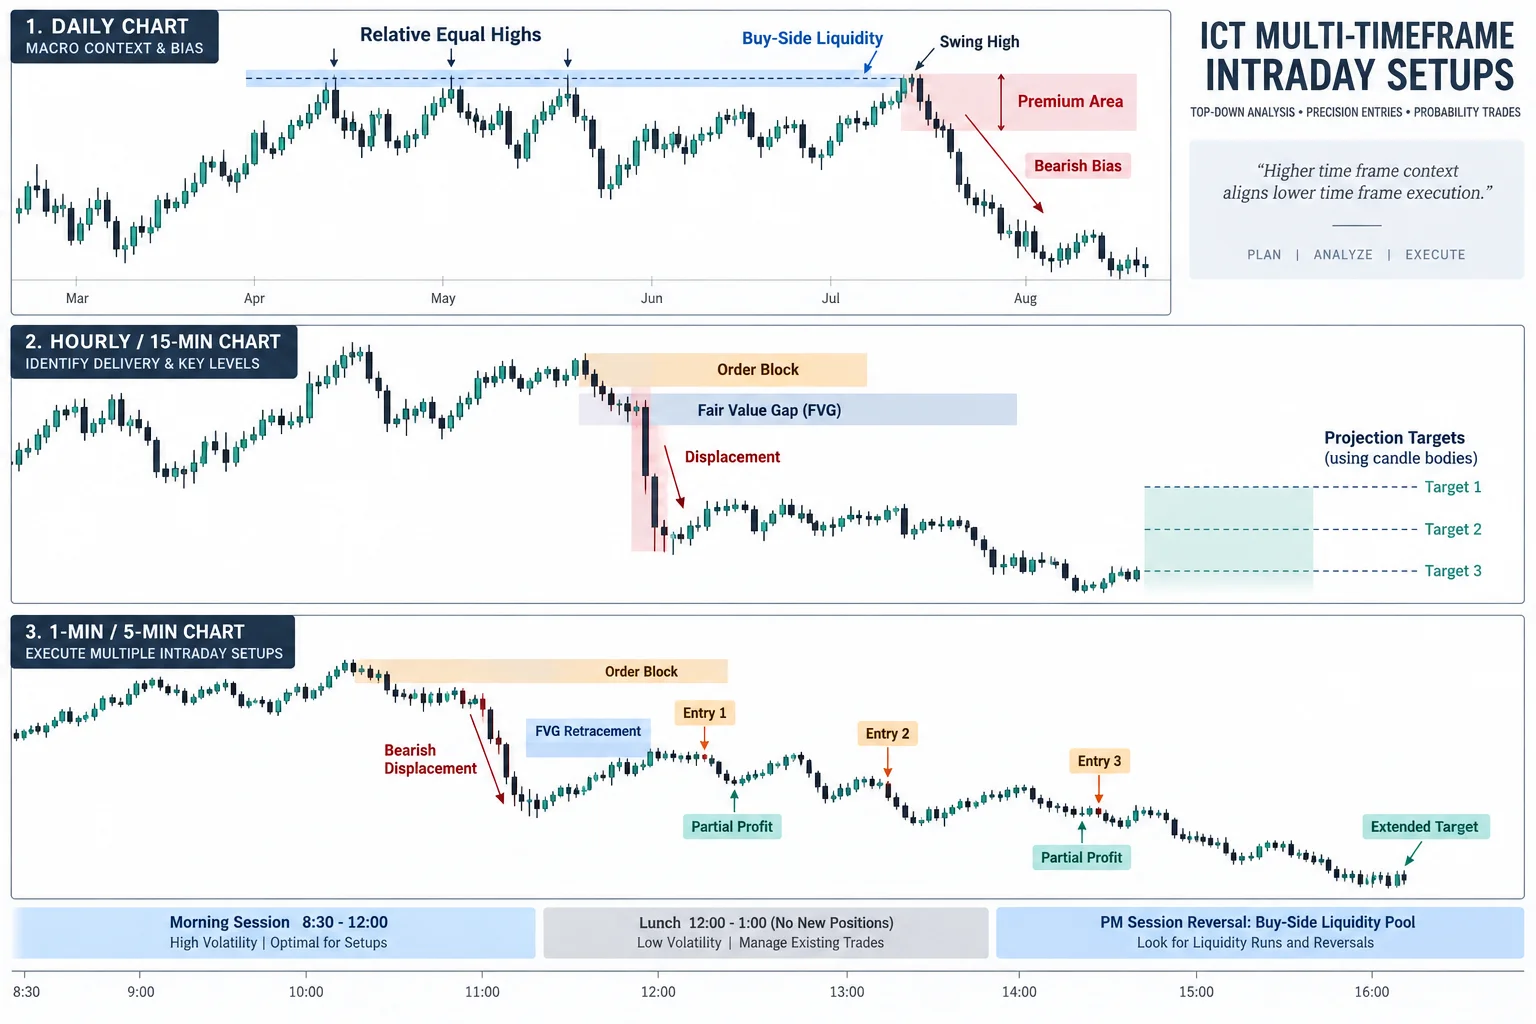
2022 ICT Episode 16 New York Trading Sessions
At 0:10, ICT divides the index-futures day into a morning session and a PM session, with the New York lunch hour, approximately noon to 1:00 p.m. local time, separating them. He describes 8:30 a.m. to noon as the morning window, while later examples also emphasize the volatility associated with the 9:30 cash-market opening.
His purpose is to answer why several setups can appear during one session. A directional move may contain repeated cycles of displacement, retracement, and continuation. In ICT’s framework, each retracement can create another possible entry model, but only when it remains consistent with the broader narrative.
Higher Time Frame Context in ICT Mentorship Episode 16
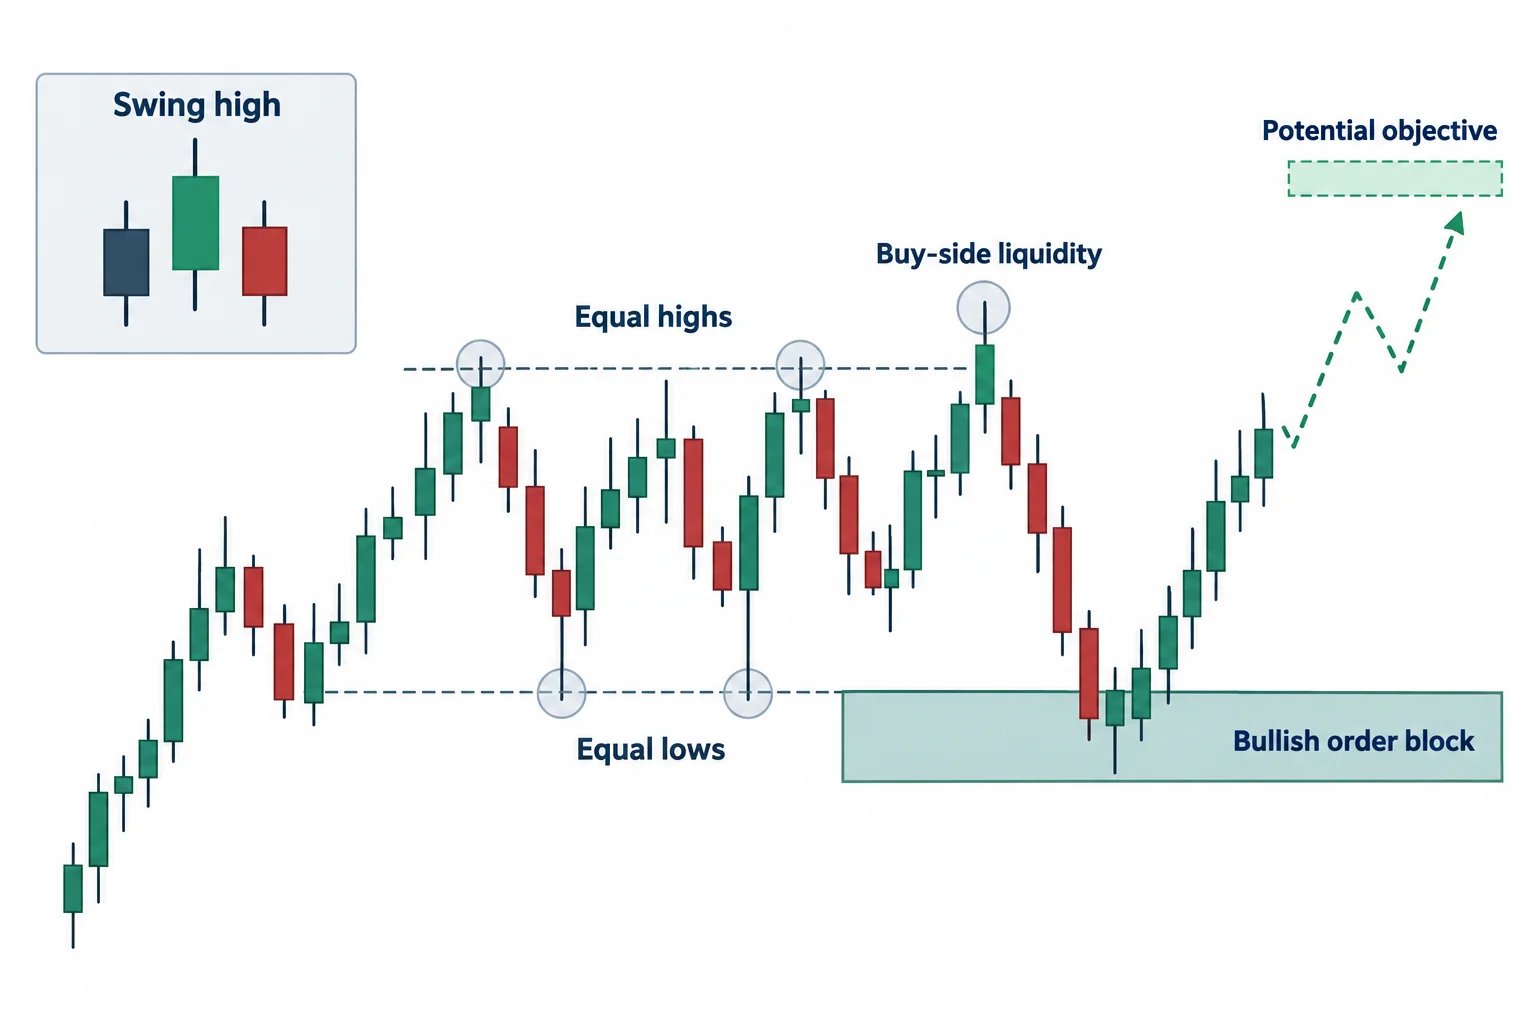
Beginning around 1:14, ICT reviews a daily futures chart. He says price had moved above relatively equal highs, where he interprets buy-side liquidity as resting, and then formed what he calls a swing high. He distinguishes his three-candle swing-high definition from an MT4-style fractal indicator.
From that context, he develops a bearish scenario: price could move from what he calls a premium area toward relatively equal lows and a daily bullish order block. At 3:34, he shifts to the hourly chart and combines those lows with the higher-time-frame order block to define a possible downside objective.
ICT also identifies two reference opens for index futures: midnight New York time and 8:30 a.m. New York time. At 5:12, he explains that the relevant 8:30 opening price is simply the open of whichever chart candle begins at that time. Under his bearish scenario, an initial move above an opening price can function as a counter-directional move before a decline.
Importantly, ICT acknowledges at 6:42 that probabilities are not guarantees and that risk must be considered if the anticipated scenario fails.
ICT Intraday Setup Projection Targets
At 8:11, ICT introduces a 15-minute projection technique. After a swing low is broken and price retraces into what he labels a fair value gap, he measures a prior range and projects it beneath the broken low.
His Fibonacci anchors use the highest and lowest candle bodies (an open or close) rather than the wick extremes. He presents the resulting extension levels as targets that should be layered with other elements, such as relative equal lows and a daily order block. The transcript includes exact historical levels, but those values and the asserted precision cannot be independently verified from captions alone because the chart itself is not supplied here.
Multiple Morning Setup Examples in ICT Episode 16
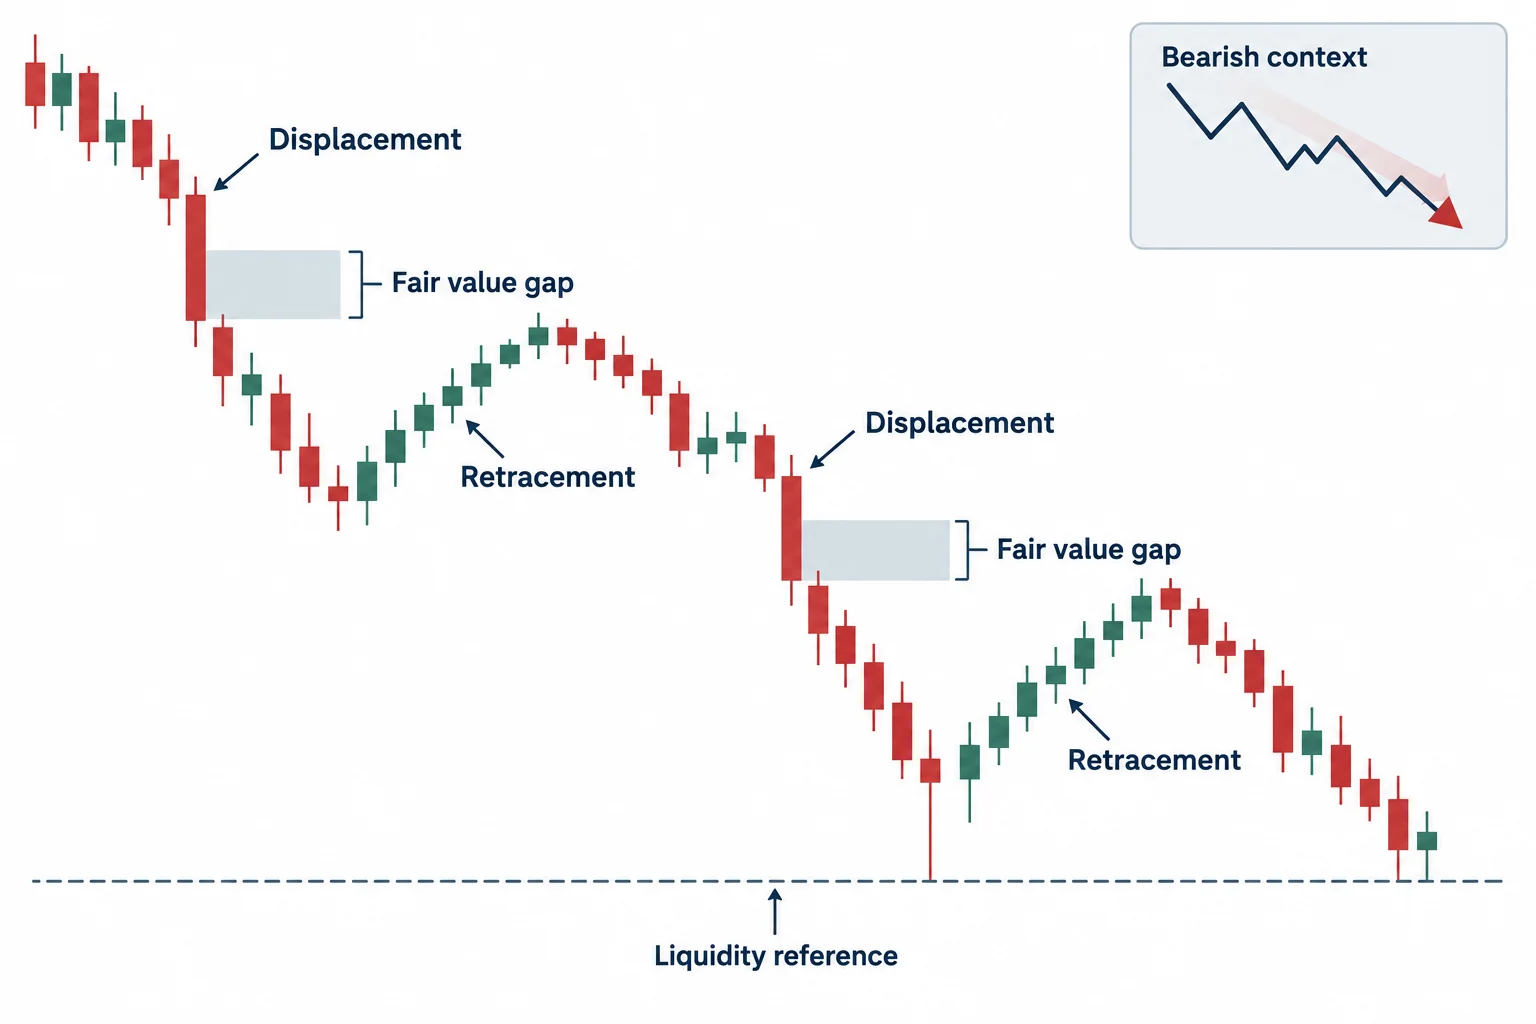
The practical entry discussion begins near 17:54. ICT first compares the 15-minute context with a five-minute chart, noting that the lower-time-frame pattern may look less clean without the higher-time-frame fair value gap.
He then moves to a one-minute chart and asks viewers to pause the lesson and identify possible short setups themselves. From 22:37, he marks several examples built around the same sequence:
- A short-term low is broken with force, which he calls bearish displacement.
- The move leaves an imbalance or fair value gap.
- Price retraces into that gap.
- The prior low or another identified liquidity level becomes the proposed objective.
ICT discusses taking partial profits at an initial objective and leaving another portion for a more distant target. He also says he does not favor opening new positions during the noon-to-1:00 p.m. lunch hour. These are examples of his own trade-management framework, not recommendations.
By 26:41, the broader point is clear: missing the first move does not necessarily mean the directional idea is unusable. Additional retracements may create new setups, although ICT concedes that some days offer only one opportunity before price continues without another entry.
The ICT Intraday Setup for Afternoon Reversals
At 28:44, ICT turns to what he calls a PM-session buy-side liquidity pool. In the example, the market had already reached the downside daily objective on a Friday. He therefore interprets a retracement into the day’s range as a possible move from discount toward premium, with morning highs serving as potential buy-side targets.
Around 34:38, he outlines a bullish example involving a market-structure break, a return to a mitigation block or imbalance, and an objective near earlier highs. Later, after price reaches the highlighted area, he identifies a possible bearish structure shift and fair-value-gap retracement. This illustrates why “multiple setups” can include both continuation and reversal ideas as the session narrative changes.
ICT Mentorship Lessons on Intraday Setup Context
The most useful general interpretation is that setup frequency should follow context rather than replace it. ICT’s sequence starts with a proposed daily draw, narrows it through session timing and intermediate structure, and only then searches for lower-time-frame patterns. Simply marking every gap or broken swing would omit the filtering process emphasized throughout the lesson.
ICT closes with a discussion of chart review and journaling at 38:50. He encourages students to annotate historical charts, record why a setup appeared valid, and look for a repeatable personal model. While he makes strong claims about repetition, algorithms, and potential income later in the video, the transcript does not establish profitability or validate those claims. Historical chart study can help define rules and expose inconsistencies, but hindsight examples do not by themselves demonstrate real-time performance.
2022 ICT Mentorship Episode 16 Resources
- Inner Circle Trader (ICT) YouTube channel Original source of the mentorship series.
- Smart Money Concepts overview (BabyPips) Independent educational summary of related market-structure ideas.
- Fair value definition (Investopedia) General finance reference for fair value, distinct from ICT's fair value gap usage.
- E-mini S&P 500 futures specifications (CME Group) Official contract specs for the instrument discussed.
This summary is for education only and is not investment advice. Futures trading involves substantial uncertainty, and no setup, target, or market narrative is guaranteed.


