How we researched this article
BestProps used document-based research from primary firm sources, checked September 13, 2026. The complete source list, scope, limitations, and commercial-state record appear near the end of this article.
In The Week In The Life Cycle Of Price, a Saturday weekend lecture recorded on 15 August 2026, the Inner Circle Trader (ICT) walks through how he organises a trading week: which levels he marks, how he forms a directional draw, and how he narrows the analysis from a weekly chart down to a one-minute execution chart. He presents it explicitly as a topic study drawn from questions students sent him, using a Nasdaq continuous-contract chart and the September NQ futures contract as the single worked example (1:08).
This article explains the lecture from the recording itself. The source is the video’s audio, transcribed automatically and then read in full; the chart on screen was not available for verification, and the specific levels he reads out are reproduced as narrated rather than confirmed against a chart. The automatic transcription also renders some ICT terms inconsistently, which is flagged where it matters below. ICT’s claims about how price is delivered, about market manipulation and about his own record are his interpretations and are not treated here as established facts.
Start with the weekly range and a reference chart
The lecture opens on a weekly NASDAQ composite continuous-contract chart with the high and low of July marked, followed by the previous week’s high and low (2:12). ICT explains why he prefers a continuous contract for this exercise: it preserves historical highs, lows and inefficiencies that a front-month contract loses at rollover, so it gives a wider field of reference (2:50). He then cross-checks those levels on the September delivery contract (14:20), and notes that traders outside US futures markets can apply the same approach by finding the closest correlated high and low on equivalent index products (4:26).
The first decision is deliberately simple. With the new week opening inside the prior range, ICT asks whether price is closer to the previous week’s and previous month’s highs, or to their lows (7:51). Because the highs sat near the opening price, he treats them as the path of least resistance and looks for the draw on liquidity to be higher (8:44). He then rules out the previous week’s and previous month’s lows as immediate objectives for the week he is reviewing (14:14).
His stated reason for preferring the upside includes a broader market view — that the market had been held up and that the economic data he sees is unreliable (8:55). That is his opinion about the market’s condition, not a measurement, and the exercise works in the lecture only as a conditional scenario: a target candidate near the opening price, in a week that had already been trending up, is easier to reach than a distant low.
Grade the daily chart: wicks, imbalances and encroachment
The monthly and weekly levels are then transferred to a daily chart of the September contract, where ICT adds the structural detail that decides whether the bullish scenario is still intact (13:49). His grading steps are specific:
- A pair of candle levels he labels a SIBI. He marks the low and the high of a candle pair and describes the displacement that cuts through candles as the inefficiency that buying and selling pressure will tend to agree on. The automatic transcript renders this term inconsistently, so it is reported as narrated rather than as a fixed definition (16:07).
- A premium wick defined by context. A wick above price is only a premium array, in his terms, because Wednesday’s close remained below it; he then treats it the same way he treats a gap (16:51).
- Consequent encroachment. He grades the wick to its midpoint and watches how price behaves there; when price failed to reach it he reads that as confirmation that the array was not being consumed, and he calls the pairing of orders at a level “glad handing” (20:06).
- A rejection block. Defined by the inability to print a body close above a high that price repeatedly returns to (1:09:47).
- Relative equal highs as a liquidity pool. He says the expectation is that they are cleared before price continues higher, provided the weekly context still supports the move (16:44).
He makes one concession to conventional reading: a retail bull flag is treated as valid only because it agrees with where price sits relative to the previous week’s and month’s highs (18:02). None of these labels can be verified from an audio transcript; they are his chart annotations, and the levels he reads out are his readings at the time of recording.
Weekly profiles and the economic calendar
ICT’s weekend preparation includes selecting a weekly profile — a schematic for how the week might develop across several days — and then checking whether the economic calendar can supply the timing for that development (46:03). For the week he reviews he notes CPI on Wednesday and PPI on Thursday, both at 8:30 a.m. Eastern (37:44 and 39:39), and he labels the resulting pattern a “consolidation midweek rally” profile (53:28).
He adds a strong opinion about those releases — that the market would not be allowed to do significant work immediately after CPI and PPI — which is his interpretation rather than anything the transcript establishes (39:50). The transferable part is narrower: scheduled reports mark windows where volatility can change, and a weekly profile is only a scenario to test.
Map the week at session level
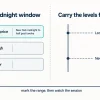
For the session detail he works on a 15-minute chart, which he calls a bellwether timeframe because it can display the whole week while still showing intraday ranges (27:12). His list of references includes the previous Monday’s Asian session high as a buy-side liquidity pool (27:35), the high and low of the last three days (28:16), and the London and New York morning and lunch windows (28:31). His summary is that the draw is derived from session highs and lows and previous highs and lows rather than from analysis-heavy constructs (32:26).
TGIF: the Friday retracement into the weekly range
The Friday section is the most concrete part of the lecture. ICT states that after a bullish week, price frequently retraces off the weekly high into roughly 20% to 30% of that week’s range, which he calls TGIF (41:21). He marks both percentages as separate reference levels (1:00:08), notes that the 30% level coincided with the previous month’s high and the previous week’s high (1:03:46), and says that in extremes the retracement can reach 40% — adding that those extremes are usually deeper than expected and not worth holding for (1:20:35). His preferred objective is the midpoint of the 20–30% zone, roughly 25% (1:21:01).

He is explicit that this is not a support-and-resistance argument: the level matters to him because of its position inside the weekly range, not because a line on a chart should be respected (1:00:34).
Power of Three, the macro window and guarded liquidity
The intraday timing references in the lecture are the 9:30–10:00 a.m. opening range, inside which he expects the session’s first high or low to form (1:04:15), and a 20-minute macro window from 9:50 to 10:10 that he describes as the close of the first hour’s dealing range (1:05:03). He also distinguishes relative equal highs that are “guarded” — his term for levels he does not expect to be taken out in the current context — from equal highs that are there to be swept (1:24:04).
On entry timing he says that when the macro window coincides closely with one of his price arrays he will trade inside it, only a minute after the window opens, and that entries outside the window are acceptable when they occur at a level such as an order block (1:24:25). All of this is his framing of that session’s timing; the transcript does not show the chart, so the windows cannot be checked against the candles.
The Friday execution he describes
Near the end of the recording ICT walks through a short from that Friday. In his account, price rallied into the premium inefficiency he had marked on the daily chart, a rejection block failed to produce a body close above it, the zone was then used as an inversion fair value gap, and a small fair value gap he calls a suspension block formed at the entry (1:13:48). He describes entering with two contracts, partly because the stop he required did not justify more size in his own sizing logic (1:14:31), and taking the position off at the midpoint of the 20–30% weekly retracement zone — the “half of 20 to 30” level he had defined earlier (1:24:48).
He also addresses the scepticism that surrounds this kind of narration. He points out that his screen shows the market closed on a Saturday with no executions visible in replay mode, which is his evidence that he was not using market replay (1:23:42), and says the fills for that trade were posted on X (1:22:30). Those statements are his and are not verifiable from the recording: no brokerage statement, fill price, slippage figure or account result is supplied in the source, so nothing here should be read as a performance claim.
What the recording does not establish
Three limits are worth stating plainly. First, the lecture is a narrated chart review: the transcript cannot confirm any level, annotation, entry marker or exit, and the automatic transcription may have misheard numbers wherever ICT reads a price aloud. Second, the framework is conditional — he repeatedly ties the retracement expectation to a week that has already been bullish, and to levels that were close to the opening price. Third, the broader claims in the recording, including the suggestions that price delivery is algorithmic, that the market is manipulated, and that his levels are followed widely enough to attract liquidity, are his interpretations rather than demonstrated facts (1:02:18).
A repeatable weekly routine
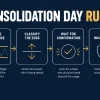
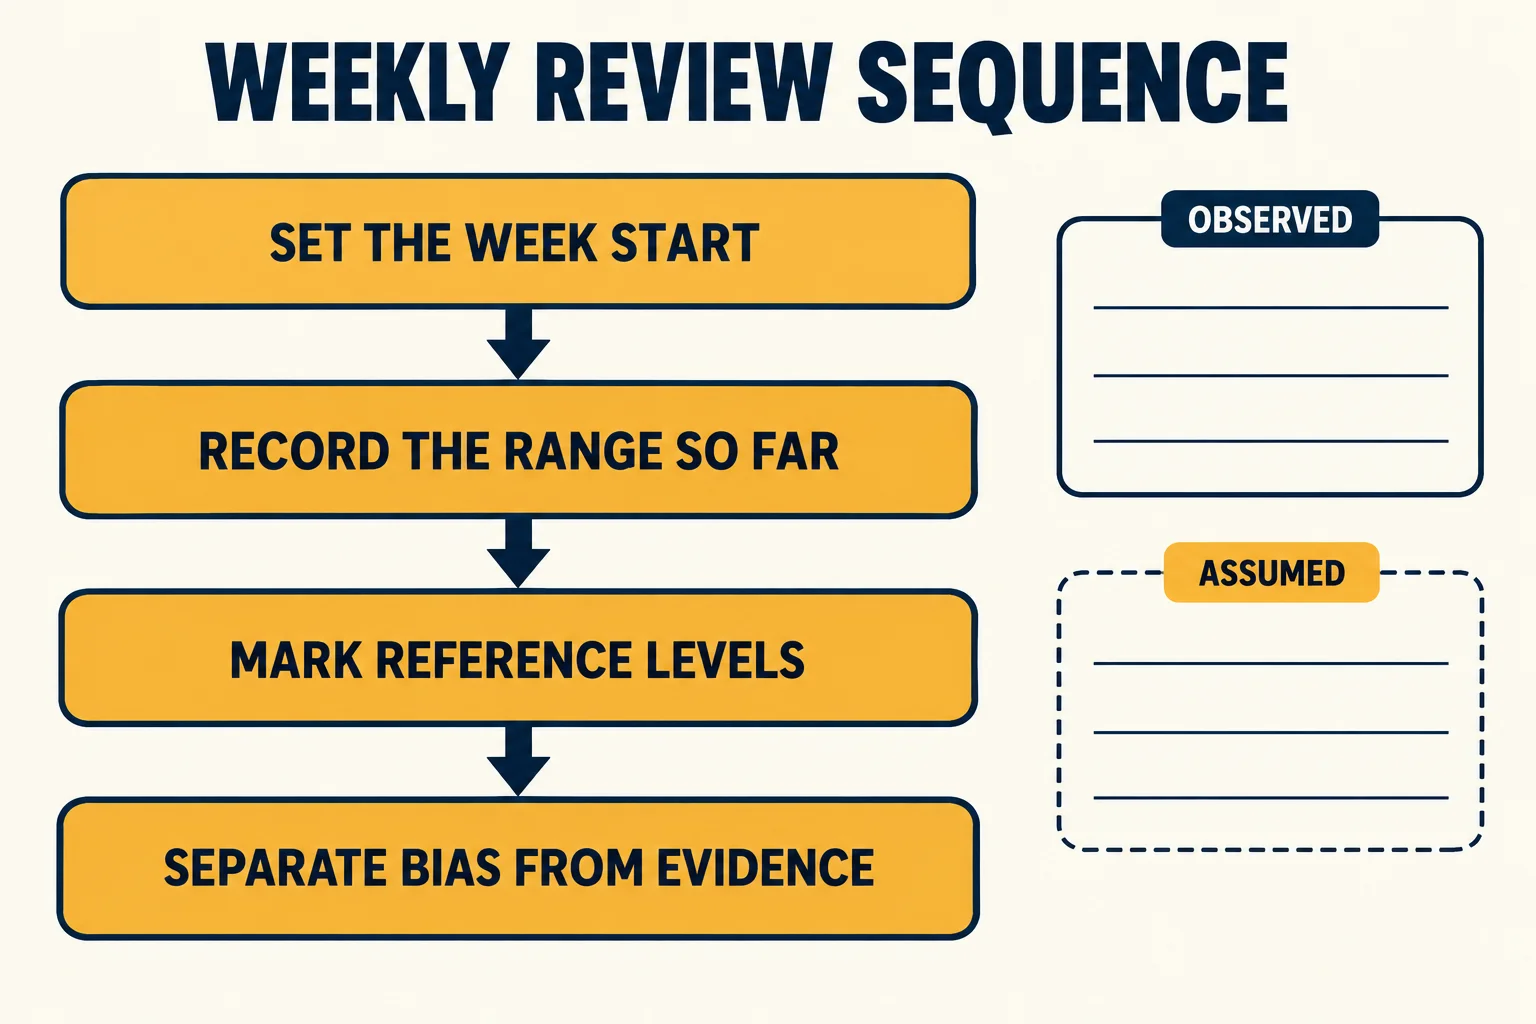
Stripped of terminology, the operational sequence in the lecture is straightforward:
- Mark the previous month’s and previous week’s highs and lows, on a reference chart that preserves historical levels.
- Note where the new week opens relative to those levels and choose the nearer, easier objective rather than a distant one.
- Refine the view on the daily chart and define what would invalidate it.
- Map the session-level highs, lows and midpoints that price has already created.
- Check the economic calendar, then choose a weekly profile that fits the current environment instead of applying every model.
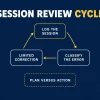
- After the week closes, categorise what actually happened and compare it with the written plan.
ICT says he performs this review every week, most often when markets are closed (0:16), and that the value comes from repetition and archiving rather than from any single forecast being correct. That habit of writing the expectation down before the week resolves is the part of the lecture that transfers most easily to any trader’s own process, regardless of whether they use his terminology.
Related source video: The Week In The Life Cycle Of Price
The mapped source for this article is The Week In The Life Cycle Of Price on the channel The Inner Circle Trader, published 15 August 2026. This BestProps page is independent educational commentary: it is not a transcript, not an official ICT lesson, and not evidence that any weekly high, low, retracement or execution described in the recording occurred as narrated.
Watch the original video on YouTube
This video cannot be played inside another website: the embedded player itself reports “Playback on other websites has been disabled by the video owner.” That response was read from the player, so no player is reserved here and no embed is left blank. The full video is available directly on YouTube.
Sources for the weekly cycle, the replay tool and the funded-account limits
Four references support this article: the source recording; the charting help page for practising a weekly read without hindsight; and two BestProps rule pages that cite their own official firm sources for drawdown and consistency limits. All were reachable at the time of writing.
- The Week In The Life Cycle Of Price — the primary source recording from The Inner Circle Trader, published 15 August 2026. This article is based on an automatic transcription of its audio; the transcript is retained privately and is not published.
- TradingView: how do I turn Bar Replay on? — third-party platform documentation for stepping through a completed week bar by bar. TradingView is not affiliated with BestProps or with The Inner Circle Trader.
- BestProps drawdown rules — the loss limits that constrain how much room a weekly scenario can actually be given. Check the firm’s current rulebook before relying on any figure.
- BestProps consistency rule — explains why the distribution of results across trades can matter as much as the total.
Nothing here is investment advice. Where ICT describes his own chart, orders or results, those statements are attributed to him and are not independently verified.