Key takeaways
ICT’s 2025 Lecture Series SMC Midnight Opening Range lesson, uploaded January 8, 2025 and identified in the recording as the January 7 session, sets out a chart-marking framework built on the 12:00 a.m.
Read the full summary
ICT’s 2025 Lecture Series SMC Midnight Opening Range lesson, uploaded January 8, 2025 and identified in the recording as the January 7 session, sets out a chart-marking framework built on the 12:00 a.m. to 12:30 a.m. New York local-time window on one-minute charts, demonstrated first on Nasdaq futures and then on GBP/USD. Futures charts must be switched to electronic trading hours so the overnight session is visible, and charts are set to New York local time. He marks the midnight candle’s opening price, the highest high and the lowest low of that half-hour, and extends all three references through the London and New York sessions. Inside the range he looks for the price-delivery arrays he teaches — inefficiencies, order blocks, breakers, displacement — and grades the first presented displacement with its high and low, its midpoint (consequent encroachment), quadrant levels, and half-range and full-range projections that he calls one standard deviation rather than a statistical measure. Timing examples centre on 2:41 a.m., the 3:30 a.m. London “macro” and the 9:30 a.m. New York open, plus a GBP/USD move around 3:29–3:30 a.m. He says the levels work generally but not all the time, offers two narrated examples and no formal test, sample size or success rate, and the captions cannot verify fills, account ownership, slippage or performance — so treat the lesson as a chart-study exercise, not proof of algorithmic prediction or profitability.
How we researched this article
BestProps used document-based research from primary firm sources, checked September 14, 2026. The complete source list, scope, limitations, and commercial-state record appear near the end of this article.
ICT 2025 Midnight Opening Range Lesson
In this installment of his 2025 lecture series, ICT presents what he calls the midnight opening range: the range formed from 12:00 a.m. through 12:30 a.m. in New York local time. He walks through it on a one-minute Nasdaq futures chart and then repeats the exercise on GBP/USD.
The primary source is ICT’s video 2025 Lecture Series – SMC Midnight Opening Range, uploaded on 8 January 2025. At 0:12 he introduces the recording as the lecture for 7 January 2025, and at 0:18 names the topic as the midnight opening range. His claims about algorithmic delivery, precision and market behaviour are his own interpretations of price; the captions of one lecture cannot establish predictive power or trading performance.
How to build the midnight opening range
ICT begins the practical explanation at 12:30. His first instruction is to use a chart displaying electronic trading hours so the overnight session is visible (12:38), which he clarifies means the Globex or non-regular hours. At 14:29 he says charts should be set to New York local time wherever the student happens to live, because that is the clock the levels are built on.
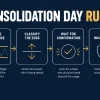
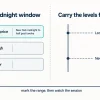
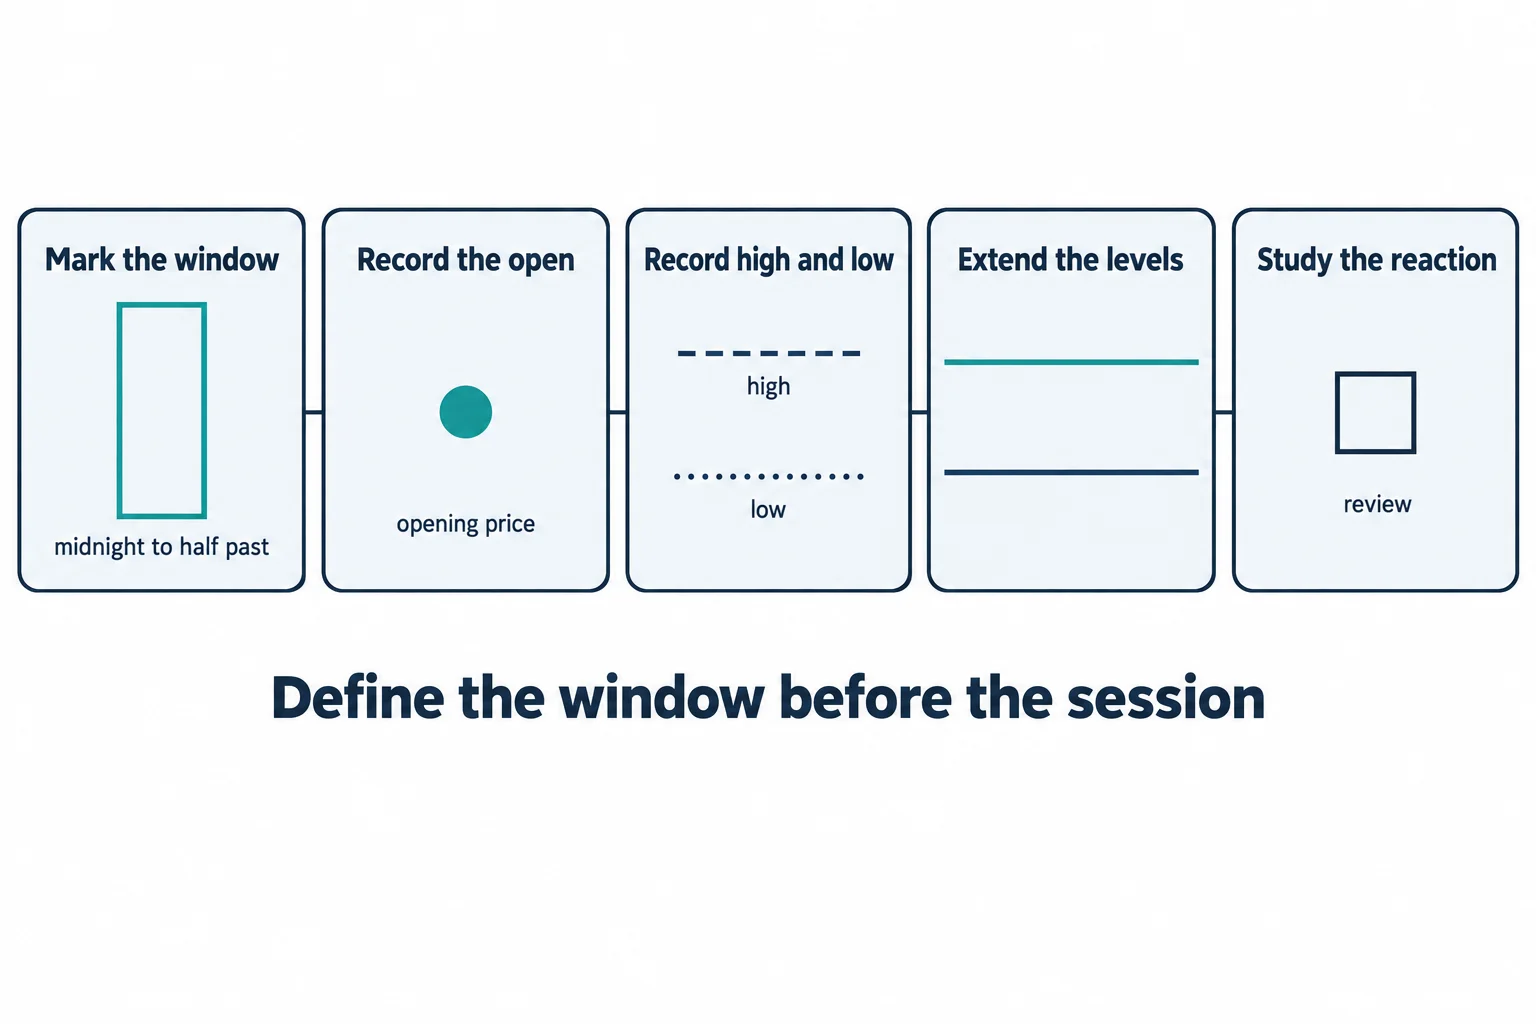
On a one-minute chart the routine is:
- Mark 12:00 a.m. New York time.
- Mark 12:30 a.m.
- Identify the highest high and the lowest low formed inside that interval.
- Record the opening price of the midnight candle.
- Extend those levels forward and observe how later price action interacts with them.
At 17:24 he names the three central references — the midnight opening price, the opening-range high and the opening-range low — and explains the opening price in relation to his “power three” daily candle formation at 18:45, where he describes power three as daily range candlestick formation rather than a separate indicator.
For textbooks, note a small looseness in the Forex half of the lecture: at 48:47 he says the student is getting three reference points there and then adds that a fourth can be added. The reading the captions actually support is an opening price plus the two boundaries of the half-hour range.
What ICT looks for inside the midnight range
The range is not presented as a standalone entry trigger. From 20:03 he says that in the drop from the range high to the range low he wants to see inefficiencies, order blocks, breakers and any of the price-delivery arrays he has taught, and he points students to the month-four material in his 2016 mentorship playlist for the vocabulary.
He then focuses on what he calls the first presented displacement inside the midnight range, named at 29:07, and grades it with:
- the area’s high and low;
- its midpoint, which he calls consequent encroachment;
- upper and lower quadrant levels;
- half-range and full-range projections.
Some automatically generated caption terms in the imbalance discussion are unclear — transcriptions resembling “CBI” or “Cy” appear while he is describing single-candle inefficiencies — so those abbreviations are left unexpanded here rather than guessed at.
Projections and session timing
From 23:41 he applies Fibonacci-style measurements to the range — negative half and full extensions — and uses them to frame how far a sweep above relative equal highs or a break lower might run (23:56). At 25:27 he defines his use of the term: taking the observed range from high to low and adding it to a boundary, which he describes as a measured move. In this lecture “one standard deviation” is his label for that projection, not a statistic — no distribution, sample or probability is calculated.
He also states the limit of the method at 26:36: the levels generally, though not always, deliver the kind of daily high or low he is looking for. No sample, test period or success rate is offered in the recording.
Time is treated as part of the setup. In the Nasdaq example he highlights 2:41 a.m. as the London open (34:24) and returns at 36:52 to the 3:30 a.m. New York “macro” he says he taught in earlier Forex material, urging students not to take his word for it but to check the old lectures themselves.
Midnight opening range: the Nasdaq walkthrough
In the Nasdaq portion he narrates historical chart movements against the midnight range, its midpoint, a displacement area and measured extensions. Around 39:40 he moves on to the 9:30 a.m. New York open and notes that a negative full-range projection of the midnight range had already been delivered by the electronic-hours session before the bell.
He then discusses an inversion fair value gap and the executions he says he took around it, from about 43:40 and again near 45:54, where he describes price returning to the midnight range’s consequent encroachment and to the midnight opening price before rolling over. The captions render that stretch of order narration roughly — “taking profit, selling short two more, then another quick recovery” — so what can be established is the sequence he describes, not the fills: the captions cannot verify order tickets, account ownership, slippage or the full outcome of the trades shown on a chart the reader cannot see.
Midnight opening range for GBP/USD
The Forex demonstration starts at 47:42, where he opens a GBP/USD one-minute chart on the broker feed he used when he taught Forex. He repeats the same construction — midnight, 12:30 a.m., the opening price and the range boundaries — and extends the levels through the day.
He then identifies an early displacement inside the range, compares it with its midpoint and with the midnight opening price, and projects the measured extensions. At 52:49 he points to a move around 3:29–3:30 a.m. as the timing relationship he wants students to study, tying it to the “sweet spot” he says he taught for the London session. Throughout, he treats liquidity resting above a prior high as a possible objective when projecting how far a move could extend — a projected destination, not a verified outcome.
How to apply the midnight range
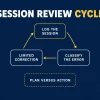
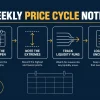
The reproducible part of the lecture is the marking exercise rather than the broader claim that markets are fully scripted. A student could mark the same half-hour New York-time window, record its open, high and low, extend those levels, and then observe how price behaves around them during London and New York hours — including the failures.
Keep observations separate from conclusions. A reaction at a plotted level does not by itself show that the level caused the move or that an algorithm predetermined it, and the lecture offers two narrated examples rather than controlled evidence. Treat the framework as a subject for chart study, not as a promise of precise forecasts or profitable trades.
Related ICT video: 2025 Lecture Series – SMC Midnight Opening Range
The mapped source lesson is 2025 Lecture Series – SMC Midnight Opening Range from The Inner Circle Trader. This BestProps article is independent educational commentary grounded in that recording’s captions: it is not a transcript, not an official ICT lesson, and not evidence that any entry, exit or result described in the recording occurred as reported.
Watch the original lesson on YouTube
This recording cannot be played inside another website. A test run from a BestProps page on 13 September 2026 loaded the YouTube player for this video and the player itself returned “Playback on other websites has been disabled by the video owner,” with no playback position and no media data, so no player is embedded here and no owner restriction beyond that message is asserted. You can watch the full lesson directly on YouTube.
Watch 2025 Lecture Series – SMC Midnight Opening Range on YouTube ↗
Reference material for this lesson
Three references support the practical side of this article: the exchange page that defines the product used in the futures example, the page that defines Globex session hours, and vendor documentation for replaying a session bar by bar.
Size from the exchange specification, not from memory
CME Group states that Micro E-mini Nasdaq-100 futures (MNQ) are smaller-sized versions of its benchmark E-mini contracts, and that the contract is $2 x the Nasdaq-100 Index with a minimum tick of 0.25 index points.[1] That is the reference for converting anything studied on a chart into a position you can actually size — the multiplier, tick minimum, margin requirements and trading hours are set by the exchange and can change, so verify the exact contract and month and then convert to account currency and to the maximum loss your plan and your firm’s rules allow.
Confirm the session clock at the exchange
CME Group publishes holiday and trading-hour schedules for CME Globex and its other venues, states that the schedule is subject to change and that holiday hours are usually finalised about two weeks before the holiday, and provides downloadable holiday calendars covering the 2026 and 2027 calendar years, with opening and closing times listed in the time zone each venue uses.[2] Since the whole exercise depends on a half-hour window defined in New York local time, and on an overnight session being visible at all, the venue, the product and the clock are worth checking rather than assuming.
Use replay to test whether the level was knowable
TradingView’s help page documents opening Bar Replay from the chart, choosing a starting point, stepping forward one bar at a time, adjusting speed, restarting from a different point, running replay across a multi-chart layout, and jumping back to live data.[3] It also lists limits that matter here: server-side alerts keep firing on real-time data and new ones cannot be created during replay, trading orders are executed against real-time data, non-standard chart types are incompatible with replay, and spread and tick-based charts do not work in it.
Used honestly, replay is how you test whether the midnight range and its projections were knowable before the move rather than only in hindsight. It cannot recreate the conditions of a live session, and it cannot verify what another trader executed.
Sources and tool documentation
- [1] CME Group: Micro E-mini Nasdaq-100 Futures Contract Specs
- [2] CME Group: Holiday and Trading Hours (CME Globex)
- [3] TradingView Help: How do I turn Bar Replay on?
BestProps is not affiliated with CME Group, TradingView or the Inner Circle Trader, and no source listed here endorses this article or any setup. Midnight opening range, inefficiency, order block, breaker, displacement, inversion fair value gap and consequent encroachment are used as descriptive study terms. Nothing on this page demonstrates a tested, repeatable or profitable result.