Key takeaways
ICT’s NQ Consolidation Day Algorithmic Rules In Action is a 64-minute recording uploaded to YouTube by The Inner Circle Trader on 2026-08-20, and it sets out one time rule.
Read the full summary
ICT’s NQ Consolidation Day Algorithmic Rules In Action is a 64-minute recording uploaded to YouTube by The Inner Circle Trader on 2026-08-20, and it sets out one time rule. When price trends directionally through the 7 to 9 a.m. New York premarket window, ICT expects the regular morning session, approximately 9:30 to 11:00 or 11:30, to consolidate rather than trend. He anchors that session on a daily low of 29,241.25 dated August 6, 2026, boxes the premarket high and low, and grades the range with equilibrium at its midpoint, premium above it, discount below it and octant subdivisions. Bodies rather than wicks carry the read at those levels, and he names the bearish version premium sensitivity and the bullish mirror discount sensitivity. He keeps the 9:30 opening price on the chart as a reference, watches the 10:50 to 11:10 macro into lunch for a rally into premium that draws in breakout buyers before the move lower, and reports entries at consequent encroachment and at an upper subdivision of an inefficiency. This article covers the spoken opening of the recording, roughly its first 17 minutes across 255 caption segments taken from automated speech recognition rather than a verified caption track, so the chart detail stays in the video and nothing here is a tested system, a verified fill or a performance claim.
How we researched this article
BestProps used document-based research from primary firm sources, checked September 14, 2026. The complete source list, scope, limitations, and commercial-state record appear near the end of this article.
NQ Consolidation Day Algorithmic Rules In Action is a recording from The Inner Circle Trader in which ICT works through one Nasdaq futures session using his own time-based and price-delivery framework. His central interpretation is that a directional move during the 7:00–9:00 a.m. New York premarket window warns him to expect consolidation during the regular morning session. He opens by saying he will get through the review as quickly as he can because the majority of the video is trade execution shown in real time, so viewers can study tape reading alongside it.
This article is grounded in what is actually said in the recording, not in the video title or in search results about it. The source is an automated speech-recognition transcript of the original audio rather than YouTube captions, so terminology and numbers can be misrecognised; the points where that matters are flagged below. The transcript’s 255 segments cover the spoken opening of the recording (roughly the first 17 minutes of a 64-minute video) while the later execution footage carries no transcribed commentary. A transcript also cannot verify chart detail, order placement, fills or results, and nothing here is a performance claim or investment advice.
The higher-time-frame reference
ICT starts on the daily chart rather than with an intraday pattern. He points to a low he dates to August 6, 2026 (0:43) and says he had already flagged relative equal lows between August 6 and 7 on the intraday charts before price traded down into that area. He gives the referenced daily low as 29,241.25 (1:12) and says everything in the session he is about to review hinges on that low being traded to at a specific time and in a specific manner.
That distinction runs through the whole lesson: the level is not treated as a signal by itself. ICT pairs it with a defined time window, the direction of the premarket range, and the behaviour of individual candles. Note too that the recording does not name its own session date. August 6 is a prior reference low, not the date of the session under review; the video is listed with an inventory upload date of 2026-08-20.
The 7:00–9:00 a.m. dealing range
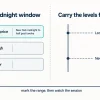
At 2:46 he defines the window he works with: 7:00 a.m. to 9:00 a.m. Eastern Time, New York local time. He marks the highest high and the lowest low inside those two vertical boundaries and derives the references he needs from that range (the premarket high and low, the midpoint he calls equilibrium, premium above the midpoint and discount below it, and further subdivisions he calls octants).

He states his consolidation-day rule at 4:09: when that two-hour window is trending, the algorithm will consolidate during the morning session. He describes the affected period approximately as 9:30 to 11:00 or 11:30, and says the odds of a difficult, chopping session rise when the directional premarket move also reaches a key level. In this case he says that condition was met, because price traded modestly below the August 6 low during the premarket window and closed out the window from there.
That is his stated market interpretation, not a law the recording demonstrates. No statistics, no sample of past sessions and no test is offered for how often the pattern repeats, so the rule should be treated as his framework rather than an established result.
How he read the session
After the premarket low, ICT describes a rally above the range midpoint, which puts price in what he calls premium (6:40). He then narrows in on candle bodies around an upper subdivision of the range. His reading is that the bodies failed to establish themselves through that subdivision while price sat in premium, which he treats as resistance to further upside delivery. The transcript gives that subdivision as both “0.625” and “0.65”, so the exact measurement is ambiguous in the audio and should be read off the chart in the video; the transferable part is that he watches body behaviour, not only wicks, at subdivisions of the 7:00–9:00 range.
When price breaks lower, he does not present that as something to chase. He says that on an anticipated consolidation day he waits for traps (8:38) and keeps a soft bias toward lower prices, on the reasoning that the earlier test of the August 6 low was shallow and may have left unfinished business below. He keeps the 9:30 opening price on the chart as a reference for judging behaviour (9:19) and describes price repeatedly working around that level rather than trending away from it.
The 10:50–11:10 macro into lunch
He next marks a 10:50–11:10 window, which he calls a macro leading into lunch, and explains at 10:00 what he wants from it: a rally up into premium and through nearby relative equal highs that can knock out traders who are short, before the move lower he is looking for. He describes such a rally running into the macro and drawing in breakout buyers whose stops sit just below the low.
He then walks through the sequence he was watching, a return to the opening price, a bounce, a push into an inefficiency, and candle bodies that supported one part of that array without overcoming the earlier premium reference. In his framework that behaviour supported the lower scenario. These remain his readings of a chart that the transcript cannot show: the boundaries of the arrays he names cannot be independently reconstructed from the spoken text.
Candle bodies, wicks and inefficiencies
From 12:07 he develops the difference between wicks and bodies. In the bearish context he describes, wicks are allowed to probe into an inefficiency while the bodies stay in the lower half of the array, which he calls premium sensitivity (12:46); the bullish mirror of that, where bodies hold the upper half, he calls discount sensitivity. He treats that body behaviour as the visible mark of what he calls coded, algorithmic price delivery.
His vocabulary in this section also includes an inversion fair value gap (13:06), consequent encroachment, and an “event horizon” level taken from the midpoint between two lows (11:36). These are terms from his own methodology, used here to describe one session; the transcript cannot verify them or let a reader reconstruct the arrays. One phrase transcribed near 9:14, rendered as something like “side of balance, buy side efficiency”, is not resolvable from the audio alone, so no meaning is assigned to it in this article.
What the execution footage does and does not establish
Toward the end of the spoken section he notes that he published a sped-up version of the execution on X and that the slowed-down footage follows in the video (14:44). He describes entries taken at consequent encroachment (14:10) and at the upper subdivision of an inefficiency, with the position added to on a retest (14:22). Those are his reported actions. The transcript cannot confirm the fills, the size, the exits or the outcome, this article makes no claim about profitability, and the later execution footage carries no transcribed commentary to check anything against.
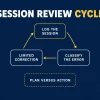
What the spoken portion does support is the process behind the entries: mark a time-bounded range, decide whether it was directional, note whether it reached a higher-time-frame reference, and then look for a liquidity run or trap rather than treating every breakout as continuation.
Practical checklist from the lesson
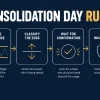
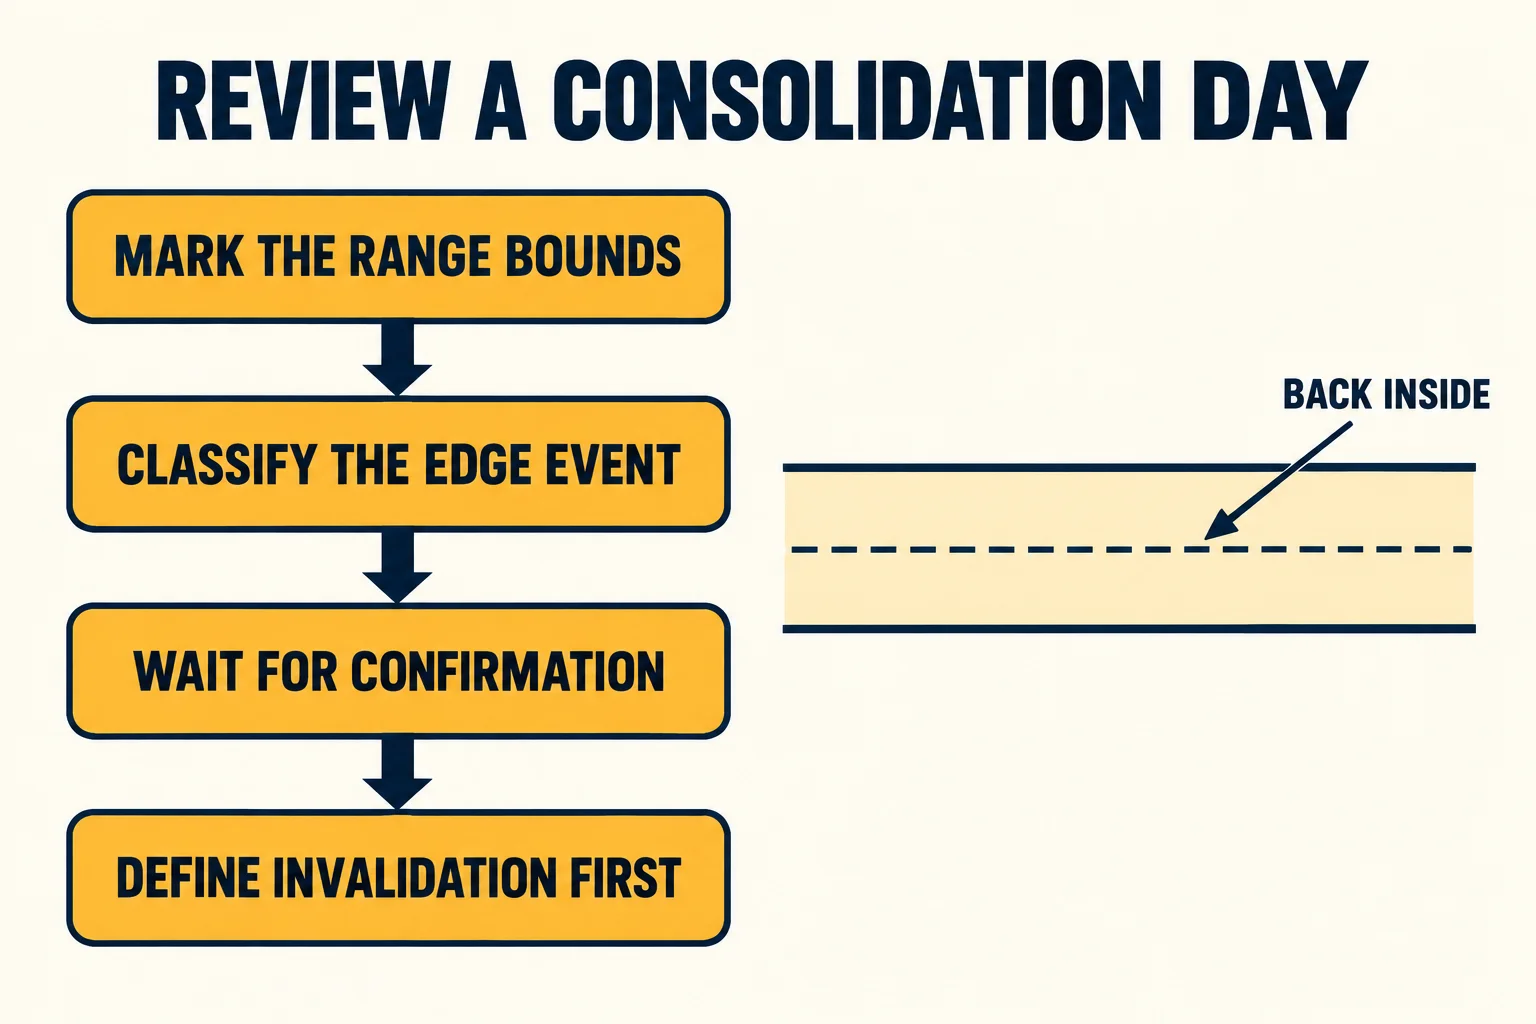
The usable takeaway is a review sequence, not a signal:
- Mark the 7:00–9:00 a.m. New York high and low.
- Decide whether that interval was directional or balanced.
- Note whether it reached a meaningful higher-time-frame reference, such as a prior daily low.
- If it trended into an objective, expect the regular morning session to be prone to consolidation, and be slower to trust breakouts.
- Keep equilibrium, the 9:30 opening price and nearby equal highs or lows on the chart as reference points.
- Watch body behaviour, not only wicks, where price meets a defined array.
- Inside consolidation, wait for a time-based liquidity run or trap instead of assuming continuation.
None of that is a tested system. The recording offers one session read through one framework, the source is a machine transcript of the audio, and the chart detail remains in the video rather than in the text.
Watch the original lesson
The article’s source is the recording NQ Consolidation Day Algorithmic Rules In Action. The timestamp links above open the relevant moments. The transcript was taken from the audio of this upload; it is speech recognition, not a verified caption track, and it covers only the spoken opening of the recording.
Watch the original lesson on YouTube
This video cannot be played inside another website. When its embedded player was loaded and clicked on 14 September 2026, the player itself reported “Playback on other websites has been disabled by the video owner.” and settled on a “Watch on YouTube” prompt, with no playback progressing. That is why no player is embedded or left blank here; the recording is available directly on YouTube.
Watch NQ Consolidation Day Algorithmic Rules In Action on YouTube ↗
Related sources and tools
- The original Inner Circle Trader recording: the primary source for everything above. Use the timestamp links to compare each point with what was said.
- CME Group holiday and trading hours: the exchange’s own page for its session and holiday schedule, which is where the current Globex clock should be confirmed rather than assumed from a video.
- TradingView support: how to turn Bar Replay on: documentation for stepping through a past session without hindsight, useful for re-checking the levels a lecture refers to.
- ICT Archivist entry, 2026-08-20: an unofficial third-party summary of the same recording. It is machine-written by an unaffiliated archive, is not reviewed here, and should not be treated as the lesson itself or as an official Inner Circle Trader publication.
This is independent educational commentary. It is not official ICT material, not a tested trading system, and not evidence that any reading, entry or outcome described in the recording can be reproduced. Futures trading carries substantial risk.