
Key takeaways
In How To Engage Price After Holiday Volume Days, ICT reviews the index-futures session immediately after Labor Day and argues that the first day back deserves reduced commitment rather than normal size: he starts with one contract and, in that morning’s walkthrough, trades a simulated account.
Read the full summary
In How To Engage Price After Holiday Volume Days, ICT reviews the index-futures session immediately after Labor Day and argues that the first day back deserves reduced commitment rather than normal size: he starts with one contract and, in that morning’s walkthrough, trades a simulated account. He reads a roughly 100-handle premium opening gap alongside the prior Friday’s first presented fair value gap, then watches whether candle bodies accept or reject the midpoint of a volume-imbalanced area he calls a suspension block. When price kept holding the lower half of that area, his expectation turned down toward the weekly opening gap, and he describes paying himself partial profits as new lows formed. He then revisits executions from the overnight session inside the earlier Friday’s fair value gap, reporting a small adverse excursion on three contracts. The captions support his stated reasoning and reported activity; they do not verify fills, levels, net results or the cause of any move.
How we researched this article
BestProps used document-based research from primary firm sources, checked September 13, 2026. The complete source list, scope, limitations, and commercial-state record appear near the end of this article.
The recording is a session review rather than a standalone strategy, and it is best read that way. Because the only source used here is the video’s automatically generated caption track, this article paraphrases what the speaker says and reports; it does not independently verify chart levels, order placements or outcomes, and none of it is investment advice. Terms that the caption track appears to have misrecognised are flagged where they occur.
Why the first session back gets reduced size
ICT states the principle within the first minutes: after a holiday he likes to begin with a single contract to test conditions (4:03). He also discloses that the morning demonstration is being conducted in paper trading, so the viewer is not watching a funded account being risked. The purpose he gives is alignment rather than profit — either he is onside or offside with his initial expectation, and the session is what tells him which (4:21).

He returns to the same question at 7:17, explaining why he would use simulated trading on a day he could trade live. His reasoning is that the first session back can behave unpredictably, that normal post-holiday volume can start slowly, and that participants coming back from a break may be reluctant to move price much. He frames the alternative bluntly — he does not want to throw good money after a gamble — and says he would rather let the market work out its kinks while he keeps a finger on the pulse (8:07).
He restates it at the end as the rule of thumb he wants remembered: after the holidays, go in light, even if that means paper trading, simply to get a feel for price action (15:57). He adds that there is no need to rush back to capture money on the first day and that the rest of the week offers other sessions, then says the exercise is less about the money than about getting in sync with price action instead of forcing a will (16:17).
The reference structures he used that morning
At the opening bell he describes roughly a 100-handle premium gap opening (0:12) and says the key level he was using was the prior Friday’s first presented fair value gap (0:21). He marks the full gap and divides it, pointing out the half-gap or midpoint (0:36), and says the question is whether price has any reason to want to move down into that area (0:57).
While teaching, he sketches a hypothetical order placed in a wick, with the stop set just above the second wick high rather than at the first (1:25). His stated objective is the sell-side liquidity resting inside that wick (2:40). He notes volume imbalance at both ends of the area and labels it a suspension block (2:50); that label comes from the caption track, which is machine-generated and never defines it, so the exact term should be treated as approximate. He goes on to describe treating the same area as a discount array (3:15). He also compares the two index futures he follows, saying Nasdaq was the softer of the two at that point (3:41).
How the opening sequence played out
After switching the chart into replay, he apologises that his executions were not displayed (6:02), then recaps the sequence as he reads it: price ran buy-side first, opened at a premium at 9:30, pulled down through roughly half the gap, and then met a sell-side liquidity pool and the suspension block, with full gap closure and the new week opening gap beneath (6:21). He says that, but for the holiday, he would have been aiming at the new week opening gap high, and that on this day he mainly wanted a pulse on what the market was doing (6:48).
Candle bodies rather than wicks at the midpoint
His more detailed observation concerns how closes behaved relative to the midpoint of the suspension block. He notes that candle bodies did not touch, on a closing basis, the midpoint of that area and stayed in the upper half, and he treats that placement as information about which side price was being drawn toward (8:52). In his framework, a close above the consequent encroachment of the sell-side imbalance would make a return toward the 9:30 opening price reasonable, with the prior Friday’s first presented fair value gap as a further reference above (9:09). The caption track renders that phrase as “consequent encouragement”; the recognised ICT term is consequent encroachment, and the transcript itself does not spell the acronym for the imbalance it qualifies.
Later he says he liked how heavy price became once it entered the lower half of the zone, and that while it stayed there he did not want to see a trade back above the level. That, in his reading, made another leg down toward the week’s new week opening gap high unsurprising (9:39). He applies the same rule to the morning at the end of the recording: price reached the half-gap quickly, the upper half of the imbalance was never traded to or even tested, and he treats that as premium sensitivity arguing against further upside (16:49).
Stops, partials and what he calls running down equity
For an open position he describes resting the stop just above the most recent high and treating the creation of a new low as a reasonable place to take a partial (10:09). He adds that if the position is large enough to warrant it, taking something off below a cleared low is a good idea (10:22). His phrase for the habit is running down equity — realising increases in the balance as the move develops rather than requiring the whole position to reach one terminal target (10:45). He presents it as a way to keep getting paid while a model is still being developed, not as a mechanical rule (11:11).
The overnight executions he shows from the previous night
Roughly two thirds into the recording ICT reviews work he says he did in the Asia session the night before (11:39). In his account, price had dropped into the new week opening gap for the current week and the candle bodies showed no interest in exploring lower; after a candle opened at the level and rallied, he describes discount sensitivity being used to trade back up into the Friday, August 28 first presented fair value gap, followed by a retracement (12:30). He says he elected to use the earlier highs as the draw.
He then shows entries inside that Friday fair value gap with the stop placed just beneath a candlestick’s low (13:05). By his account price came close to the stop without reaching it, which he describes as carrying a little bit of heat, and he reports the adverse excursion as about 10 handles — adding that it may have been 20 — on three contracts, which he calls insignificant (13:42). The captions also contain a figure he gives for the entry itself; it does not reconcile with an index price in the surrounding speech, so this article does not repeat it as a level.
He says price then rallied through the earlier highs and went a little beyond them, later came back through the same smooth area he had pointed out, and sold off around 12:46 a.m., returning to the new week opening gap and then to Thursday’s first presented fair value gap (14:22). He closes the review by pointing out lows being taken out and calls it “not bad for a day back from hollow volume on Labor Day” (14:48). That Labor Day reference is what places the session; the inventory dates this video September 8, 2026, the day after the 2026 Labor Day holiday, which is consistent with the spoken reference even though the captions alone cannot fix the exact recording time.
Reading the close of the lesson
At 16:59 he notes that price sold off beyond the bounds of what he was looking for, “just to have something profitable”, and says a low was simply taken out. In his final annotation he then returns to the mechanism from two angles: at 15:09 he points out the portion of the range he did not want traded to, or even tested, was not reached, and at 15:26 he observes that bodies stayed in the lower half even of the part price did reach, reading that as premium sensitivity that made further upside unlikely — after which, he says, the candles ran lower as he had expected. Asked at the end whether there were questions, his student answers no, and the recording closes (17:23).
What this lesson does and does not establish
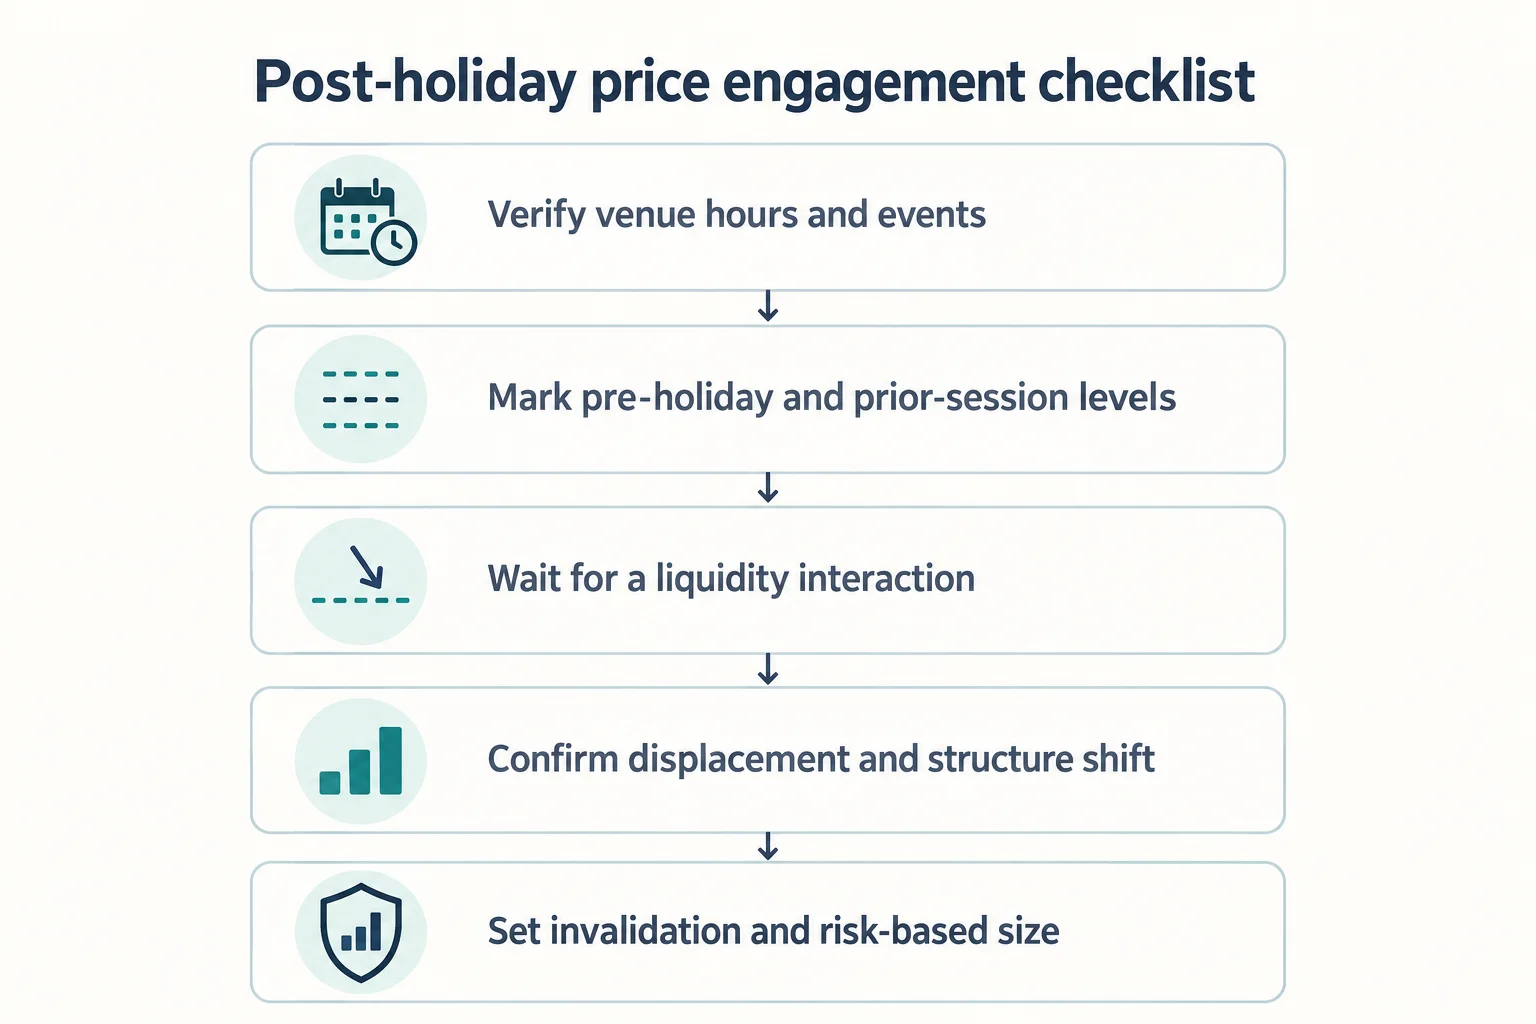
What the captions support is the speaker’s process and his stated reasoning: reduce commitment when participation may be atypical, define the reference levels before the session, wait for the level to be engaged instead of guessing, judge acceptance with candle bodies rather than wicks, and take partials as the move develops. What they cannot establish is performance. The morning walkthrough is disclosed as paper trading, the overnight review is a chart reconstruction shown after the fact, and no fills, costs, account statements or net results are available to check. Handles, the number of contracts and the reported excursion are his figures as captured by speech-to-text.
The evidence also does not show why price moved. ICT offers his own reading of liquidity and imbalance, and that reading is the subject of the lesson rather than a demonstrated cause. Nor does one post-holiday session support a general rule that holiday or post-holiday markets must behave in a particular way: the video illustrates a way of organising attention on a specific day, and it should be treated as such.
FAQ
Does this video prove that sessions after a holiday are always thin?
No. The speaker describes a slow start to normal post-holiday volume and refers to hollow volume on Labor Day as his description of one session. The caption track contains no volume measurements, so it neither proves nor disproves a general pattern of thin holiday trade.
Why use paper trading instead of a live account after a holiday?
In his own explanation, the first session back is a chance to test whether his reading aligns with price while conditions may still be irregular. He starts with one contract and, in this recording, with a simulated account, and he says the objective is a feel for price action rather than money on the first day back.
Was the trade shown in the video profitable?
That cannot be established from the transcript. He describes an entry inside a fair value gap, a stop that was approached but not hit, a reported excursion of roughly 10 to 20 handles on three contracts, and partial exits as new lows formed, but fills, costs and net results are not verifiable from captions and no account statement is shown.
Can the same approach be applied to other products?
He demonstrates it on index futures and compares Nasdaq with ES. Session definitions, holiday calendars and opening times differ by product and venue, so the sequence has to be rebuilt for the instrument being traded rather than copied across.
Related ICT video: How To Engage Price After Holiday Volume Days
The mapped source lesson is How To Engage Price After Holiday Volume Days from The Inner Circle Trader. This BestProps article is source-grounded educational commentary on that session and the reasoning presented in it; it is not an official ICT lesson, not a verbatim summary, and not a recommendation to copy any trade.
Watch the original lesson on YouTube
This video cannot be played inside another website: the embed shows “Playback on other websites has been disabled by the video owner.” You can watch the full lesson directly on YouTube.
Watch How To Engage Price After Holiday Volume Days on YouTube ↗
Tools and further reading for post-holiday sessions
Holiday schedules and event calendars are published by the venue or the agency that owns the event, and they change. Check the primary calendar for the session you are about to trade instead of relying on a remembered pattern.
Venue closures and early closes: Nasdaq Trader’s U.S. market calendar
Nasdaq Trader's U.S. Equity and Options Markets Holiday Schedule 2026 lists the full-market closures and the early closes for that year, including 1:00 p.m. early closes on November 27, 2026 and December 24, 2026 in that published schedule.[1]
Use it as an example of how a venue documents its own hours. It covers Nasdaq's U.S. equity and options markets, not futures: an index futures contract keeps the hours and holiday schedule of the exchange that lists it. Confirm the schedule for the product you actually trade rather than importing an equity calendar.
Seeing where one session ends and the next begins
TradingView's help note on session-break lines states that blue vertical lines on an intraday chart indicate session breaks and that their display can be turned off in the chart's Events settings.[2]
That is a charting convenience, not an analysis tool. If the session breaks shown on your chart do not match the pre-holiday, holiday, overnight and first regular sessions you intend to separate, the levels you mark will be grouped incorrectly. Check the chart's session template and time zone before you label anything.
Scheduled events that can override holiday volume
The Federal Reserve's FOMC meeting calendar publishes the scheduled meeting dates for each year; the 2026 calendar lists meetings such as January 27-28, 2026 and March 17-18, 2026, with statements and press conferences on the second day.[3]
A thin, low-participation day is not the only source of an outsized move. A scheduled release or press conference can produce the same conditions on an ordinary day. Check the event calendar for the session you plan to trade and decide in advance whether your plan allows engagement around it.
Sources and primary calendars
- [1] Nasdaq Trader: U.S. Equity and Options Markets Holiday Schedule 2026
- [2] TradingView: I cannot remove blue vertical lines on my chart (session breaks)
- [3] Federal Reserve Board: FOMC meeting calendar
BestProps is not affiliated with Nasdaq, TradingView or the Federal Reserve Board, and none of these sources endorses this article or any trading approach. Third-party platform behaviour and calendar pages can change; verify them yourself before relying on them.





