
How we researched this article
BestProps used document-based research from primary firm sources, checked September 14, 2026. The complete source list, scope, limitations, and commercial-state record appear near the end of this article.
“Post PPI NQ Futures Commentary Weekly Analysis Delivered – 07/15/2026” is a 27-minute recording published by The Inner Circle Trader on Wednesday, July 15, 2026. In it, ICT reviews his own guidance for trading NQ around that morning’s 8:30 a.m. Producer Price Index release, explains the two conditional paths he says he gave beforehand, and narrates how he built and managed a short position after the release. This page is a transcript-grounded review: the audio was transcribed in full, the transcript duration matches the video, and each point below is tied to the timestamp where it is said. The opening of the recording contains about a minute of silence before he begins.
Two limits matter here more than usual. The recording is a narration of a session, not a verified record: no order tickets, fills, position sizes, account statements or chart screenshots are available in an audio transcript, and several price levels are recognition-uncertain. Everything ICT describes about his entries, partial exits and the week’s result is therefore attributed to him rather than presented as performance verified from account statements or trade records.
The two paths he says he gave before the release
ICT opens by reminding viewers of guidance he says he gave earlier that morning, and the substance of it is conditional. Because the PPI number was due at 8:30 a.m., he says he gave two parameters rather than a single direction, on the logic that whichever area price reached first would act as the counterparty to the other (1:15, 1:31, 1:40). The two routes were a decline to a lower area followed by a push into the New Week Opening Gap, or a move into that gap first and then a decline into the lower area (1:49, 1:56). He says he had more interest in the lower route because the price action above it looked weak (2:02).
He illustrates that weakness with an analogy rather than a measurement: a large structure of price action held up by one narrow piece of support, which he compares to a building resting on a single two-by-four, and concludes it was likely to be revisited (2:20, 2:44). He also says sell-side liquidity was resting below the prior lows (2:53). He then states plainly that he had family commitments that day, could not stay with the idea while it developed, and simply used the parameters he had given (3:14, 3:22).
He refers repeatedly to other recordings for those levels — the lectures from Monday and Tuesday, and a shorter review video from that morning — which are separate uploads and not part of the source reviewed here (4:27, 12:12).
What he says happened at 8:30, and the level that mattered
The central reference in his reading is the New Week Opening Gap. He calls its midpoint “consequent encroachment” and says his interest was in seeing the 8:30 release used as a Judas swing — an initial move that takes liquidity before reversing (3:42, 3:52). In the version he preferred, a drop into the lower area would have been the Judas swing up into the gap and then a lower run; in the version that unfolded, he says price rallied on the release and never reached the gap’s midpoint, which he treats as confirmation for the bearish side of his plan (4:03, 4:08, 4:20).
He describes the post-release advance as “staging”: price runs up, creates a short-term high, that liquidity is taken, and the highs become counterparties for shorts because buy stops sit above them (4:42, 4:50, 5:05, 5:17). That is his market model. The transcript contains no order-flow, positioning or depth data, so the claim that specific stops were absorbed by larger sellers cannot be verified from this source.
The part of the recording with the broadest value
Immediately after describing that model, ICT asks the obvious question — how do you know price will not simply continue higher — and answers it against himself: “You aren’t going to know. That’s why you have to use a stop loss. That’s why you don’t over leverage” (5:54, 6:01, 6:06). He follows it with the same admission in stronger form later: nobody knows where an inflation release will take price initially, and he says he has been wrong more often than right when trying to predict the first move off these reports, after 33 years of trading (11:26, 11:40).

The process he puts in place of prediction is a set of pre-written conditions: if price does one thing he does that, and if it does the other he does the alternative (9:55, 10:02, 10:09). He also states that waiting for the reaction instead of pre-committing to a direction is the practical response to that uncertainty, and that his tool list is nothing more than open, high, low, close and the time axis, with experience being the rest (11:56, 8:53, 9:17).
Where he wanted to be short, and why below the midpoint
His stated plan was to build shorts inside the lower part of the New Week Opening Gap, between its lower quadrant and an upper subdivision, deliberately short of the halfway point (8:17, 8:26, 8:33). His reasoning is his own order-flow rule: if the market is bearish, selling in the lower half is what denies price the ability to trespass through the upper half with closing bodies (13:15, 13:34). He adds that because the week’s upside objective had already been met on Monday’s analysis, he was finished being interested in the bullish side, while explicitly refusing to claim a top or that price could not go higher (13:44, 14:00, 14:06).
How this review separates the plan from the reaction
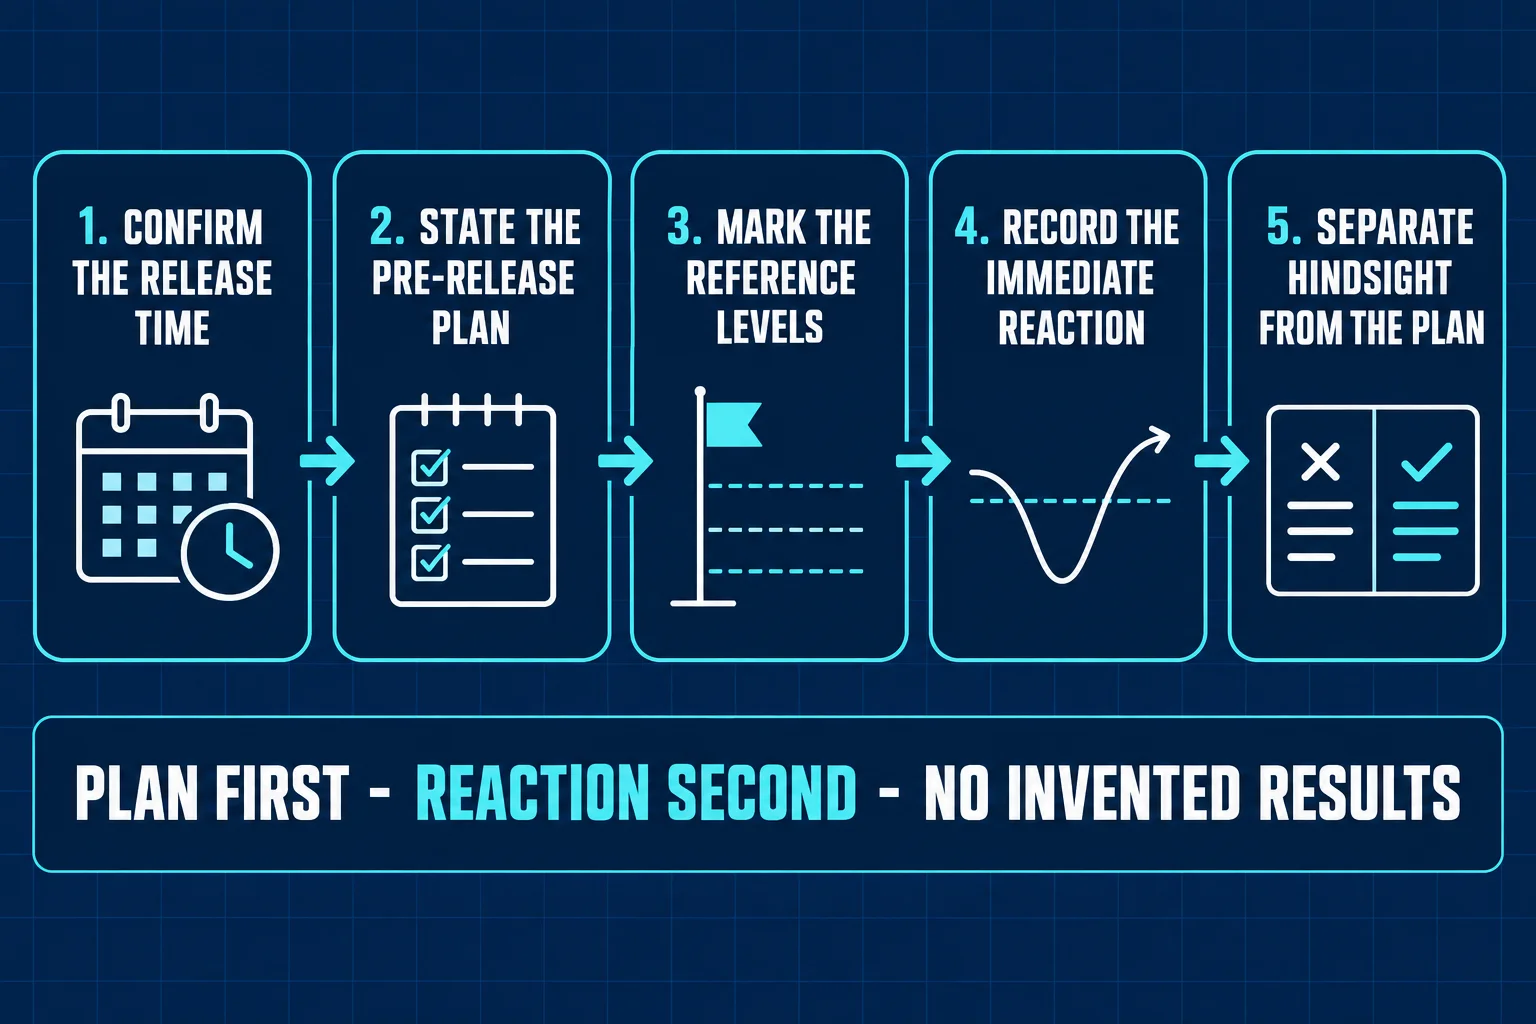
A news-day recording is easy to read backwards, so the structure used here keeps the two halves apart: establish the scheduled release time from the release calendar rather than from the video, restate the plan as it was given before the release, mark the levels he refers to, record what he says happened afterwards, and keep hindsight out of the original plan. The schematic below draws that order. It is a review method, not something ICT teaches in the recording.
The execution he narrates
From about 12:56 onwards, ICT narrates building a short position inside that lower portion of the gap and adding to it as swing highs formed, describing the process as pyramiding into what he expected to be a retail-buying trap (14:37, 14:57). He says price traded to his stop price but that the spread and the pairing of orders did not permit the execution, a piece of luck he calls “mercy” (15:11, 15:18, 15:31).
He then walks through the lower-time-frame references he was trading against — what he calls an inversion fair value gap, the 9:30 whiplash, a bearish suspension block, and reactions from the gap’s subdivisions where he says price stopped to the tick (16:03, 16:15, 16:45, 17:04). Some of the numbers he reads off the chart in this section come through the automated transcript inconsistently, so no price level is reproduced here; the structure is what can be reported reliably.
The management he describes is incremental: a small partial below a short-term low, another partial lower, and one contract taken off simply because he had started to feel concern about the trade — his stated remedy for discomfort being either to reduce or to exit rather than to sit with it (17:56, 18:01, 18:10, 18:25). He says he reduced the position to 14 of 16 contracts before leaving for the day, with the limit order sitting just below the single candle he had identified as the only support, and that price then continued into the previous day’s fair value gap, that inefficiency and a daily volume imbalance (19:26, 19:32, 19:50, 20:12, 20:49).
None of that is verifiable from the source: a transcript cannot show the position, the fills, the partials or the account, and the recording contains no statement of a net result. Treat the whole sequence as the speaker’s account of his own trading.
His closing assessment of the week
ICT says the daily imbalance suggested a little more weakness ahead, but states he is personally finished executing for the week, that he did well for the week, and that he will go back to teaching lectures for the remaining days (21:21, 21:30, 21:37). He then challenges anyone who thinks the material is rebranded: they are invited to find a supposedly better trader who calls moves in public and executes near the highs as he says he does (21:50, 22:02, 22:12). That is a claim about his own record; the earlier predictions it refers to are in other videos and no verified performance data appears in this source.
The last substantive part is about how long the skill takes. He tells students not to be discouraged that they cannot yet read these setups, says the level of precision shown takes roughly five to ten years, argues that watching videos is not the same as learning to execute — his comparison is watching basketball and expecting to dunk — and states that personal responsibility and self-control are the central requirements, and the only subject on which he will speak in absolutes (22:20, 23:10, 23:25, 24:00, 24:13, 24:52). The tone through the middle of the video is combative in places, including remarks aimed at viewers who question the record.
He closes by saying where he would have exited if he had been able to stay with the trade — the level discussed the previous day — notes that he was ultimately stopped on the final portion, and says he may post a premarket analysis for Thursday or Friday if his schedule allows, otherwise a teaching lecture, before signing off (25:53, 25:58, 26:51, 27:23).
What the recording establishes, and what it does not
Established by the source: the two conditional paths he says he gave before the 8:30 release, his preference for the lower route, the New Week Opening Gap midpoint as the level that would have invalidated the bearish read, the plan to sell within the lower portion of the gap, the incremental management he describes, and his own statement that the initial direction of an inflation release cannot be predicted and that he has been wrong more often than right on it.
Not established: any fill, partial, size, stop or net result, because none exists in an audio transcript without account proof; the claim that buy stops above short-term highs were absorbed by larger sellers; the exact price levels he reads from the chart, several of which the automated transcript renders inconsistently; and anything about the prior Monday and Tuesday videos whose levels this recording assumes the viewer already has.
Related source video: Post PPI NQ Futures Commentary Weekly Analysis Delivered – 07/15/2026
The mapped source for this article is Post PPI NQ Futures Commentary Weekly Analysis Delivered – 07/15/2026 on the channel The Inner Circle Trader, published Wednesday, July 15, 2026, with a stated length of 27:27 and about a minute of silence before the commentary starts. Its embedded player was tested from a BestProps page origin on 2026-09-14 and refused playback on third-party sites, so a watch card is used here instead of a blank or unplayable player area. BestProps is independent educational commentary: this page is not a transcript of record, not an official ICT lesson, and not endorsed by the channel.
Watch the original recording on YouTube
This recording cannot be played inside another website: the embedded player itself reports “Playback on other websites has been disabled by the video owner.” That response was read from the player on 2026-09-14 from a BestProps page origin, so no player area is reserved here and no embed is left blank. The recording remains available directly on YouTube.
Official sources for the PPI release and its timing
Three pages on the U.S. Bureau of Labor Statistics site were read on 2026-09-14 for this review: the PPI program home page, the release calendar, and a published news release. None of them reports a market reaction, an NQ price or anything about the recording, and none endorses any setup.
What the PPI measures, in the agency’s own words
The program’s home page states that “The Producer Price Index (PPI) program measures the average change over time in the selling prices received by domestic producers for their output,” and notes that the prices come from the first commercial transaction for many products and some services.[2] That is the statistic the video is trading around; it says nothing about how a release will move a futures market.
The 8:30 a.m. ET publication time is set in advance
The BLS release calendar lists a PPI publication on July 15, 2026 at 8:30 a.m. ET, and the next scheduled releases also carry that time.[3] A published release confirms the convention: its header reads “embargoed until 8:30 a.m. (ET)”.[4] Treating the clock as a fixed input and the market’s reaction as unknown is the whole reason a pre-written set of conditions is useful — and it is also why the release time should be read from the calendar rather than inferred from a video.
Sources
- [1] YouTube: Post PPI NQ Futures Commentary Weekly Analysis Delivered – 07/15/2026 – The Inner Circle Trader (primary source recording; published Wednesday 15 July 2026, 27:27; audio transcribed in full for this review; embed refused by the player 2026-09-14)
- [2] U.S. Bureau of Labor Statistics: Producer Price Index program home (definition of the PPI and its first-commercial-transaction basis; read 2026-09-14)
- [3] U.S. Bureau of Labor Statistics: PPI release schedule (lists the PPI release on 15 July 2026 at 8:30 a.m. ET and subsequent 8:30 a.m. ET dates; read 2026-09-14)
- [4] U.S. Bureau of Labor Statistics: Producer Price Index news release summary (header states the release is embargoed until 8:30 a.m. ET; read 2026-09-14)
BestProps is not affiliated with The Inner Circle Trader, the U.S. Bureau of Labor Statistics or YouTube, and no source listed here endorses this article, this site or any setup. Terms such as New Week Opening Gap, consequent encroachment, Judas swing, fair value gap, suspension block, octant, inefficiency and draw on liquidity are used on this page only as they appear in the recording. Nothing here demonstrates a tested, repeatable or profitable result; the trading described is the speaker’s own account, and no claim is made that a news release can be predicted or that any setup was verified on a live account.
This material is educational and general in nature. Futures trading involves substantial risk, and commentary, chart concepts or reported trades do not guarantee results. It is not individualized financial advice.





