
Key takeaways
In NQ Trade Review Jackson Hole Symposium Day #2, ICT reviews Nasdaq futures price action on the second day of the 2026 Jackson Hole Symposium week and walks through the trade he took around it.
Read the full summary
In NQ Trade Review Jackson Hole Symposium Day #2, ICT reviews Nasdaq futures price action on the second day of the 2026 Jackson Hole Symposium week and walks through the trade he took around it. He anchors a Fibonacci projection to an early-session range, treats an opening displacement as a candidate inversion fair value gap rather than calling it a first-presented gap, watches where candle bodies sit relative to that imbalance and to a prior Thursday wick, and exits some of the position before a scheduled 10:00 a.m. central-bank speech. He then reports that the speech sent price lower through a reclaimed bearish fair value gap, back into the Thursday wick, and that the session later rallied through a 29,757.25 level he had flagged in an earlier video before running out of steam. Most of the recording is not trade mechanics at all: it is his case for treating Jackson Hole week and similar event weeks as conditions to study, not occasions to over-leverage, and for taking the weekend off when the week is already profitable. The captions support his narrative and his stated reasoning; they do not authenticate the account, the fills or the levels on his chart.
How we researched this article
BestProps used document-based research from primary firm sources, checked September 14, 2026. The complete source list, scope, limitations, and commercial-state record appear near the end of this article.
This is a session review plus a study-plan talk, and it should be read that way. The only source used here is the video’s automatically generated caption track, so this article paraphrases what the speaker says and reports. Quoted prices come from those captions and may contain recognition errors, and the chart itself is not available here. Nothing below is investment advice, and no trade described is a recommendation to copy.
What he shows before the analysis
ICT opens by identifying the session as day two of the Jackson Hole Symposium and says he wants to get the execution question out of the way first (0:02). He displays what he describes as yesterday’s and today’s trades on the chart and says the display itself shows the activity is not market replay, because executions do not appear when replay is active (0:20, 0:37). That is his assertion about his own platform and account; the captions cannot authenticate the orders, the account, or the fills, and this article does not treat it as verified.
The range and projection he worked from
He asks viewers to consider the range that formed between 7:00 in the morning and shortly afterwards (0:57). He then defines the extremes deliberately, ruling out a high that sits outside the range and saying there is no fitting the range after the fact (1:31). The captions give the low as 29,597.50 and the high as 29,665 (1:51, 2:07).
He anchors a Fibonacci tool to that range and observes that the projection lines up with the low of the first leg down — the point at which he entered (2:21, 2:31). He says he took the risk of trading it knowing that what he calls seek-and-destroy conditions were likely — his label for a session that takes out the previous buy side and sell side in turn rather than delivering in one direction (2:37).
His stated destination was a prior reference: the upper half of a discount wick he dates to Thursday at 9:55 a.m. Eastern, an area he says he had discussed in the previous video and that price used again here, with candle bodies stopping at a level while the wick reached into the lower half of it (3:01, 3:23).
The inversion fair value gap he graded
The technical core of the review is a single decision. ICT points to a displacement lower at 9:30 and calls the result a sell-side imbalance, buy-side inefficiency, adding that he is not treating it as a first-presented fair value gap. Instead he grades it as a candidate inversion fair value gap and waits to see whether later price action qualifies it (4:40).
He then describes the sequence he expected once the Fibonacci low projection had been reached — price dipping a tick or two through it, then working back up to take buy-side liquidity, trade into the inefficiency above and reach for relative equal highs (5:07, 5:26). In the replay he shows the gap being traded above and qualified, price returning, and candle bodies holding at half of that inversion gap before the move into the overhead inefficiency (6:29). This is his framework and his reading of his own chart; the transcript offers no independent test of whether the pattern carries an edge.
Managing around the 10:00 speech
He says he exited on the way out of the move and then dropped one more portion, and explains that he was not trying to be perfect because the Fed chair’s speech was due at 10:00 that morning. He describes wanting to make sure the trade was funded before that time, then raising the stop, which was then hit as price came back (6:47, 7:04). He notes again that bodies did not show the midpoint level on the pullback.

What followed, as he reads it, is the point of the review: at 10:00 the Fed chair’s remarks sent price lower, through a reclaimed bearish fair value gap and back down to the Thursday 9:55 discount wick, where he says half of the wick was again left untouched (7:21, 7:31). Price then rallied, populated the same green inefficiency, and ran higher, taking out the level he had identified the previous day and continuing past it before losing momentum and rolling over (8:26, 8:39).
What he expected versus what he got
He states that the previous video had outlined 29,757.25 as the next upside draw, with the 29,830s beyond it, and that the day reached 29,808 before running out of steam (3:53, 4:08). He says he avoided extending the idea mainly because of the symposium itself, that he had hoped the reaction would build on its momentum, and that the risk of the 10:00 speech competing with the setup was always present. His summary of the session is that nothing was badly wrong apart from the execution (8:51).
He also volunteers a recording failure: he could not capture the beginning of the trade because his editing software was still rendering the previous video and would not let him record again, so the entries appear only after the fact inside the inversion gap (9:31). He is explicit that this is why the entries are shown rather than streamed live.
The lesson he draws about Jackson Hole week
The largest part of the recording is guidance rather than analysis. ICT says the week should be treated as a learning experience and that a trader should respect the symposium even before its first day, marking it on the economic calendar and preparing for a great deal of volatility (10:50). His specific warning is about second runs: wherever a trader thinks a move will start, price can come back and take that low or high out, and he says the session showed this repeatedly in both directions (11:25). He calls the profile seek and destroy (11:46).
He warns against using these sessions to measure progress, advises reviewing day one and day two of the price action over the weekend, and says Jackson Hole weeks are not weeks to over-leverage because the damage can be severe (12:38). He says he had posted that he would not trade that day and told anyone who chose to trade to be careful, adding that when he says be careful he means conditions will be volatile (12:54).
Discipline, audience pressure and the weekend
From roughly 13 minutes onward the recording is about behaviour. He rejects the idea that he teaches traders to avoid Mondays, says his longer-standing students trade every day including report days and, in his words, even in high resistance liquidity run conditions — the only place in the recording where that phrase appears (14:04) — and explains that he still tells beginners to be selective because they are likely to be hurt while learning (13:50).
He argues that a trader who is already profitable for the week can simply stop, take the three-day weekend and demonstrate self-control rather than performing for an audience, and that weekly results are private anyway (15:17, 16:56). He is blunt that the pressure to post trades comes from other people’s expectations, not from any requirement, and that a trader answering to that pressure is being influenced rather than influencing (23:41). Some of the surrounding passage is personal commentary about his audience and critics and is not repeated here.
His own critique of the session
Later he turns the review on himself. He notes that his bias on NQ had been bearish until a certain degree of daily-chart movement occurred, that the drop was sizeable, and that other traders and streamers visibly struggled that week (20:44). He then says he saw the move failing at the midpoint a second time and did not act: he did not exit, and he did not roll the stop up, when he could have placed it just under the consequent encroachment of the longest wick and been stopped at a better price (22:08). He summarises the week as highly manipulated in his view (21:56) and says plainly that he did not do it perfectly (22:04). The manipulation claim is his interpretation of market behaviour; the captions supply no evidence for intent by any participant. A passage of political commentary that follows is unrelated to the price action and unsupported by it, so it is not reproduced.
The study plan he lays out
He closes with process. Next week, he says, will be slower, with no executions posted, and will instead carry daily lectures for his son that he will make available as normal content (22:32). The first task he assigns is logging: decide what to screenshot and annotate, and what to reinforce in memory about price behaviour — not where entries go or where the market will draw (23:19).
The progression he describes runs from repeated observation, through a period of historical testing built on those logs, into paper trading for a minimum of about two to three months, and only then into live funds if the trader is no longer excited or frightened by outcomes (24:33, 24:58). He adds that he does not tell anyone when to transition to a live account, and states that he is not licensed to give trading advice — he says he offers an opinion about how candlesticks are likely to behave, which he distinguishes from advice (25:36).
What the recording does and does not establish
Supported by the captions: the session he is reviewing, the range and projection he says he used, the imbalance he graded as a candidate inversion fair value gap, the prior Thursday wick he targeted, the 10:00 speech he explicitly managed around, his statement that he exited on the way out and was later stopped, the recording failure he discloses, and the extended guidance on event-week risk and study routine.
Not established: the account, the orders and the fills, and therefore any profit or loss. The transcript also cannot confirm the price sequence on the chart or that the session high was exactly the figure quoted, and the exact instrument month is never named beyond Nasdaq futures. The causal claim that the speech caused specific moves is his reading; scheduled events can change participation without dictating individual swings. His characterisation of the week as highly manipulated is an opinion about intent that no caption can support. Finally, one event week cannot demonstrate that Jackson Hole-type weeks behave in a particular way, and his study progression is advice about process rather than evidence about outcomes.
FAQ
Did the trade he describes make money?
Cannot be determined from the transcript. He describes exiting part of the position on the way out and being stopped on another part, and gives no figures, no contract count and no account statement. He also says later that he saw the move failing at a midpoint and did not adjust the stop as he could have.
What is the seek-and-destroy model he refers to?
In his usage it is a label for a two-sided session that takes out prior buyside and sellside liquidity in sequence rather than delivering in one direction. He presents it as a descriptive pattern, not as a mechanical signal with a tested success rate.
Does he recommend trading the Jackson Hole symposium week?
No. He tells traders to respect the week, expect volatility and second runs, and says that newcomers, or anyone who does not trust their own read, should not trade with real money at all, going as far as suggesting they stay with tape reading first. The trade shown is presented as his own activity, not as guidance for others.
Why does the transcript show prices like 29,597.50 and 29,757.25?
Those are levels the speaker states as he annotates his chart, captured by automatic speech recognition. They are reproduced here as the captions render them, with the caveat that decimals and exact values may contain recognition errors, and they refer to an unnamed Nasdaq futures contract.
Related ICT video: NQ Trade Review Jackson Hole Symposium Day #2
The mapped source lesson is NQ Trade Review Jackson Hole Symposium Day #2 from The Inner Circle Trader. This BestProps article is source-grounded educational commentary on that recording and the reasoning presented in it; it is not an official ICT lesson, not a verbatim transcript, and not evidence that any level, execution or result discussed in the recording actually occurred.
Watch the original lesson on YouTube
This video cannot be played inside another website: the embed shows “Playback on other websites has been disabled by the video owner.” That response was read from the player itself, so no player is embedded here. You can watch the full lesson directly on YouTube.
Watch NQ Trade Review Jackson Hole Symposium Day #2 on YouTube ↗
Primary sources for the symposium, exchange hours and review workflow
Three of the four references below are the organisations that publish the underlying facts — the host central bank, the exchange that sets the futures session, and the charting vendor that documents its replay feature. The fourth is an unofficial third-party archive and is labelled as such.
Confirm the event at the host central bank
The Federal Reserve Bank of Kansas City states that its annual economic policy symposium ran Thursday, August 27, 2026 through Saturday, August 29, 2026 in Jackson, Wyoming, under the theme “Financial Innovation — Implications for Payments and Policy,” and describes it as the venue where it hosts central bankers, policymakers, academics and economists[1]. That establishes the dates, location and theme of the week the recording is reviewing. It does not establish that any specific price move on any futures contract was caused by a particular speaker, paper or headline, and the page contains no market data.
Verify session and holiday hours at the exchange
CME Group publishes the Holiday and Trading Hours schedules for its markets, including the 2026 calendars for Globex and the trading floor, and notes that the schedules are subject to change and are usually finalised about two weeks before a holiday[2]. The 2026 tables list the Labor Day closure on Monday, September 7, 2026.
This is the reference for the time context of any session review. A template built for one time zone will not match a chart set to another, a holiday or shortened session changes both the reference levels and the windows worth observing, and an event week can sit next to a shortened schedule. Verify the product, the venue and the time zone rather than trusting a saved layout.
Review with documented tooling rather than hindsight
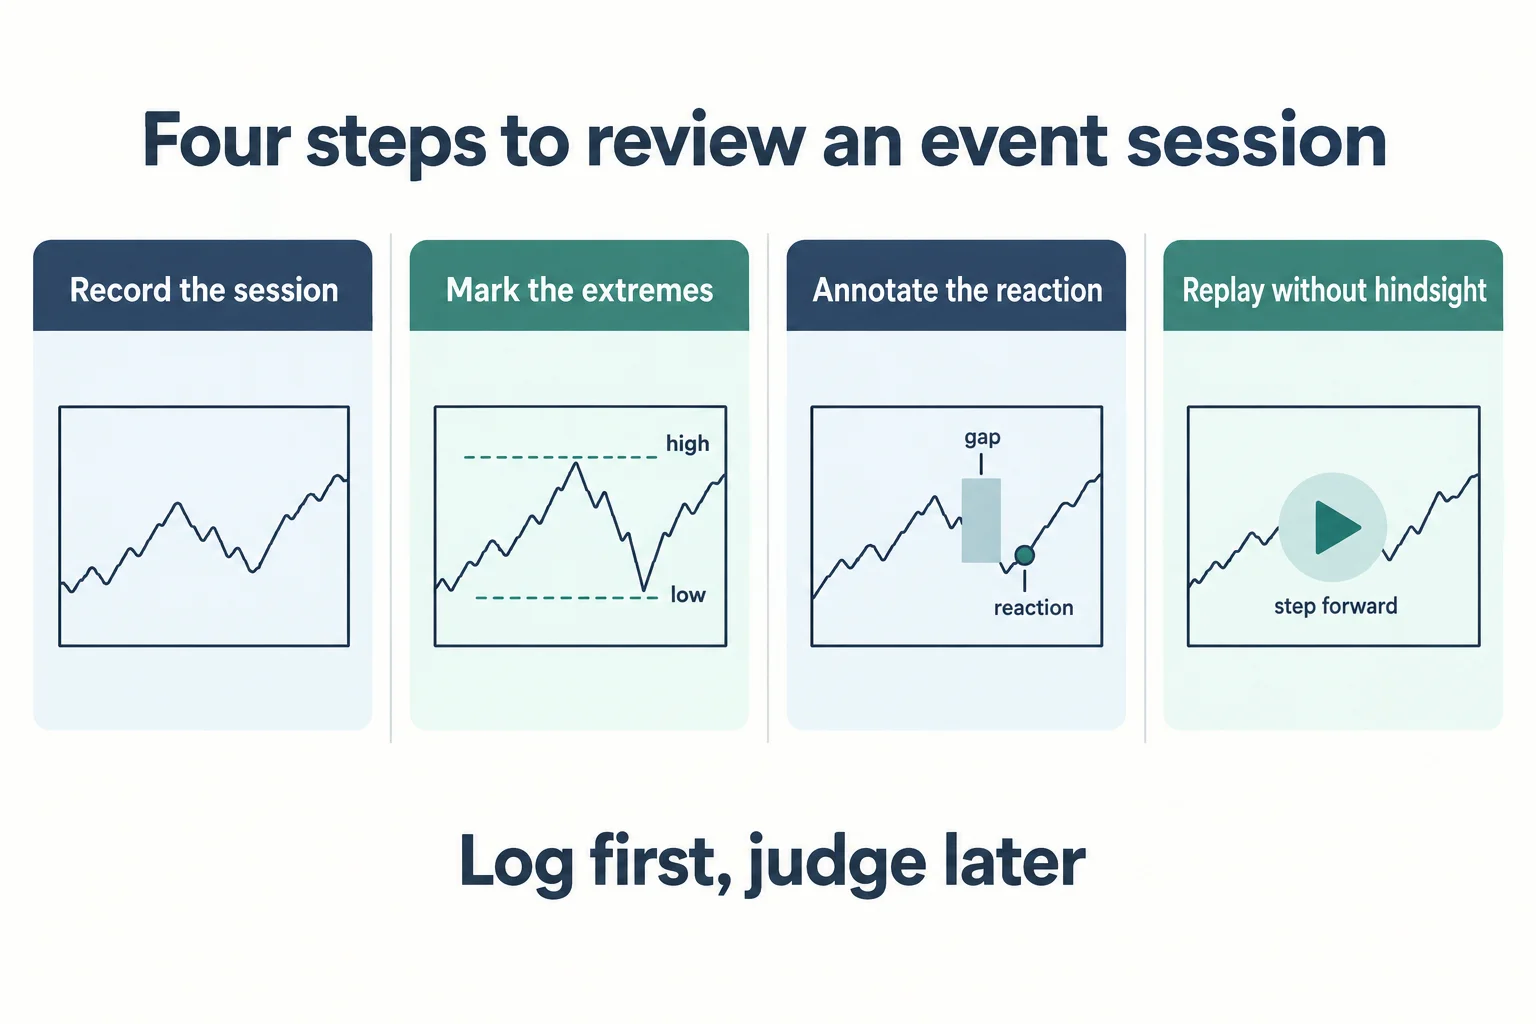
TradingView documents how to start Bar Replay from the chart panel, step forward one bar at a time and jump back to live data[3]. That documentation makes replay a workable way to annotate price delivery in sequence rather than reading a finished chart backwards. It is vendor documentation for a charting feature, not a trading strategy, and BestProps has not tested it. Note the distinction the speaker himself draws repeatedly: he insists the recording shows live activity rather than replay, and replay remains a study of historical data with the benefit of a completed record.
Treat the third-party recap as unofficial
The ICT Archivist page for this video is a community-run archive that summarises Inner Circle Trader recordings in its own words and links to the same recording. It is not the original lesson, not an official ICT publication, and BestProps is not affiliated with it or with the Inner Circle Trader. Because it is a paraphrase with a displayed publication date of 2026-08-28, it should be read as unofficial commentary rather than as a source of verified facts, and the transcript — not the archive — is the basis for the article above.
Sources
- [1] Federal Reserve Bank of Kansas City: Jackson Hole Economic Policy Symposium 2026
- [2] CME Group: Holiday and Trading Hours
- [3] TradingView: How do I turn Bar Replay on?
- [4] Unofficial: ICT Archivist: NQ Trade Review Jackson Hole Symposium Day #2 (community archive, not affiliated, not verified here)
BestProps is not affiliated with the Federal Reserve Bank of Kansas City, CME Group, TradingView or ICT Archivist, and no source listed here endorses this article, the ICT methodology or any setup. Seek and destroy, inversion fair value gap and related labels are interpretive terminology rather than official or tested concepts, and nothing here demonstrates a profitable, repeatable or independently verified result. Event dates, trading hours and platform features change; verify them for the market you actually trade.





