
Key takeaways
In NQ Trading Seek & Destroy Profile Jackson Hole Symposium Day 1, ICT narrates a Nasdaq-100 futures long that he presents as a live execution on the first day of the 2026 Jackson Hole symposium.
Read the full summary
In NQ Trading Seek & Destroy Profile Jackson Hole Symposium Day 1, ICT narrates a Nasdaq-100 futures long that he presents as a live execution on the first day of the 2026 Jackson Hole symposium. He waits for a low to be taken inside the 9:50–10:10 macro window, enters long against a prior fair value gap, places his stop under a wick, targets the morning high as buy-side liquidity, then manages the position through a long, stalling consolidation he calls “corking” before the move delivers. He also says the session was recorded live rather than in market replay, and that he would speed it up and post it as proof. The execution, contracts, fills and results are his narration: captions cannot verify fills, account results or the chart, and his expectation that Jackson Hole day one produces “seek and destroy” behaviour is an interpretation rather than a demonstrated statistical relationship. Nothing here is advice or evidence of reproducible performance.
How we researched this article
BestProps used document-based research from primary firm sources, checked September 14, 2026. The complete source list, scope, limitations, and commercial-state record appear near the end of this article.
The recording runs about thirty-five minutes and shows a single-session NQ sequence with commentary (0:00). At 1:28 he states that there is no market replay involved, and at 11:11 he says he will speed the video up and put it on X so it can be seen that everything was done in real time rather than after the fact. Those are claims about the recording’s provenance that captions cannot independently confirm — the transcript supports what he says, not the absence of hindsight.
The setup he describes taking
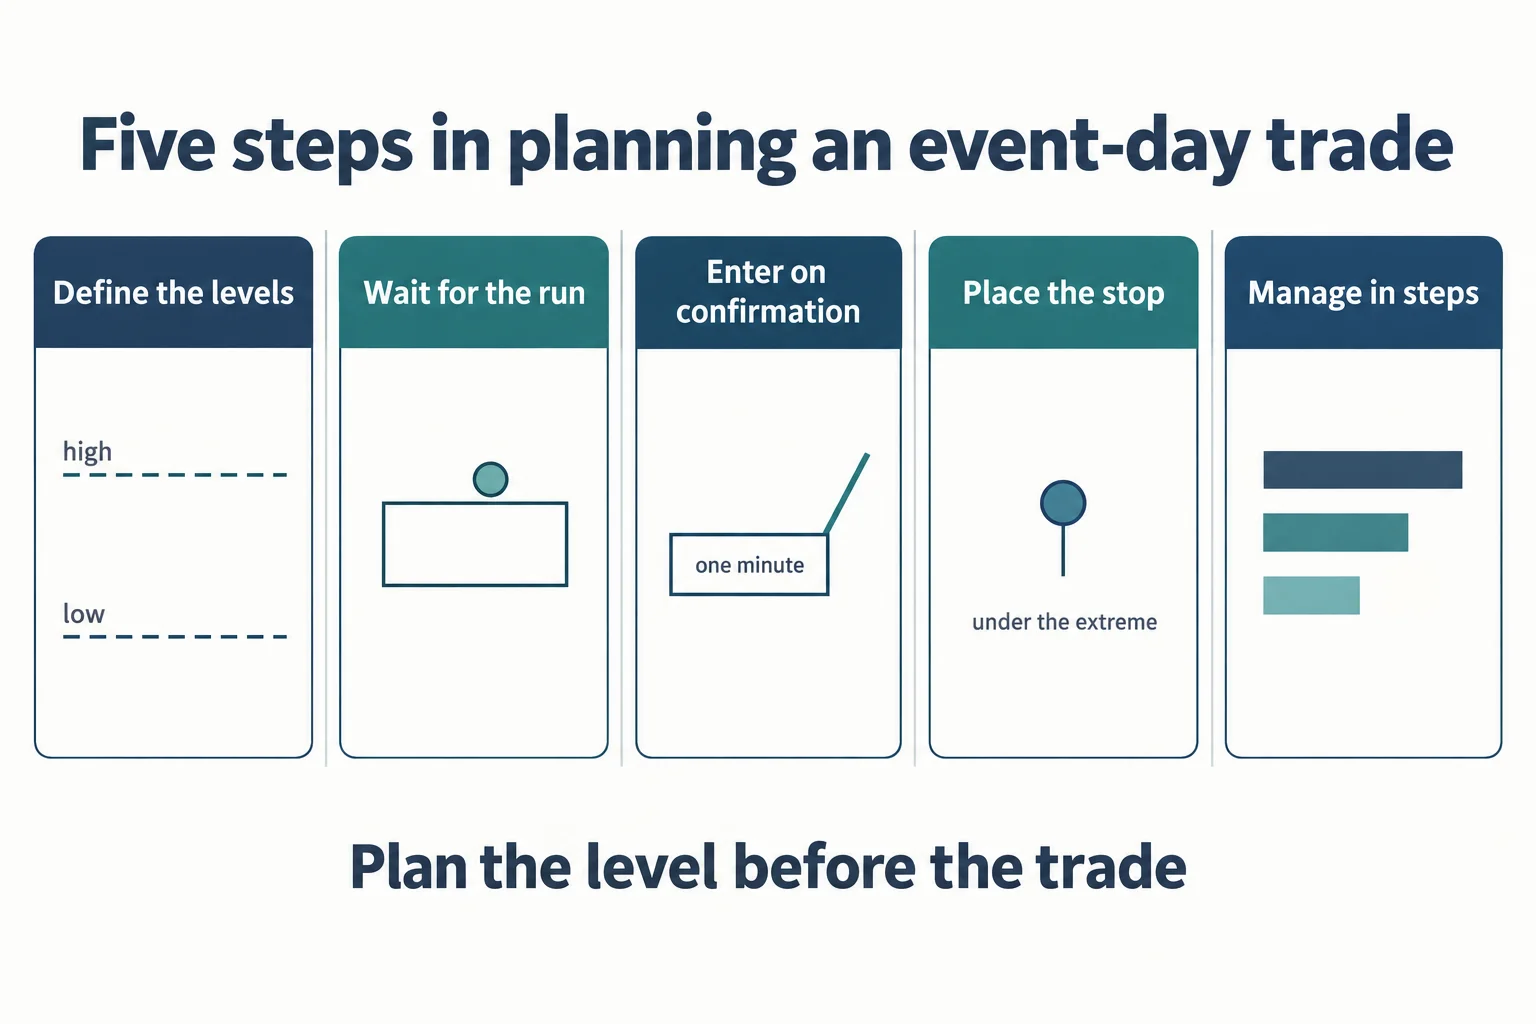
His first line states the plan: he wants a previously formed level, which he reads as 29,443 even, to be blown out, and he notes that price is inside the middle of a macro window he identifies as 9:50 to 10:10 (0:01). If price can get beneath that level, he says he will try a long.
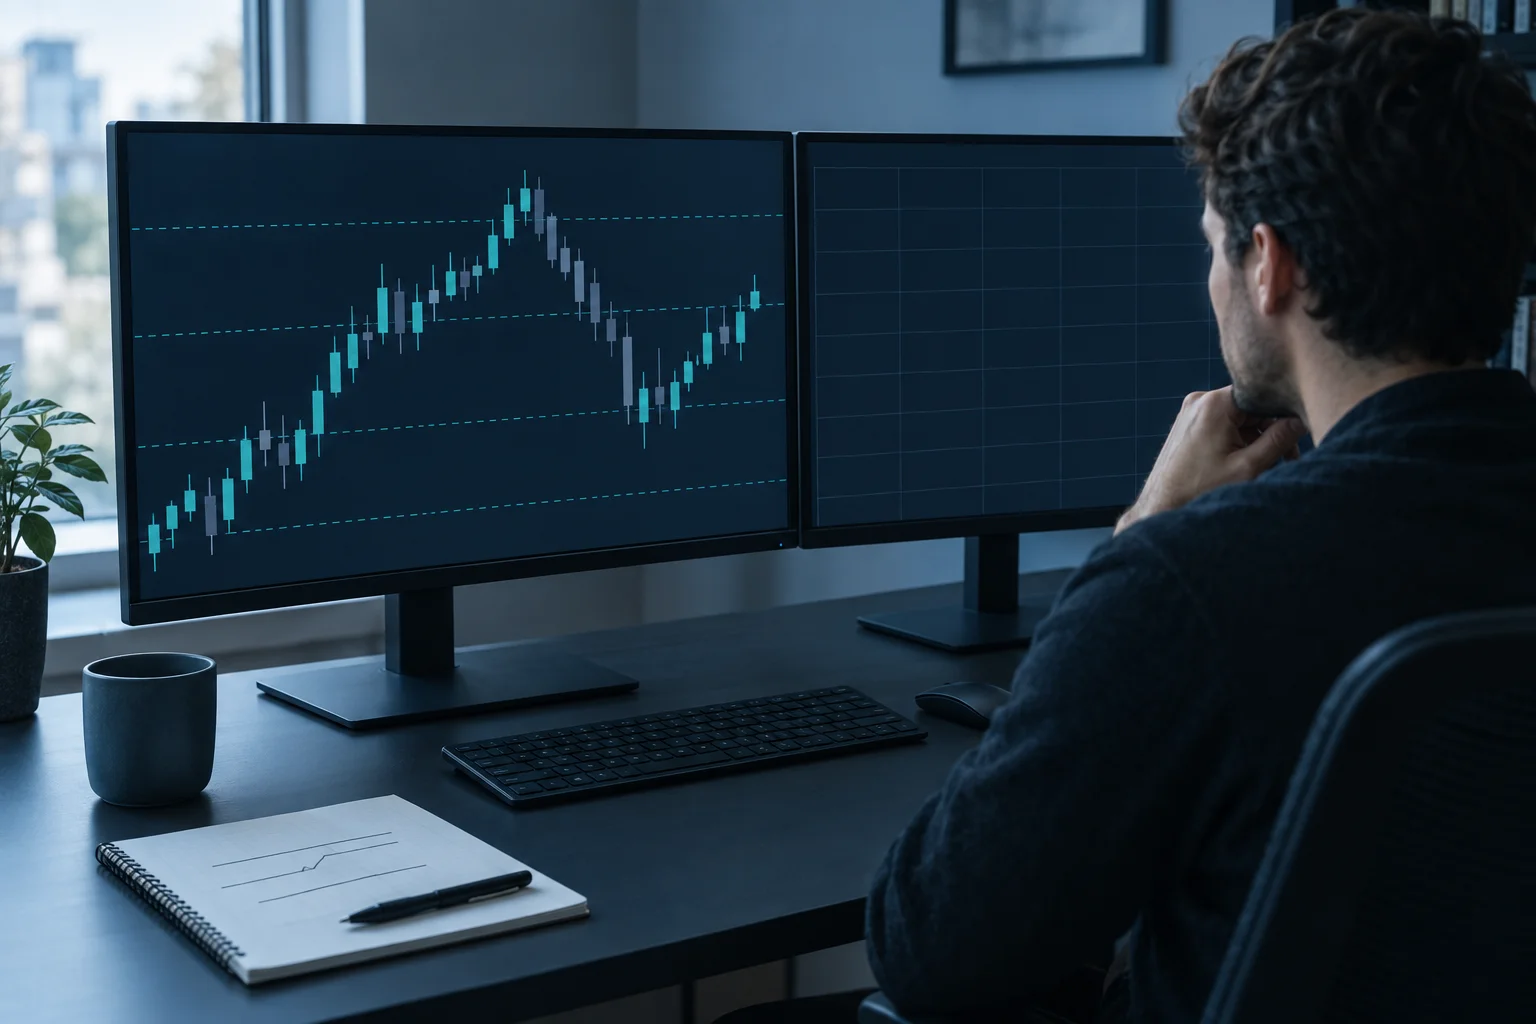
He then waits for the entry he wants rather than taking the first available price: he says he is trying to reach a previously presented fair value gap and that he can no longer hold off (1:05). After entering he places his stop underneath the wick and says his objective is the high of the morning, about one tick beneath it (1:16 and 1:23). Later he explains why the intraday high matters to him: buy stops on short positions are resting above it (6:26).
“Seek and destroy,” and why he says he rarely trades it
At 2:40 he names the context: this is Jackson Hole Symposium day one, which he is trading as a seek and destroy model. His expectation is that the buy-side liquidity he has marked gets taken. He returns to that expectation repeatedly, and at 5:05 says he does not make a practice of trading these days, framing this one as a response to someone accusing him of hiding from the session.
He is explicit about the difficulty. He describes seek and destroy sessions as swinging up and down before making a fast move for the other side, and says the waiting phase feels like it lasts forever (16:22). At 17:17 he says they are very attention-demanding and that inexperienced viewers should watch rather than attempt to execute them — a warning worth taking at face value given that everything in this recording is discretionary narration.
The arrays he says support the trade
His stated rationale is that three references line up beneath his entry: an imbalance, the low of an inversion fair value gap, and its midpoint, which he calls consequent encroachment (4:20). He raises the stop to sit below the wick whose midpoint he measured, saying that a move back below that level removes his interest (7:08), and later describes several wicks plus a down-close order block as a second group of arrays supporting the position (7:25).
The behavioural test he applies throughout is the upper half of a wick: he wants candle bodies to stay inside it and not close below, and if price closes below his consequent-encroachment level he says he will wait for the wick’s upper half to come back into play (9:46). At 11:55 he draws that area out and calls it the discount array he is working from — the upper half of the wick.
The captions render his imbalance labels inconsistently, alternating between “sibi” and phrases that read like “buy side imbalance sell side efficiency” and “buy side balance sell side efficiency”. These are the framework’s standard imbalance labels mangled by automatic transcription, so this article flags them as ambiguous rather than asserting one precise term.
Position management as he narrates it
The sequence includes several stop advances, an add, and staged partial exits. He says that once a relevant close happens he will move risk to positive so that he gets something if he is knocked out (2:31), and at 12:28 he says he cannot lose on the position. He then describes leaving five contracts to be sold at a limit while keeping one running (24:11), and acknowledges he missed buying the exact low candle by one bar (30:27). Later he says he will be annoyed with himself for that omission even though the position worked (31:39).
His most transferable risk remark comes near the end: having reduced risk, he says he will not pull the stop back, adding that you never give up a higher payday (32:35). He then lets the remaining contract run with the stop where it is. That is a rule about not loosening a protective order after the fact, and it holds regardless of whether his framework is correct.
“Corking”: the stalling pattern he describes
Between roughly 19:50 and 23:00 he describes price stalling in a small, untidy block beneath his target. He calls it corking (19:51), distinguishes it from a conventional bull flag, and compares the expected release to a champagne cork coming out of the bottle (21:11). He adds that the block sat right below a high that price was unwilling to leave, and that this pattern used to frighten him out of trades in the 1990s (22:58).
He also reflects on the patience it demands, contrasting his current approach with his own earlier experience of needing every trade to work out, when slow movement pushed him to exit early or reduce too far (26:59). Near the completion of the move he says he has been trading for thirty-three years (33:10) — relevant context for how much practice the discretionary reading he demonstrates represents.
Why he says the day leaned bullish
His stated reason for siding with longs is that price had failed to reach the volume-imbalance high of what he calls the 4 August 2026 NQ buy-side imbalance / sell-side inefficiency (22:29). He argues that because that older level went untested, the market had no reason to keep pressing lower. He also treats an imbalance left only partly filled as evidence of continued upside interest, describing the small poke below it as an institutional order flow entry drill (31:23).
Both readings are his own framework inferences drawn from a chart the transcript does not reproduce. They are presented here as his reasoning, not as tested rules.
What this recording does and does not establish
- The execution is reported, not verified. The transcript supports that he describes entries, stops, an add, partials and a remaining contract. It cannot confirm order tickets, fill prices, contract counts, commissions or any net result, and no statement is included.
- The “live, not replay” claim rests on his word. He asserts there is no market replay (1:28) and says he will post a sped-up version to X as proof (11:11). Nothing in the captions or in this article verifies the recording’s provenance.
- Level figures are narration. 29,443 and the other levels he calls out come from his own chart reading, and the chart is not reproduced in the transcript.
- Caption errors are frequent. Consequent encroachment appears as “consequent courshment” and “consequent encouragement”; the imbalance labels appear as “sibi” and other variants; “CB” and other fragments are unintelligible. Where a term could not be resolved from context it has been omitted rather than guessed.
- The event framing is his interpretation. He argues that seek-and-destroy behaviour tends to occur on the first day of Jackson Hole. He also offers a political characterisation of the symposium’s attendees (25:42); that is opinion, this article neither endorses nor evaluates it, and the transcript contains no study showing that day-one sessions behave differently from other sessions.
- Dates. The inventory lists the upload on 27 August 2026, and the Kansas City Fed lists the 2026 symposium as running Thursday 27 August to Saturday 29 August 2026 — so the “day one” framing is consistent with the calendar. The transcript itself never states the date.
Takeaways a developing trader can test
Three habits in the recording are worth separating from the framework’s vocabulary. First, define the objective before entering: he identifies the buy-side level he is aiming for and only then manages toward it. Second, state invalidation in observable terms — candle closes and wick midpoints, not opinions — and act on it. Third, reduce risk as the idea develops, and never widen a protective stop after the fact.
Alongside those habits, the recording also shows the cost of the approach: a lengthy sideways wait, an entry that missed the extreme by one candle, and a narrator explicitly warning that these sessions are hard to trade. Anyone testing the method should expect long periods of nothing, and should treat any specific level or expected probability as a hypothesis to check, not a fact to copy.
Watch the original recording
This article draws on the automatically generated captions of NQ Trading Seek & Destroy Profile Jackson Hole Symposium Day 1. The captions support the speaker’s words and his stated reasoning; they do not verify his chart, his orders or any result.
Watch the original lesson on YouTube
This recording cannot be played inside another website. When its embedded player was loaded at the BestProps origin and clicked on 13 September 2026, the player itself reported “Playback on other websites has been disabled by the video owner” and settled on a “Watch on YouTube” prompt, with no duration and no playback progress. That response is why no embed is placed here. The lesson itself is available directly on YouTube.
Watch NQ Trading Seek & Destroy Profile Jackson Hole Symposium Day 1 on YouTube ↗
Primary source and practice tool
Two references support what is written above: the official symposium page for the event the recording is framed around, and the replay documentation you would need to rehearse a session like this one yourself.
The event calendar
The Federal Reserve Bank of Kansas City’s 2026 Jackson Hole Economic Policy Symposium page states that the symposium took place Thursday 27 August to Saturday 29 August 2026 in Jackson, Wyoming, under the theme “Financial Innovation — Implications for Payments and Policy”, and that day one consisted of an opening reception and dinner.[1] That is a primary source for the calendar, and it is the only authority here on the event itself: nothing on that page describes how markets traded on any of those days, and no such claim is made in this article.
Replaying a session yourself
TradingView’s Bar Replay guide explains that after the replay panel opens, the chart enters a mode for selecting the starting point, that the Forward button advances the chart one step, and that the Jump to real-time chart button returns you to live data.[2] Because the recording insists that nothing was replayed, replay is exactly how a reader can test whether the same reading was available in real time before the outcome was known.
Sources
- [1] Federal Reserve Bank of Kansas City: Jackson Hole Economic Policy Symposium 2026
- [2] TradingView: How do I turn Bar Replay on?
This is independent educational commentary on a publicly available recording. It is not official ICT material, not a tested trading system, and not a claim that any described result can be reproduced. Futures are leveraged and carry substantial risk. BestProps is not affiliated with the Federal Reserve Bank of Kansas City or TradingView, and no source listed here endorses this article or any trading approach.





