
Key takeaways
In NFP Review & New Student Encouragement, ICT reviews the Friday session around the US nonfarm payrolls release using his “TGIF” weekly-range retracement, the regular-trading-hours opening range gap, an earlier first-presented fair value gap, and an 11:30 a.m.
Read the full summary
In NFP Review & New Student Encouragement, ICT reviews the Friday session around the US nonfarm payrolls release using his “TGIF” weekly-range retracement, the regular-trading-hours opening range gap, an earlier first-presented fair value gap, and an 11:30 a.m. lunch-macro reading. He says he deliberately passed on inversion-gap shorts because it was an NFP Friday before a long weekend, reports closing a short manually before his stop, and then turns to encouragement for new students: study independently, keep records, and do not put a deadline on the learning process. The levels, fills, later price paths, advance-call and “precision” claims come from his narration and cannot be verified from auto-generated captions alone. Nothing here is investment advice or evidence of a repeatable edge.
How we researched this article
BestProps used document-based research from primary firm sources, checked September 13, 2026. The complete source list, scope, limitations, and commercial-state record appear near the end of this article.
The recording opens with ICT welcoming viewers on a Saturday and describing the upload as “a short little review on Friday’s nonfarm payroll” (0:00). He spends roughly the first twenty minutes on the NQ chart and the rest of the session on encouragement, independence and personal reflection. The inventory lists the upload date as 6 September 2026, while he greets viewers on a “Saturday” and reviews the Friday that preceded the US Labor Day weekend; those are different calendar facts, and the transcript does not state the reviewed session’s exact date.
This article paraphrases what he says and separates three things that are easy to blur: the speaker’s own account, the general chart-reading idea, and what the captions can actually establish. The transcript is an automatically generated transcript of a chart presentation, so it can support his words and his stated reasoning, but not the plotted levels, order fills or later price behaviour.
What the “TGIF” weekly retracement is said to be
ICT measures the completed week from its low to its high and then divides that range, adding levels at 20% and 30% (0:28 and 0:45). He calls the idea “TGIF” — “Thank God it’s Friday” — and says that after a week containing a lot of range, or a strongly one-directional move, price tends to retrace 20% to 30% of that weekly range (0:55).
Two qualifications matter if you intend to study the idea. First, he says there is no fixed clock: the retracement can begin as early as 1:00 p.m. on Thursday or only in the latter stages of Friday’s session (1:19). Second, he says the measurement only becomes usable alongside a directional expectation that agrees with the retracement (1:29).
He then reads two levels off the marked range: 29,549 and 29,471.25 (1:47). The first mention does not make it unambiguous which number carries which label; later, referring back, he calls 29,549 even the 20% level (10:30). Both are levels used in this particular review, not general Nasdaq prices, and the chart itself is not reproduced here.
Reading the 8:30 release: wicks, bodies and the earlier gap
Dropping to lower timeframes, he focuses on the reaction at 8:30 a.m. Eastern. His observation is that wicks pushed above a short-term high while no candle body closed above it, and that those wicks stopped just short of an older high (2:29). From there he describes price dropping into a new-week opening gap and later trading back up into the first fair value gap he had presented from Friday 28 August (3:16), then into the first gap formed after 9:30 a.m. Eastern, where the rally again failed to take out the wick highs (3:03 and 3:24).
He states a nuance he says he has taught before: a run into an older high does not necessarily have to take out the wicks, because the bodies can close well above the earlier candle’s close (3:43). That is his liquidity interpretation, not a measured fact about order placement.
Why he says he skipped the short entries he would normally take
This is the part of the review that speaks to risk policy. He says that because it was a nonfarm payroll Friday heading into a long weekend, he did not trust shorting into the inversion fair value gap, the immediate rebalance, or the second inversion gap, and did not want to be caught by a fast run back up (4:11 to 4:42). He adds that on an ordinary day he would have shorted that inversion gap and pyramided on the rebalance (4:42).

His summary is blunt: “I don’t get to have my way on non-farm payroll Thursday and Friday. I just simply abstain from trading those days because it creates a great deal of difficulty that’s not necessary” (5:18). He also jokes about the recurring criticism that he tells people not to trade Mondays and Fridays. Treat all of it as his stated personal policy — not a rule every trader should adopt, and not a claim that event-day trading cannot be planned for.
After price traded below the session low, he says he then trusted the move as a “market maker sell model” that would not return to take the buy-side level he cites at 29,704.50 (6:04). He notes he could have shorted the whole decline for a much larger reported profit, and says he chose not to so that his teaching on event-day risk would match his own conduct.
The regular-trading-hours opening range gap
His next structural reference is the opening range gap between the prior regular session and the next one. He defines it as the difference between Thursday’s 4:14 p.m. Eastern regular-session settlement and Friday’s 9:30 a.m. Eastern opening price, and points out that the rest of the chart is electronic trading hours (7:17). He reads the Thursday settlement as 29,521.25 (7:37).
When price traded back below a candle low inside that gap, he says he expected a push up toward the 9:30 opening price — the high of the opening range gap — followed by a move lower to take out consequent encroachment, which in his terminology is the midpoint between the 9:30 opening price and Thursday’s 4:14 p.m. close (8:43 and 9:04). Because price was inside the gap, he treated it as a premium array and expected a premium-sensitivity sell-off toward a previously presented gap and then the 30% weekly level (9:23 to 9:42).
What he reports about his own execution
He refers back to a recording of the execution in which he was short from higher up. In that recording, in its closing minutes, he says he described the position as the last line of either reaching his target or stopping him out and that it was unlikely to work; he closed it manually (9:46 to 10:12). His description of that close is that it prevented a stop-out and would have been “stopped in the black” — his phrase for not taking a loss.
He then says price went lower after the recording ended, reaching the low of Thursday’s first-presented gap and eventually 30% of the weekly range, and that the 20% level at 29,549 was reached “handsomely” on the nonfarm payroll number before price traded back up later in the day (10:15 to 10:49). These are reported outcomes from the speaker’s own recollection and recording. Captions cannot establish contract size, fills, fees, or a net result, so none of it should be read as verified profitability or as a result you could expect to repeat.
The lunch macro: 11:30, the 10:00 hour, and the first high to the left
He then explains a time-and-price procedure he calls the lunch macro. If it has not already started, he says 11:30 a.m. Eastern is the latest time at which he expects the pullback to begin, pulling price back into the range that was created earlier (11:38). The reference he tells viewers to use is inside the 10:00 a.m. hour (11:59).
- Mark the price range formed during the 10:00 a.m. hour (12:36).
- From 11:00 onward, look left to the first high you meet inside that 10:00 hour (12:55).
- Compare that level with the other references on the chart, such as an earlier presented gap (13:41).
- Keep the weekly retracement objective in view rather than judging the intraday level on its own (13:30).
He says the first high to the left coincides with where his short was taken (13:07), shows the cover, and states that his stop sat only slightly above that area and would have been hit before price continued to the lower targets and the 30% weekly level he links to TGIF (13:18). Again, this is his retrospective reading of a chart that is not in the transcript.
First-presented gaps, order flow, and a challenge to check the claims
He argues that the first fair value gap presented on a Monday or a Friday in the previous two weeks is where the market frequently produces significant intraday or daily highs, and sometimes a weekly or monthly high (13:57). Rather than asking viewers to accept that, he asks them to keep records of what he teaches and to compare it with the chart (14:24). He suggests separating references into dedicated chart layouts — first-presented gaps only, new-week opening gaps, new-day opening gaps, and regular-trading-hours opening range gaps — and says how you organise the information is up to you (14:34 to 15:00).
He also revisits the opening-range-gap decline and says the low it took out had formed inside Thursday’s new-day opening gap, then challenges viewers to search any other discipline for a method that would have identified that low (15:19 and 15:46). He frames his order-flow reading in the same passage: if flow is bullish, the bodies should remain in the upper half of the relevant array or inefficiency, which he says they did (16:22). His confidence that no alternative method could have located the low is an assertion, not something the captions can establish.
Encouragement: study it yourself, and don’t set a deadline
The last two-thirds of the recording is encouragement rather than chart instruction, and it is the reason the lesson is titled as it is.
- Anticipate, don’t react. He describes looking for a repeatable procedure, saying that waiting fearfully to react means you have no expectation about when something will happen (24:00).
- Learn it, then leave. He says he will not hold hands or place viewers in trades, wants students to make the material their own, and rejects being treated as a leader to follow (25:02 and 25:34).
- Keep score honestly. Near the end he asks viewers to track what is taught, compare it with how the market actually delivers, and give the study real time (57:58).
- No deadline. His closing advice is not to demand success by a particular date, because the process cannot be sped up; he tells viewers to relax and let experience accumulate (58:23).
Interleaved with that advice are personal and religious reflections, including his account of giving to people in need rather than to people who are begging, his statement that he sells no subscription or mentorship, and his claim that his public persona is a deliberate device: “ICT is just a mask. It’s a character I play” (49:11). He also describes his own audience growth as the product of an “inflammatory” mechanism that makes outsiders want to respond (56:00). These are statements about himself, motivation and belief; they are not market evidence.
What the transcript can and cannot establish
Separating the layers is what keeps a lesson like this useful.
- Captions carry recognition errors. Phrases rendered as “first percent gap” and “first representative fair value gap” appear to mean a first-presented fair value gap, but the wording is uncertain. One phrase near 4:55 is too garbled to interpret and is deliberately left out of this article rather than guessed at.
- Reported prices and outcomes are the speaker’s. 29,704.50, 29,521.25, 29,549 and 29,471.25 come from his narration of his own chart. The transcript cannot confirm them, the plotted rectangle boundaries, or the fills.
- Advance calls are asserted, not evidenced here. He says he tweeted “TGIF” early on the Friday before the release and the 9:30 open (18:41). No tweet is reproduced in the recording, so the claim is unverified in this source.
- Interpretive claims stay interpretive. Statements that price delivery is scripted and that markets contain “no randomness” (24:47), that the low was located “to the tick”, and the aside about a candlestick representing roughly fifteen thousand dollars (48:05) are claims about his framework and results. They are not independently verified performance figures, and they are not promises about future sessions.
- Dates must be kept apart. The inventory lists the upload on 6 September 2026; he greets viewers on a Saturday and reviews the Friday before the Labor Day weekend, referring to levels from the prior week (Friday 28 August and Thursday 27 August). The transcript never states the reviewed session’s calendar date.
Where this leaves a developing trader
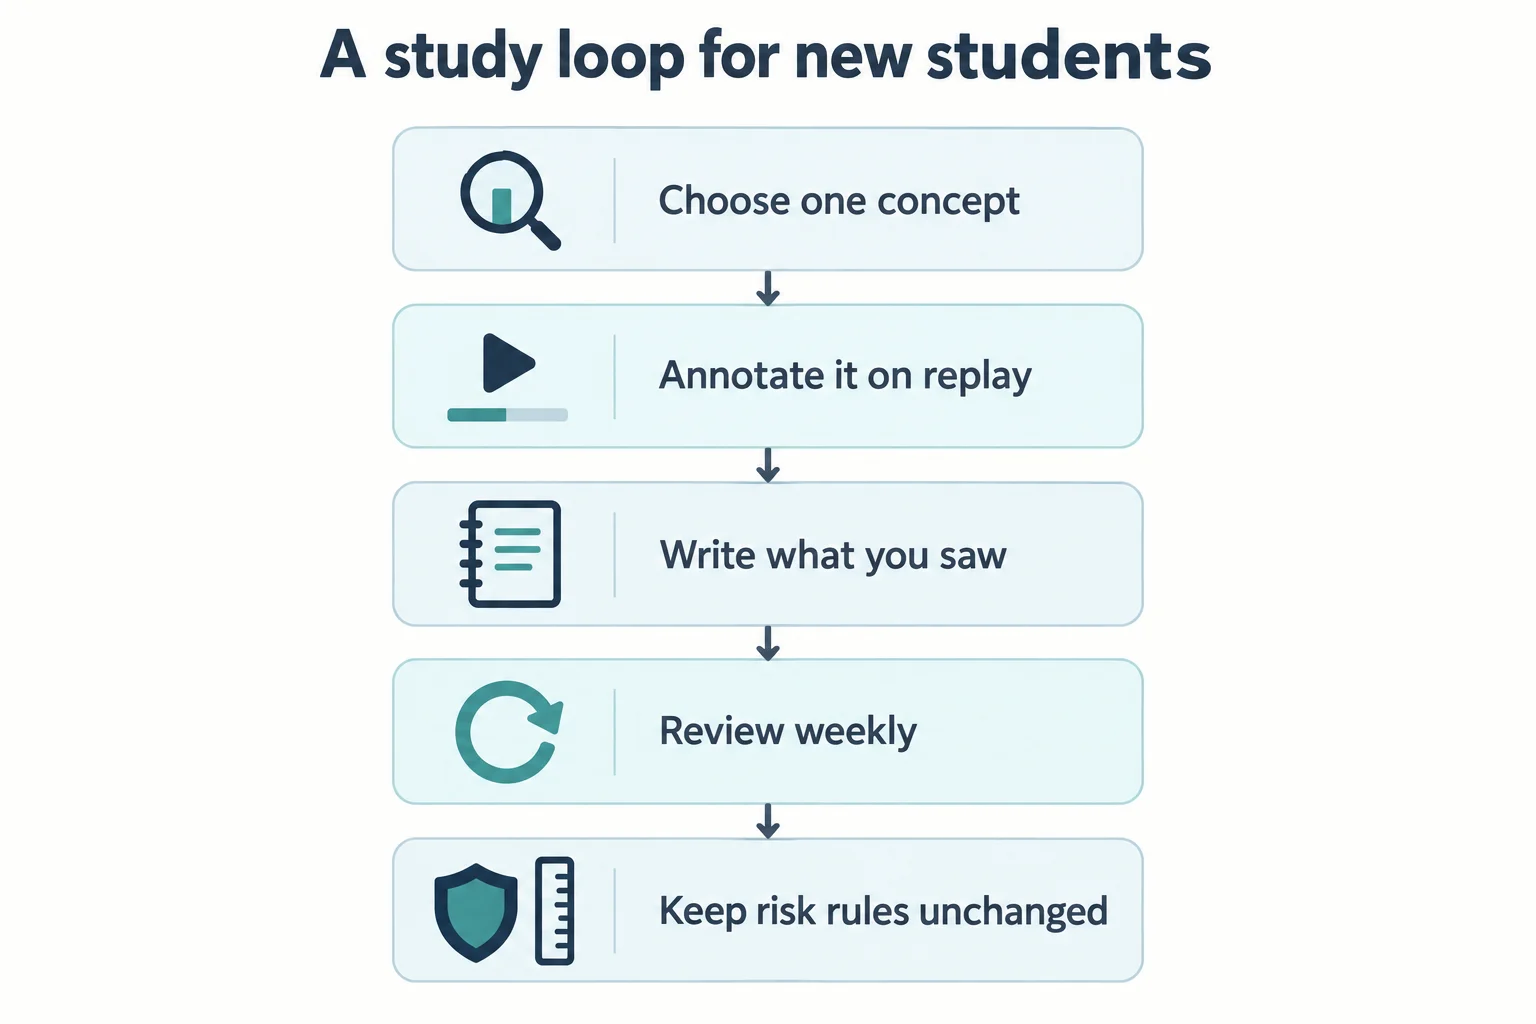
Stripped of the performance framing, the review contains two things a new student can test. The first is a measurement habit: express a weekly move as a range, add a small number of levels, and note whether price interacts with them at particular times of day, recording failures as carefully as successes. The second is a risk habit: decide in advance how you will behave around scheduled releases and long weekends, and then hold to that decision even when the chart afterwards suggests a different outcome would have paid.
Neither habit requires accepting the claim that price delivery is scripted, and neither produces a proven edge. Range measurements and time-of-day windows are observation tools; on their own they say nothing about position size, invalidation, costs or the probability of any individual outcome.
Watch the original recording
This article draws on the automatically generated English captions of NFP Review & New Student Encouragement. The captions support the speaker’s words and stated reasoning; they do not independently verify his chart, his reported execution or later price movement. The recording itself remains the only place to check the annotations described above.
Watch the original lesson on YouTube
This recording cannot be played inside another website. When its embedded player was loaded at the BestProps origin and clicked on 13 September 2026, the player itself reported “Playback on other websites has been disabled by the video owner” and settled on a “Watch on YouTube” prompt, with no duration and no playback progress. That response is why no embed is placed here. The lesson itself is available directly on YouTube.
Tools and further reading for studying an event-day session
The review above leans on three practical habits: replaying a session step by step, knowing where your chart puts the session boundaries, and knowing which scheduled events are in front of you. The pages below document those mechanics; none of them is a trading method and none endorses anything here.
Rehearse a session without seeing the outcome first
TradingView’s Bar Replay guide explains that after the replay panel opens, the chart enters a mode for selecting the starting point, that the Forward button advances the chart one step, and that the Jump to real-time chart button returns you to live data.[1]
That matters when you study a release session: replay is observation. Mark your own reading of each candle before stepping forward, then compare it with what happened next.
Know where your chart draws the session boundaries
TradingView’s note on session-break lines states that blue vertical lines on an intraday chart indicate session breaks and that their display can be switched off in the chart’s Events settings.[2]
Much of the discussion above depends on the difference between electronic trading hours and the regular session, so confirm which template and time zone your chart is using before you attribute a move to the wrong session.
Check the scheduled-event calendar, not just the headline release
The Federal Reserve’s FOMC meeting calendar publishes the scheduled meeting dates and states that a statement and press conference follow on the second day; the 2026 listing includes January 27-28, 2026 and March 17-18, 2026.[3]
Employment reports are not the only scheduled events that can change conditions on a session you planned to study. Read a primary calendar for the day in question and decide in advance what your plan allows.
Sources
- [1] TradingView: How do I turn Bar Replay on?
- [2] TradingView: Session-break vertical lines on a chart
- [3] Federal Reserve Board: FOMC meeting calendar
This is independent educational commentary on a publicly available recording. It is not official ICT material, not a tested trading system, and not a claim that any reported result can be reproduced. Futures are leveraged and carry substantial risk; no concept discussed here promises profitability, funding or payouts. BestProps is not affiliated with TradingView or the Federal Reserve Board, and no source listed here endorses this article or any trading approach.





