
Key takeaways
This is a transcript-grounded summary of the July 22, 2026 Nasdaq futures review posted by The Inner Circle Trader.
Read the full summary
This is a transcript-grounded summary of the July 22, 2026 Nasdaq futures review posted by The Inner Circle Trader. The speaker walks through an overnight decline into Monday’s regular-trading-hours opening-range gap, a failed retest of Wednesday’s noon one-hour buy-side imbalance / sell-side inefficiency, an inversion fair value gap that he says produced his short, and partial exits around a Monday consequent-encroachment level he cites at 28,998.25. Every level, entry and exit below is his narrated interpretation, read from the recording’s own audio; the charts shown in the video were not available for verification, so his fills and results are reported as his claims rather than confirmed outcomes.
How we researched this article
BestProps used document-based research from primary firm sources, checked September 14, 2026. The complete source list, scope, limitations, and commercial-state record appear near the end of this article.
What this recording is, and how it was read
The mapped source is Nasdaq Futures Trade Review & Commentary – July 22, 2026, published on 2026-07-22, a Wednesday. The review is short — about eighteen and a half minutes — and covers one Nasdaq futures session, with the speaker referring back to Monday’s and Tuesday’s sessions. Dates line up that way too: in 2026, July 22 falls on a Wednesday.[1]
The source for the analysis below is the timestamped transcript of the recording’s full audio, produced by automatic speech recognition (not human-checked YouTube captions) with the model whisper-large-v3-turbo. Timestamps are automated, and no segment was flagged low-confidence, but speech recognition can mishear terms and numbers. Where context made the intended trading term obvious, the wording here follows that reading: for example, “consequent encouragement” in the raw text is reported as the ICT term “consequent encroachment,” and “sell side efficiency” as “sell-side inefficiency.” The speaker’s chart markup was not visible to this review, so no candle geometry, zone boundary or price level below has been independently confirmed.
Overnight context and the regular-hours open
At 2:30 the speaker narrows the review to Nasdaq and says that what he teaches here applies to other markets as well. His starting reference is overnight price action that held above Wednesday’s noon Eastern one-hour buy-side imbalance / sell-side inefficiency, the one-hour array he had discussed in the previous session’s commentary.
He then states that price traded back into Monday’s regular-trading-hours opening-range gap during the overnight session, which is what he says he had expected going into the morning, and that the regular-hours session opened lower at 9:30 a.m. Eastern, producing what he calls a discount gap (3:14). At 4:10 he defines the range he is measuring: from the prior regular-hours close, which he gives as 4:14 p.m. Eastern the previous day, up to the 9:30 a.m. reopen. The midpoint of that range — consequent encroachment, in his terminology — is the objective he marks.
According to his narration, price reached that midpoint before 10:00 a.m., which he pairs with a “70% likelihood” figure of his own at 4:36, and he estimates 100 handles or more from the open to that level at 4:42. The recording offers no study, sample or dataset behind the 70% figure; it is his stated expectation, so it is reported here as a claim rather than a measured probability. From there he describes price continuing into the previous day’s first-presented fair value gap and up to a line he calls the highest octant, where he notes that candle bodies stopped on the rally — an observation about his own chart that this review cannot check.
The failure he treats as bearish
He then switches to the electronic-trading-hours chart. At 6:16 he describes another attempt to get above that same one-hour imbalance, a rejection, and a move lower back into the gap he had flagged the night before. A fair value gap that formed just before the prior high was taken out is the one he calls an inversion fair value gap once price failed to hold it as support (6:49). Price then rolls over and trades into Tuesday’s first-presented fair value gap, followed by a sharp sell-off.
The teaching point he draws from this sequence is a change of function. A structure that would normally be read as supportive under a bullish premise fails to hold; because his directional premise was bearish, he treats the failed bullish array as an inversion area instead, and watches the return into that area as a possible short location. At 8:50 he separates two ideas he uses throughout: first presentation, meaning when a gap first formed, and first utilization, meaning how price first interacted with it. His stated rule of thumb is that a buy-side imbalance / sell-side inefficiency should support price if the market is bullish, and that when it fails to do so he will look at it as potential resistance instead.
He points to his entry at 10:28: a fill inside that inversion array, with a wick that pokes into the zone without leaving a candle body above its midpoint, after which price breaks lower. That condition — no body above the midpoint — is his stated criterion for the position staying valid, and the chart reading behind it is his own.
Breaker choice and the “overflow” test
He also marks a breaker built from a high, a low, a higher high and the down-close candle with the lowest close. At 11:18 he acknowledges that two adjacent candles could be used instead, and explains why he prefers the narrower reference — the alternative, he says, would look more rewarding on the chart but is not how he teaches it.
His broader test comes at 12:03, where he gives the definition in his own words: if a premium price-delivery array cannot be traded to, cannot reach its consequent encroachment, or cannot leave a body in its respective upper half, he reads that as bearishness, and if price cannot even touch it, as “extremely bearish” (12:23). This is his terminology and his market-reading method as stated in the recording; the video supplies no test showing how often that reading leads to profitable outcomes.
The short he describes, and his exits
He says he was short three contracts and scaled out as price moved toward Monday’s opening-range-gap midpoint. At 12:51 he cites the level he split at 28,998.25, describing one partial at the low he used, a second halfway between that low and Monday’s consequent-encroachment level, and a third just below Monday’s regular-hours opening-range-gap consequent encroachment. He describes those fills as landing “here and there.” No fills, statements, or brokerage records appear in the recording, so these executions are unverified claims, as are all size and level details in this section.

He then describes an aggressive decline that took out traders who were long against that consequent-encroachment level — his characterization of the move is his own — followed by a reversal. In his account, down-close candles and prior fair value gaps began supporting price during the rally (13:46), and price returned to the one-hour buy-side imbalance / sell-side inefficiency and up to the highest octant before the close of the day’s opening-range gap. At 14:11 he identifies relative equal highs above as the next draw on liquidity, while allowing that the move might come later in the week rather than that day.
The long he says he did not take
At 16:13 he says he was with someone else during the session and therefore did not take a long he otherwise wanted at the consequent encroachment of Wednesday’s one-hour imbalance. What follows is explicitly hypothetical: with two contracts on, he says, he would take one off just below the high of the area he had shaded — about two and a half ticks under it — and would want to see price reach above the 29,352 level (17:37), after which he would be content with the day. No such trade is claimed to have been executed.
The recording also contains a long aside about the speaker’s experience posting market calls on social media, a standing bounty he offers over the origin of the concepts, and criticism of unnamed others; those are personal assertions about himself and third parties, not market analysis, and nothing in them is repeated here as fact.
How to read a review like this
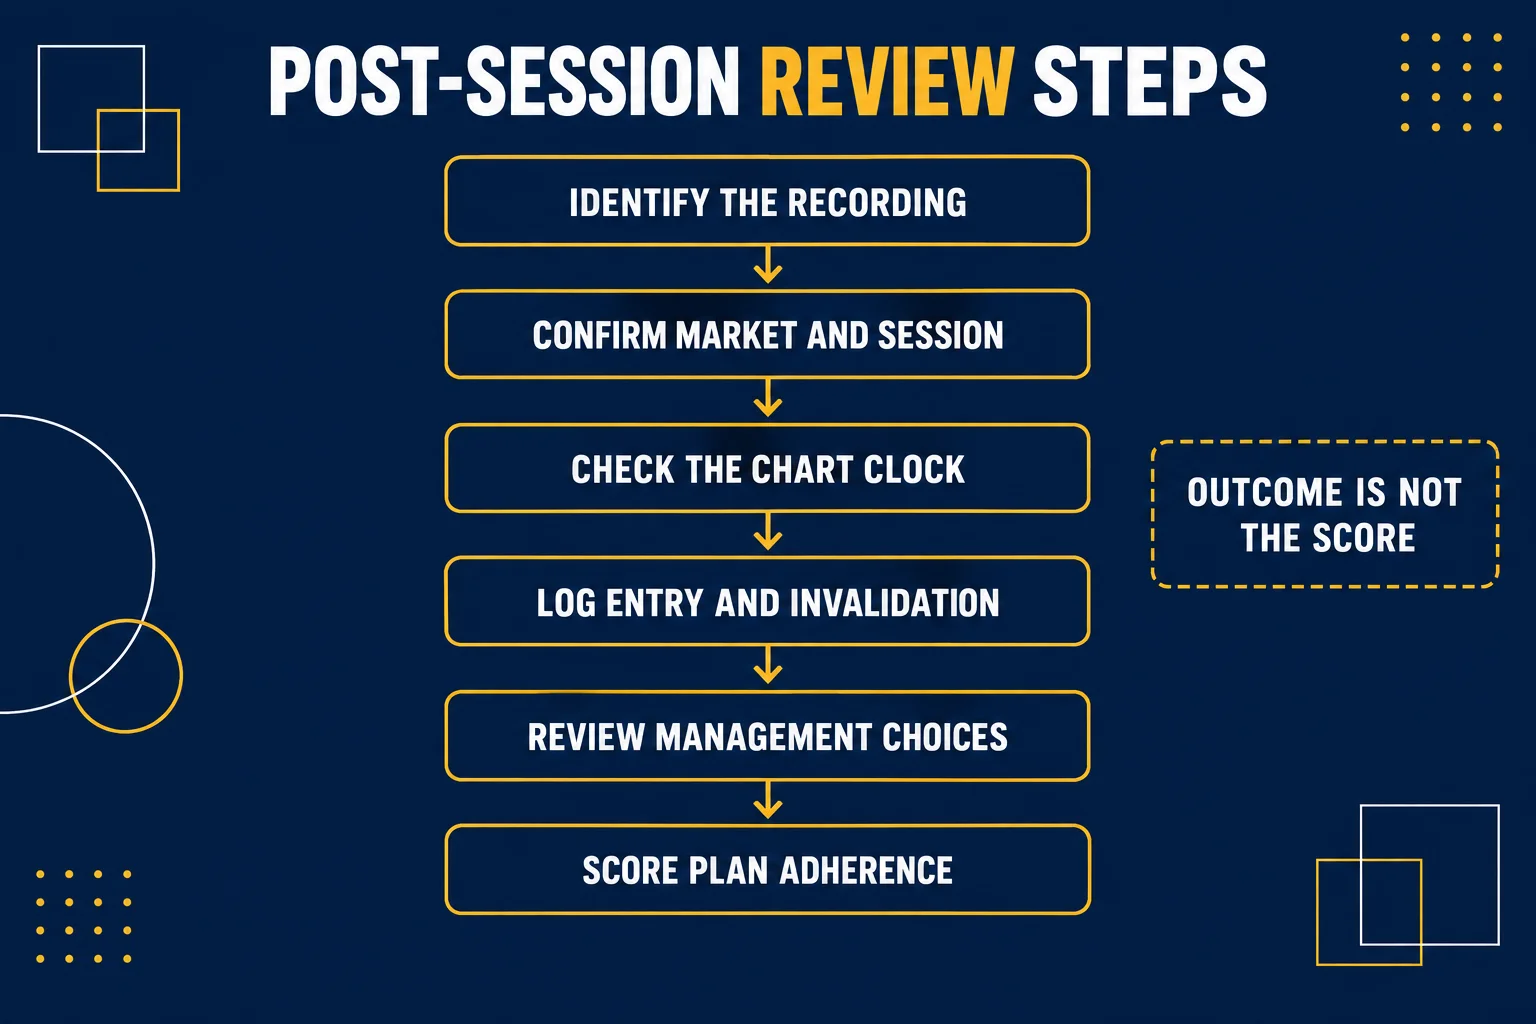
Setting his forecast aside, the recording shows a repeatable way of organizing a review, and it is worth separating the process from the calls:
- State the directional premise before selecting an entry.
- Mark the prior session’s gaps and their midpoints as reference levels in advance.
- Record whether an expected support or resistance level held or failed, and note which premise that outcome supports.
- Treat a failed level as an inversion only when it agrees with the stated premise.
- Define exit references beforehand rather than treating the position as all-or-nothing.
That framework makes a review explicit and checkable. It does not establish that the levels work, and it says nothing about profitability: the session described here is one speaker’s account of one morning, with no independent record of the fills, the sizing or the result.
Watching the original recording
Watch the original recording on YouTube
No embedded player is placed here because this recording cannot be played inside another website: the embed player itself answers with “Playback on other websites has been disabled by the video owner.” That response was read from the player on 2026-09-13 from a BestProps page origin, so this page uses a link card instead of leaving an empty player area. The full recording is available on YouTube.
Watch Nasdaq Futures Trade Review & Commentary – July 22, 2026 on YouTube ↗
Sources and verification notes
Two kinds of material sit behind this page: the recording itself, which is the source of every quoted level, number and interpretation above, and the reference pages below, which document product and third-party context. Nothing in the list predicts a market outcome, and none of it is presented as an official lesson.
A same-date third-party summary
The ICT Archivist page for July 22, 2026 carries the same title and links the same video ID, and its summary describes a short taken into a fair value gap after an inversion, with partial exits toward an opening-range consequent-encroachment midpoint.[2] That site is independent and unaffiliated with the speaker, with this article and with BestProps, and a summary there is not evidence that any stated entry, partial exit or outcome occurred as described; it is listed only so readers can compare an outside account with the recording.
Contract sizing questions the review raises
Because the speaker counts moves in handles, it matters which Nasdaq-100 contract a chart is showing. CME Group’s own page for the Micro E-mini states that “The Micro E-mini Nasdaq-100 futures contract is $2 x the Nasdaq-100 Index and has a minimum tick of 0.25 index points” and describes MNQ futures as “smaller-sized versions of our liquid benchmark E-mini contracts”.[4] The full-size E-mini is the larger contract in that family, so the same handle count is not the same dollar amount on the two products; the exchange’s E-mini specification page carries the corresponding terms for NQ.[3] Neither page makes any claim about direction, setups or outcomes.
Sources
- [1] YouTube: Nasdaq Futures Trade Review & Commentary – July 22, 2026 – The Inner Circle Trader (mapped source recording; title, channel, length and publication date read 2026-09-13; the recording’s own audio is the transcript source; embed refused by the player)
- [2] ICT Archivist: Nasdaq Futures Trade Review & Commentary – July 22, 2026 (independent third-party summary credited to “Summarizer” that links the mapped recording; not affiliated with or endorsed by The Inner Circle Trader, not an official lesson, and not evidence about any entry, partial exit or outcome)
- [3] CME Group: E-mini Nasdaq-100 Futures Contract Specs (contract multiplier and minimum tick for NQ; page title read 2026-09-13)
- [4] CME Group: Micro E-mini Nasdaq-100 Index Futures Contract Specs (multiplier and minimum tick for MNQ, quoted above; read 2026-09-14)
BestProps is not affiliated with The Inner Circle Trader, ICT Archivist or CME Group, and no source listed here endorses this article, this site or any setup. Opening-range gap, fair value gap, inversion fair value gap, consequent encroachment, PD array, breaker, octant and handle are used on this page only as descriptive study terms for the speaker’s framework. Nothing here demonstrates a tested, repeatable or profitable result, and no claim is made that any of the levels discussed predicts price or was verified on a live account.





