
How we researched this article
BestProps used document-based research from primary firm sources, checked September 14, 2026. The complete source list, scope, limitations, and commercial-state record appear near the end of this article.
In Trade Explanation AM Session & Hangman PD Array 07\16\2026, ICT works through a short intraday lesson: a bearish higher-time-frame premise, an hourly inefficiency carried into the session, the level behaviour he watches before acting, and the rejection sequence he calls the “hangman” PD array. This ICT trade explanation for the AM session is written from an automatic transcript of the recording’s audio.
Two date facts are worth keeping separate. The recording’s own title carries 07\16\2026 and its watch page reports an upload of 16 July 2026 at 18:17 Pacific (the inventory stores that upload under the 17 July 2026 UTC date). Inside the recording he says his local time is still Thursday while the chart is showing the newly opened Friday electronic session (“this is Friday’s trading”), so the title date identifies when the explanation was recorded rather than a session he names out loud.
The transcript supports the reasoning he states and the levels he discusses. It does not verify chart boundaries, displayed orders, fills, stops or any outcome, because no visual chart verification was available. Nothing here is investment advice.
The higher-time-frame premise
He begins on the daily chart. His prior expectation of lower prices rested on a volume imbalance, a close beneath it, and sell-side liquidity sitting near what he treats as relative equal lows (0:20). He keeps those lows on the radar as a possible draw while allowing for more than one scenario for the sessions ahead (0:44).
The clearest teaching point arrives early: he argues that an intraday idea only has a higher probability behind it when it is anchored to a weekly or daily key level, or to a specific draw on liquidity, and he offers that as his own opinion rather than a rule (2:21). He adds that his bullish alternative would only come into play if price took out the open of the prior daily candle (3:14).
Daily inefficiency carried onto the hourly chart
Moving down to the hourly chart (3:38), he identifies an hourly buy-side imbalance and sell-side inefficiency anchored to Wednesday’s noon Eastern time candle (4:12). The automatic transcript renders that terminology inconsistently; the repeated concept is a measured range divided into midpoint, quadrant and octant levels.

He is explicit that he wanted the short from a better location inside that range and that he would have taken it had he been watching: “I would have shorted that if I was right in front of the charts.” (10:59) The same framing returns later, when he says he would have sold the first touch of the level as the 9:30 candle ran into the lower quadrant of the daily inefficiency (16:04). Those are retrospective statements about what he would have done, not records of fills.
He also describes what he keeps on his own pad when asked: quadrant and octant levels of inefficiencies, old pools of liquidity, prior daily highs, prior session lows, and the time at which a reference range formed (12:25). His stated purpose is for students to build their own model rather than copy his private notes.
Getting back “in sync”: first utilization
The middle of the recording deals with a rally that chat participants were reading as a bull flag, or as a run toward relative equal highs (20:24). He disagrees with that read because he does not treat those highs as a draw within the larger bearish context. His question is procedural: how does the array get back in sync? His answer is to give price a chance to take out buy side and then close back below the area, which he calls resetting “first utilization” (21:27), and he defines first utilization as the point at which a PD array forms (21:35). The implication he draws is that direction, liquidity, displacement, closes and timing should line up before an array is treated as active again; that is his framework, not a tested rule.
What he calls a “hangman”
He names the formation at 27:21. It is not the standard hanging-man candle and he says plainly that it is not a doji either (28:37). He then explains the name with a gallows metaphor, describing price being led up and then left to hang (28:13).
The sequence he describes is: an array is established inside a bearish narrative; candle bodies sit around or just beyond the consequent encroachment, which can look like continuation; a wick trades further past the midpoint; price then rejects and moves back outside the area to the downside; he reads that as long positions being trapped at the midpoint. He states the criteria in terms of the bodies and the wick above them (28:24). The structural point he emphasises is that the pattern only means something in its location inside a PD array and under the preceding directional narrative, not as an isolated candle.
Bodies, wicks and session timing
He returns to his oldest distinction near the end: wicks can penetrate a level, but the bodies carry the narrative, so bodies that repeatedly stay below a referenced boundary read bearish even when wicks briefly trade through it (31:36).
Time-of-day vocabulary is part of the lesson too: the 9:30 open, a 10:00 low and an 11:30 “lunch macro” (25:15). The transcript shows him using those windows; it does not establish that they predict anything on their own.
How to study this recording
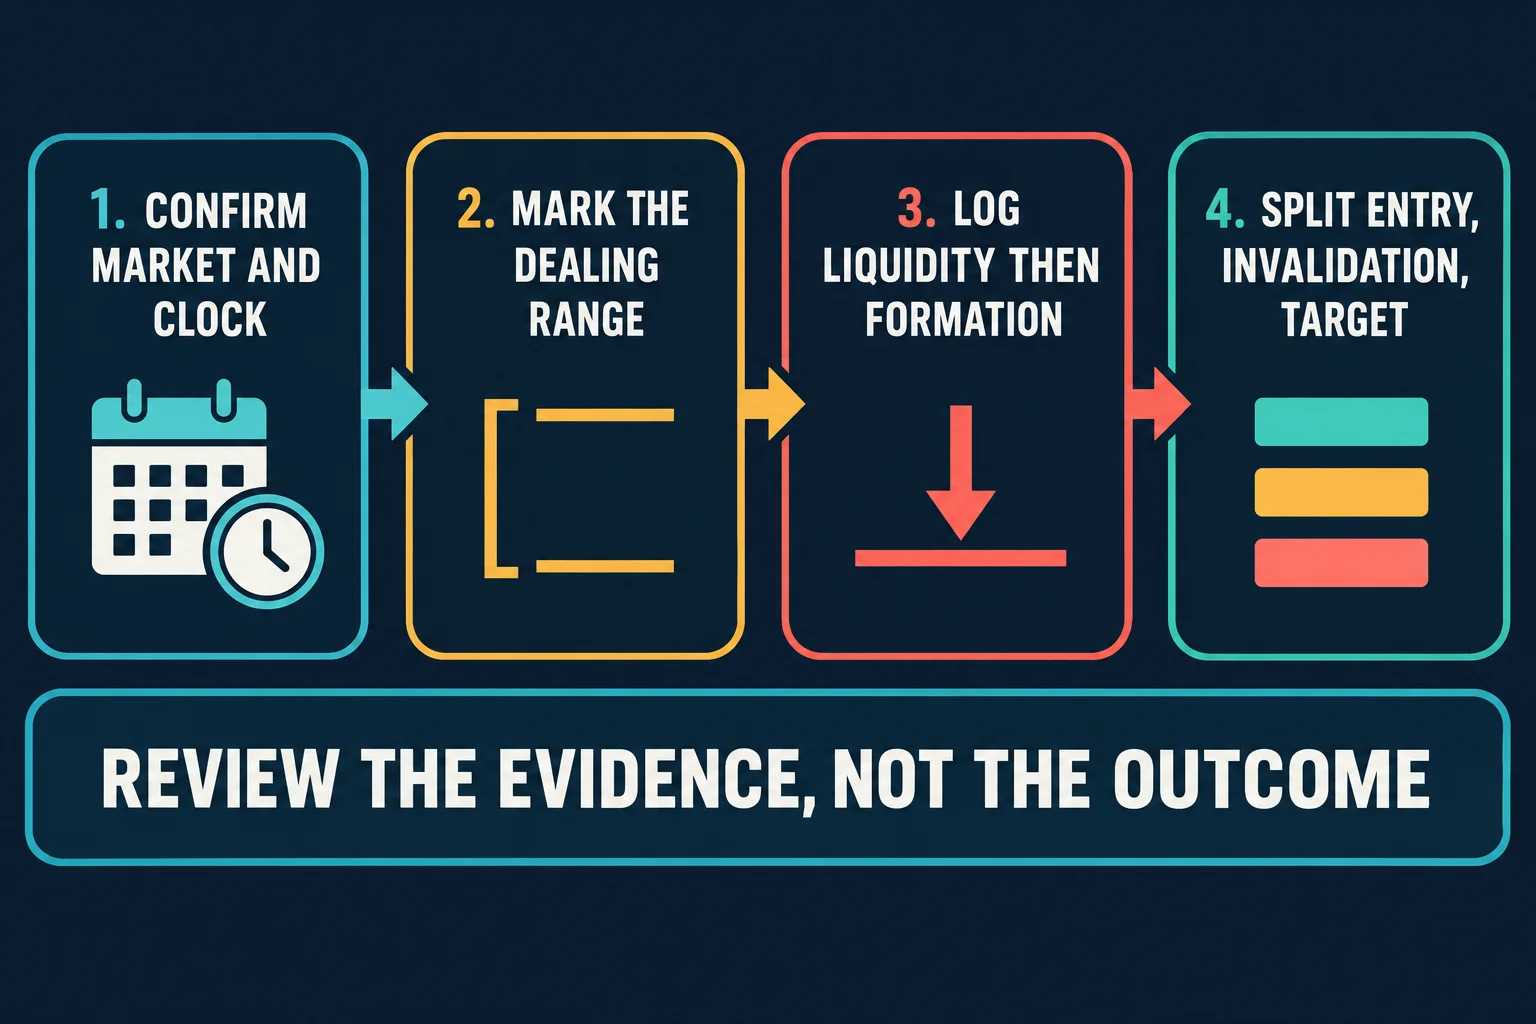
The review process below is the same order used earlier on this page, and it maps directly onto the schematic further down:
- Confirm the market and the clock first. Cash-equity session windows are published by the exchange, and futures hours are different from them, so name the instrument and the session before describing an “AM session”.
- Mark the dealing range before reading any lower-time-frame entry, and note whether observed price was in premium, equilibrium or discount inside it.
- Log the liquidity event before naming a formation: what was swept, where the displacement occurred, and where the close landed relative to the midpoint.
- Split entry, invalidation and target, and write down what would have proved the idea wrong before any result is known.
Watch the original recording
This article is written from the automatically transcribed audio of Trade Explanation AM Session & Hangman PD Array 07\16\2026. Automatic transcription mis-renders parts of ICT’s vocabulary, so the terminology above follows the clearest repeated context rather than any single caption line, and no definition is inferred from a line that is internally contradictory.
Watch the original recording on YouTube
This recording cannot be played inside another website: when its embedded player was opened and clicked on 14 September 2026 from a BestProps page origin, the player itself reported “Playback on other websites has been disabled by the video owner.” and settled on a “Watch on YouTube” prompt, with no duration and no playback progress reported. That message is why no embed is reserved or left blank here; the recording is available directly on YouTube.
Watch Trade Explanation AM Session & Hangman PD Array 07\16\2026 on YouTube ↗
Primary source and further reading
- The recording itself: the primary source for everything described above; the timestamp links open the relevant moments in it.
- The speaker’s own announcement post for this recording, dated 17 July 2026: existence, author (The Inner Circle Trader) and text were confirmed on 14 September 2026 through the platform’s own embed metadata. The post’s shortened link destination is not asserted here.
- NYSE: holidays and trading hours: the exchange lists a pre-opening session from 6:30 a.m. ET, an early trading session from 7:00 a.m. to 9:30 a.m. ET and a core session from 9:30 a.m. to 4:00 p.m. ET, all in Eastern Time, plus early closes at 1:00 p.m. ET. Those are cash-equity windows, not futures hours, so they bound how an “AM session” label is used rather than describing a futures chart.
BestProps is not affiliated with The Inner Circle Trader, YouTube, X or the New York Stock Exchange, and none of them endorses this article or any setup. PD array, premium, equilibrium, discount, dealing range, consequent encroachment, quadrant and octant levels, liquidity sweep, displacement, breaker, first utilization and hangman are used here only as descriptive terms from the lecture being reviewed. One recording cannot establish a win rate, profitability or suitability for a funded account, and nothing on this page recommends a position.
ICT trade explanation AM session and hangman PD array: common questions
What is the “hangman” PD array? In this recording it is a rejection sequence inside an already bearish PD-array context: bodies sit around or slightly beyond the midpoint of the range, a wick pushes further past it, and price then rejects back outside the area. The speaker states explicitly that it is not a doji and not a standalone candle pattern.
Which session does the recording cover? The title carries 07\16\2026 and the upload is dated 16 July 2026 (17 July UTC). Inside the recording his local time is still Thursday, and the chart he is reading is the newly opened Friday electronic session, so no single calendar date for “the session” is stated out loud.
Does the recording prove the setups work? No. It is one speaker explaining his framework and what he says he would have done; the transcript cannot verify chart levels, fills or results, and a single explanation cannot establish an edge.
Is this an official ICT lesson? No. This is independent educational commentary on a publicly available recording.
Futures and equity-index trading involve substantial risk of loss, and a retrospective explanation does not establish future results. This article is educational commentary only.





