
Key takeaways
This is ICT’s Futures Market Review lecture on shadows validating PD arrays, paraphrased from the recording’s timestamped transcript.
Read the full summary
This is ICT’s Futures Market Review lecture on shadows validating PD arrays, paraphrased from the recording’s timestamped transcript. He reviews Nasdaq September futures and explains how he reads candle shadows (wicks) against mapped price-delivery arrays: he measures the wick, treats its midpoint — consequent encroachment — as the line candle bodies should not cross, and treats a body closing beyond that midpoint as short-term invalidation, while a brief wick through it is tolerated. He names one specific overlap a PD-array “shadow”: the shaded region where a bearish daily fair value gap and a daily suspension block bleed into each other, which he then grades as its own range. Fair value gaps, in his account, earn validity either by first presentation or by being anchored to a quadrant or octant of a higher-time-frame range, and he explicitly rejects volume-profile and order-flow explanations for that anchoring. He also shows an intraday short from a daily suspension-block subdivision, order-block “change in state of delivery” entries, and end-of-day wick grading, and he says he is content with his result. Chart coordinates, fills and results cannot be verified from audio, and everything here is his discretionary method, not a tested system.
How we researched this article
BestProps used document-based research from primary firm sources, checked September 14, 2026. The complete source list, scope, limitations, and commercial-state record appear near the end of this article.
In Futures Market Review \ Lecture On Shadows Validating PD Arrays, ICT reviews several intraday Nasdaq examples and explains how he interprets candle wicks, fair value gaps, order blocks, and higher-time-frame ranges. The central lesson is that a lower-time-frame price-delivery array, or PD array, gains context when it overlaps or is anchored to another mapped range.
The presentation begins with an execution-style segment and then moves into chart review. Because the source transcript cannot show the charts, verify fills, or establish later results, the useful focus is ICT’s stated analytical process rather than the performance claims made during the recording.
The core idea: candle bodies versus wicks
ICT repeatedly divides a wick at its midpoint, which he calls consequent encroachment. He then watches whether subsequent candle bodies remain on the expected side of that midpoint. Around 20:39, he gives a bullish example:
- A bullish reaction creates a wick.
- The upper half of that wick, down to its midpoint, is treated as an area of possible discount sensitivity.
- A touch or brief wick through the area can be acceptable within his framework.
- A candle body settling below the midpoint would weaken or invalidate the short-term bullish interpretation.
His bearish application is the reverse. In the opening trade discussion, he wants bodies to remain below the midpoint of a measured wick while price moves toward sell-side liquidity. Later, near 24:44, he grades another wick and says bodies should not appear above its consequent-encroachment level.
This is not presented as a universal property of candlesticks. It is ICT’s method for judging whether price is showing what he calls premium or discount sensitivity after reacting to a mapped PD array.
He attaches a repeatable entry and risk template to the midpoint. In a bullish example beginning near 20:27, he measures the wick that formed on the reaction, treats the upper half of that wick down to consequent encroachment as the area of discount sensitivity, and notes that the down-close candle in the sequence is larger in body than the candles around it, which he reads as a volume imbalance (20:04). His stated trigger is mechanical: take the entry as price trades back below the opening price of that candle (21:13), and place the stop at the low of the wick, on the basis that price should not accept below that midpoint. He frames the risk as the distance between the wick’s low and an entry anywhere in the upper half to consequent encroachment (22:36).
The recording opens with a live execution of the same logic. From the first seconds he describes taking a short at the daily suspension block’s octant levels, lowering the stop once price traded above the nearby single candles, and building the position while watching for an inversion fair value gap to break rather than fail. He scales off partials instead of holding the whole move, and at 2:32 he says he is logging screenshots so viewers can see one execution rather than a string of retrospective entries. He closes that segment by saying he is content to take the intraday low and move to the sidelines, and he notes he had shorted an earlier move that he associates with the 9:50–10:10 macro window (11:44).
Validation after a change in state of delivery
In the Tuesday review beginning around 15:25, ICT describes price reaching the high of a daily “suspension block.” On the lower time frame, he identifies a candle whose opening price is subsequently breached to the upside. He calls that breach a bullish order-block change in the state of delivery.

Importantly, he says the candle does not need to close above the opening price for this particular validation. His reasoning combines several observations: sell-side liquidity had been taken, price was reacting from a higher-time-frame discount area, and delivery then shifted above the selected opening price. A later return to that price is interpreted as a potential bullish reaction point.
ICT adds a second layer at 21:04: if the reaction creates a wick and later candle bodies cannot reach or close below its midpoint, he treats that behavior as further confirmation of the bullish premise. The wick is therefore not a standalone signal. It is assessed after liquidity, timing, directional context, and the proposed order block have already been identified.
What ICT means by a PD-array “shadow”
The term highlighted by the title appears in the detailed Nasdaq discussion starting near 35:15. ICT examines an overlap between a bearish daily fair value gap and a daily suspension block. The chart’s overlapping colors produce a separate shaded region.
At 36:21, he calls this effect another PD array—a “shadow.” In his explanation, one imbalance is effectively cast over another. He then grades the resulting overlap as its own range, dividing it into quadrants or smaller subdivisions.
The practical rule he states near 37:29 is that a lower-time-frame PD array should touch the higher-time-frame range being used. It may connect at the high, low, or somewhere between, but it must be anchored to that range. He uses this relationship to explain why he considers certain fair value gaps meaningful.
First presentation or range anchoring
ICT offers two broad forms of fair-value-gap context in this lecture:
- First-presented fair value gap: the first prominent gap appearing after the relevant displacement or opening move.
- Anchored fair value gap: a later gap that aligns with a quadrant, octant, or other subdivision of a defined higher-time-frame range.
At 39:09, he applies that logic to a gap anchored near the low of the overlapping “shadow.” He contrasts his approach with volume-profile and order-flow explanations, but the video does not provide comparative testing. Those comparisons should therefore be understood as ICT’s opinion, not demonstrated evidence of superiority.
Time, liquidity, and restraint remain part of the model
The lecture does not treat wick geometry as sufficient by itself. ICT repeatedly combines it with liquidity pools, fair value gaps, regular trading hours, and designated “macro” windows. In the Monday example, he associates a reversal with the 9:50–10:10 Eastern time window and a daily suspension-block subdivision. In later examples, he looks for buy-side or sell-side liquidity as a plausible destination after validation.
He also acknowledges difficult conditions. Around 17:11, he says slow, drifting price action can be hard to trade unless a position was established early. Near 48:00, he recommends standing aside when equally persuasive bullish and bearish cases can be made.
He applies the same framework to the other markets he reviews — the dollar index, euro, crude oil, bitcoin, gold and silver — and credits his seasonal framing to work he associates with Larry Williams and Steve Moore (45:24). Around 51:02 he notes the July seasonal tendency toward energy products while cautioning that a geopolitical escalation could override it, and he says he would not be buying crude oil there. Closing on gold and silver, he says he is content with his reported result on a move he had shown earlier (54:31); that figure is his own account of his trading, is not a verified track record, and is not a reason to copy the approach.
Educational takeaway
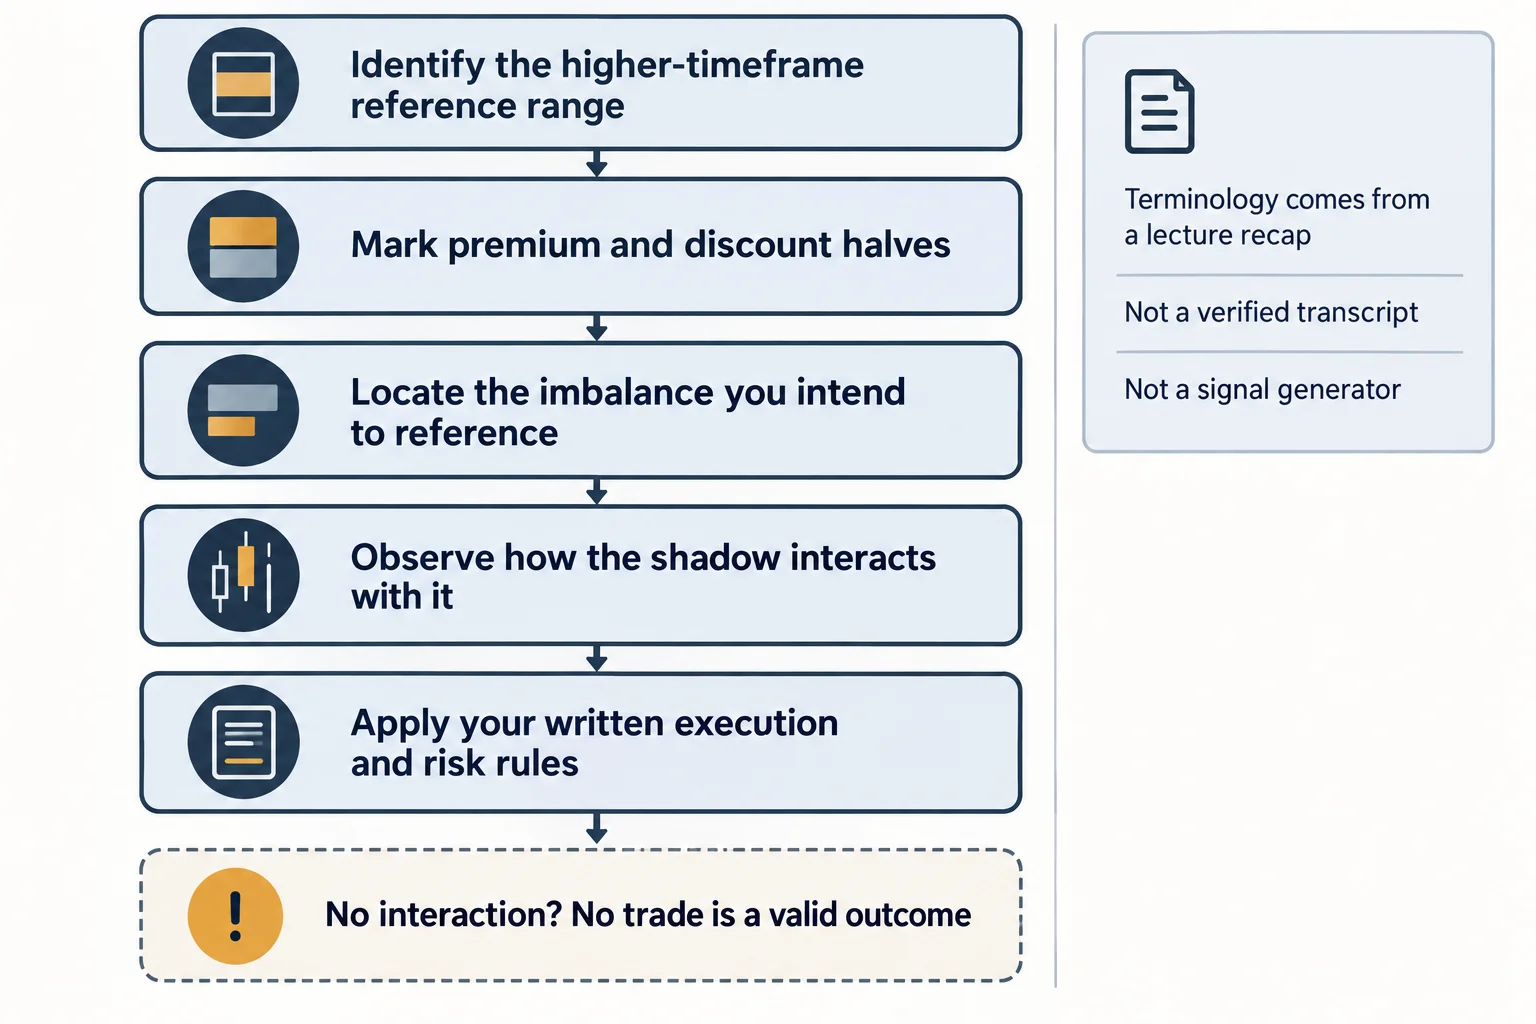
A structured way to study this lesson is to mark the higher-time-frame range first, divide it consistently, and then note which lower-time-frame gaps physically touch that range. After a reaction, record whether candle bodies respect or violate the midpoint of the relevant wick. Finally, compare that behavior with the assumed liquidity objective and time window.
This creates a testable chart-review checklist, but the transcript alone does not establish profitability or predictive reliability. Traders should independently define invalidation, account for execution costs and risk, and avoid treating retrospective examples as guaranteed setups. This summary is educational commentary, not investment advice.
Related ICT video: Futures Market Review \ Lecture On Shadows Validating PD Arrays
For the original recording, watch Futures Market Review \ Lecture On Shadows Validating PD Arrays from The Inner Circle Trader, published 1 July 2026. This BestProps article is independent educational commentary that paraphrases the lecture’s timestamped transcript; it is not an official Inner Circle Trader lesson and it is not a verbatim transcript.
Watch the original lecture on YouTube
Playback on other websites has been disabled by the video owner, so the player cannot be embedded in this article. The same message appears when the player is tested directly.
Official sources for futures risk and the NQ instrument
The lecture this article paraphrases is educational material about chart interpretation. Before relying on any of its terminology, check the primary regulatory and index sources below, and confirm the current contract specification with the listing exchange.
CFTC: Basics of Futures Trading
The CFTC’s Basics of Futures Trading page explains that a commodity futures contract is an agreement to buy or sell a particular commodity at a future date, that most contracts contemplate delivery or cash settlement, and that most are liquidated before the delivery date.[1]
The same page states the risk position plainly: speculating in commodity futures and options is a volatile, complex and risky venture rarely suitable for retail customers, many individuals lose all of their money, and some can be required to pay more than they invested initially.[1] It also notes that firms and individuals handling customer funds or giving trading advice must register with the National Futures Association, the self-regulatory organization approved by the CFTC, and advises knowing how much you can afford to lose above and beyond your initial investment.[1]
CFTC: Learn & Protect registration and fraud checks
The CFTC’s Learn & Protect hub collects registration and disciplinary-history checks, the RED List of entities that are not registered, and reporting routes for tips and complaints, and it states directly that there is no such thing as a risk-free trade or investment.[2]
Use it to confirm a counterparty’s registration status rather than relying on the marketing of a signal service, indicator vendor or account-management offer.
Nasdaq: the index behind NQ futures
The Nasdaq-100 Index overview describes the benchmark as comprised of 100 fundamentally sound and innovative Nasdaq-listed companies, with quarterly reviews and rebalancing keeping the index aligned with current market leaders.[3]
A wick drawn on an NQ chart is a feature of one contract’s traded prices, not of the index composition itself. Confirm the exact contract month, expiry and specification before treating a level from one chart as comparable to another.
Note on ICT terminology and third-party indicators: terms such as PD array, premium, discount, equilibrium, quadrant, octant and shadow are used inconsistently across ICT-oriented sources, and the descriptions in this article paraphrase the lecture’s timestamped transcript, which was produced by automatic speech recognition and can mis-render a term or a number. Indicators and scripts marketed under names such as "ICT" or "Smart Money Concepts" are independent third-party products, not official Inner Circle Trader material, and are not endorsed by the video creator; BestProps has not performance-tested them. A marked zone is a chart annotation. It is not a signal, a forecast, or evidence of future price direction.





