
How we researched this article
BestProps used document-based research from primary firm sources, checked September 14, 2026. The complete source list, scope, limitations, and commercial-state record appear near the end of this article.
In Chain Of Custody Of Price With RTH ORG, the Inner Circle Trader (ICT) answers follow-up questions from his comments and X replies about what he means by the “chain of custody” of price. He then drops to a one-minute index futures chart to show how he grades a regular trading hours opening range gap and how he decides which fair value gaps that form on its internal levels are worth using. The lesson is delivered entirely in his own model and terminology: it contains no account statement, fill list or tested record, and the automatic transcript this article is built from cannot verify chart annotations or the price figures he reads out.
Two dates are worth separating. The video was published on 28 July 2026 according to its watch page and its inventory entry, while the session he reviews is called only “Monday” in the recording. The transcript does not establish that session’s calendar date, so the upload date should not be read as the date of the charted trading day. The source here is a local automatic speech recognition transcript of the full original audio, not publisher captions; specialised terms and spoken digits carry recognition uncertainty and are flagged below where they affect meaning.
What he means by a chain of custody
He introduces the phrase at 0:14 and states the question at 0:22: how does price travel from one key PD array to the next, and what makes an array key or high probability? His answer rejects the popular toolkit — retail support and resistance, supply and demand, and similar concepts — in favour of what he calls a visual and mathematical reading of delivery, on the argument that these markets are algorithmic and their delivery is autonomous until it is deliberately disrupted for a short period.
The operative rule for him is grading. At 3:20 he says that anyone trading inside a daily or weekly inefficiency must grade it — that all inefficiencies need to be graded — so their internal divisions can be compared with what forms on a lower timeframe. At 3:26 he lists what he looks for once time and price agree at those divisions: fair value gaps, order blocks, breakers, volume imbalances and consequent encroachment. The condition that carries the whole method is that these arrays only matter when they agree with his bias and with a draw on liquidity, meaning where he already expects price to go.
The daily context he carries into the session
Before the intraday work he re-marks a daily-chart imbalance at 1:45 that he refers to as a “suspension block”, describing a bullish imbalance/inefficiency whose defining feature is a volume imbalance at both its upper and lower end (the transcript’s wording, “volume of balance”, is read here as volume imbalance). In the same opening minutes he corrects a technical error from the previous evening’s video: at 2:08 he says he had drawn the Fibonacci tool from the wrong price action, and that the anchor should be the higher of the two prices of the reference candle. The particular levels he reads aloud during that correction are spoken numbers in an automatic transcript and are not reproducible from audio alone.

He then describes the shaded area he is working from as graded out at 2:51: octants, quadrants, the high and the low of the interval, and the imbalance inside it. That vocabulary — quadrants and octants rather than quarters and eighths — is the one he applies to the intraday gap shortly afterwards.
Constructing Monday’s opening range gap
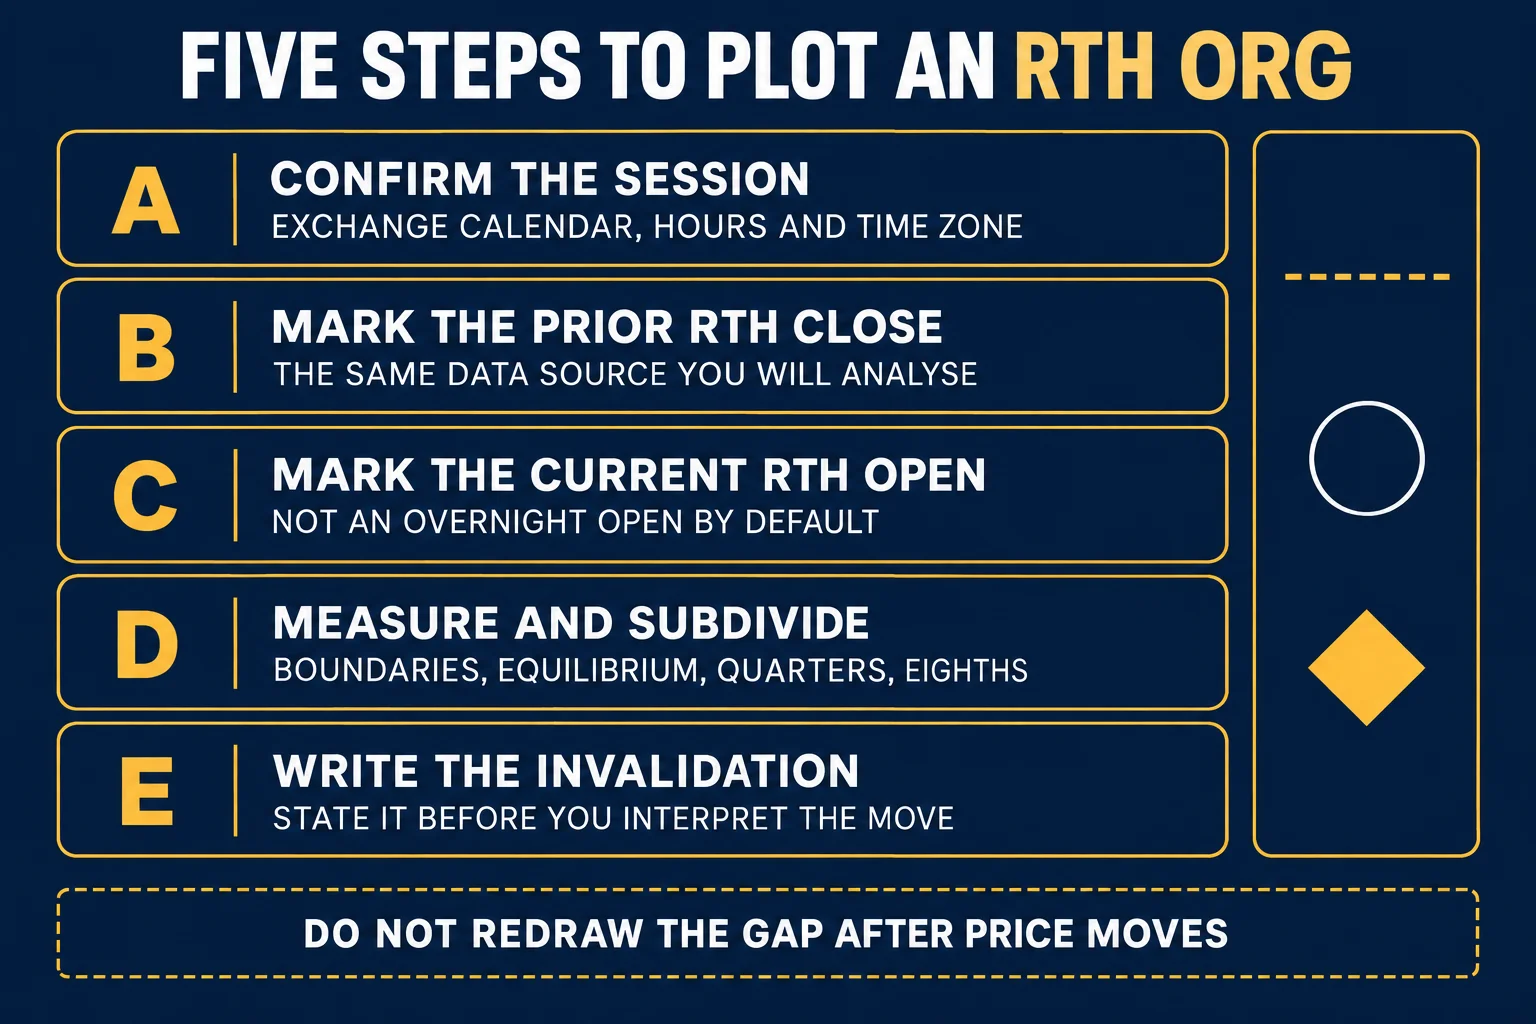
The worked example starts at 4:18 on a one-minute chart, where he builds the Monday regular trading hours opening range gap — the “RTH ORG” of the title. He defines it with two reference points on the chart: the opening print of the 9:30 a.m. Eastern Time candle, which forms the upper boundary of the gap in this instance (6:32), and the last print of the prior regular session, which he places at 4:14 p.m. Eastern Time on Friday and which forms the lower boundary (6:50).
He addresses a recurring objection from his own students about whether a 4:14 p.m. print should be used at all. His position at 5:04 and again at 5:17 is that the 9:30 opening print and the final regular-session print are the only two anchors a regular-hours trader needs, and at 6:56 he dismisses alternative readings as chasing phantoms. He anchors the Fibonacci tool to the higher of the 9:30 candle’s open and close at 4:51 and extends it across the interval, which is what produces the dividing levels: a midpoint he calls consequent encroachment, plus quadrants and octants.
Choosing which fair value gap to use
At 7:44 the intraday arrays begin to stack near the open, and he treats the first one as the first presented fair value gap of the session. The exact label he attaches to each formation is rendered inconsistently by automatic transcription — the transcript produces “buy side imbalance, sell side inefficiency” for one and a “SIBI” for the other moments later — so the label-to-timestamp mapping should be checked against the chart rather than quoted from this text. What he states clearly is the rule that makes a presented gap usable: its first utilisation follows the directional narrative. With a bearish bias he wants price to trade back down through the gap, close below it, and only then does he treat it as the short entry location for the session (8:35).
Inversion fair value gap traders get a separate treatment at 9:42. His example is a candle whose first utilisation was buy-side delivery because it closed up; once price trades back below it, he inverts the logic used for that first utilisation, and in his narration price then rallies into the upper octant of the interval before falling away. He also shows that not every inefficiency earns the same label: at 10:46 he checks a formation for a volume imbalance, finds none, and says that is why it is not a suspension block, while a nearby candle whose close sits slightly above its open does contain a small imbalance and is presented as a high-probability gap.
Alignment is what raises the grade
The clearest selection rule in the lesson comes at 9:09: in the familiar three-candle sequence, candle two is the inefficiency, and that candle must connect to an octant or another graded level within the range that frames the analysis and the draw on liquidity. His strongest intraday example follows at 11:29, where candle two of a gap touches two internal levels at once — the upper quadrant and the lower octant — and he reasons that an array resting on two graded levels should produce more than a token move. He adds, honestly about his own read, that price came back up once more before the drop he was expecting and that the delivery went on to require further participation at lower levels.
He then interprets a gap that forms around the midpoint of the interval, 12:15, as a breakaway gap, on the ground that in his narration price never traded back into it and closed (12:43). Whether that is what the chart actually shows is exactly the kind of claim a transcript cannot settle.
When the opening range gap stops being the whole story
His layers are hierarchical rather than competing. At 13:18 an inefficiency forms on the low of the gap closure, which he also calls the settlement price of the prior Friday’s 4:14 p.m. print. At 13:35 the drop he is following retraces up into consequent encroachment and stops there, with the candle bodies staying below it. That is his cue, at 13:43, to change the question to what price is doing beyond the scope of the regular trading hours opening range gap and to bring back the daily levels he marked at the start of the recording — the larger imbalance the intraday gap is nested inside.
How he defines high probability
His closing summary at 14:07 is that when the levels are good and the arrays are good, the concepts agree; at 14:14 he adds that the more things agree on one side of the market, the less likely he considers movement in the other direction, and calls that his own definition of high probability.
As a study method, the sequence he demonstrates is straightforward: mark the higher-time-frame imbalance, grade the gap the session opens with, anchor it to the two regular-hours reference points, and only then consider arrays whose location, timeframe and directional narrative agree. Treat it as one trader’s framework for organising a chart, not a validated system.
Watch the original lesson
Watch the original lesson on YouTube
This recording cannot be played inside another website. When its embedded player was opened from a BestProps origin on 13 September 2026, the player itself reported “Playback on other websites has been disabled by the video owner.” and settled on a “Watch on YouTube” prompt. No player is reserved or left blank on this page; the lesson is available directly on YouTube.
Primary source and further reading
- The original Inner Circle Trader lesson: the primary source for everything above. The recording runs about 14 minutes 24 seconds, and the timestamp links in this article point into it so each description can be compared with what was actually said.
- TradingView Pine Script documentation: Sessions: platform documentation on how session windows, exchange calendars and time zones are declared in code. Useful background for why the “regular trading hours” boundary differs by instrument and venue; vendor documentation about platform behaviour, not evidence about trading results.
- TradingView Pine Script documentation: Time: how timestamps and time zones are handled on charts, including the distinction between exchange time and the chart’s display time zone. Relevant to reproducing a 9:30 a.m. or 4:14 p.m. Eastern Time anchor on your own chart.
- RTH ORG by Poor Tom Trading (third-party indicator, unofficial): a community script whose description defines an opening range gap as the price gap between the previous session’s closing price and the next session’s opening price in New York time, and asserts that such gaps and their quadrants “act as significant support and resistance levels.” That claim is the author’s own and is untested here; the explanation of the concept in this article comes from ICT’s lesson, not from this script.
This is independent educational commentary on a public recording, not a transcript of it and not official ICT material. The session described is the speaker’s own interpretation of one day’s price action, reproduced from an automatic transcript of the audio; no level, array, sequence or outcome described above has been independently verified, no fill or account result is claimed, and nothing on this page is a recommendation to copy a trade. Futures are leveraged and can produce rapid losses. Nothing here demonstrates a tested, repeatable or profitable result.





