
How we researched this article
BestProps used document-based research from primary firm sources, checked September 14, 2026. The complete source list, scope, limitations, and commercial-state record appear near the end of this article.
This entry in ICT’s 2025 lecture series is a short daily review — the recording runs about five minutes — of Nasdaq futures price action around the 13 May 2025 CPI release.[1] The upload is titled “NQ Review CPI No Trade May 13, 2025”, and the recording itself is chart commentary: ICT narrates the session he had mapped out the night before and then describes what he planned to watch next. It contains no order, entry, stop, fill or profit-and-loss figure, so the “No Trade” wording is a title label rather than a documented trading result.
The timing fits the calendar. The statistical agency’s Consumer Price Index release for April 2025 was published on Tuesday, 13 May 2025, transmitted under embargo until 8:30 a.m. Eastern that morning, which is the event the recording refers to as “the CPI number”.[2]
Everything below is taken from the recording’s own audio transcript. Timestamp links open the video at the moment described. The transcript is machine-generated, so some of ICT’s vocabulary is garbled: the phrase he uses for a session’s first qualifying gap appears repeatedly as “first percent of fair value gap”, and one daily level is rendered first as “SIPI” and later in the same recording as “SIBI”. Wording has been normalised only where the surrounding sentences make the meaning clear, and where it does not — notably the interval he states for the opening-range window — the article reports the ambiguity instead of asserting a figure. Audio cannot verify chart markings, candle values or the exact contract month displayed, so nothing here is presented as an independently confirmed market result.
What he had planned the night before
At 0:32 ICT opens on the daily chart and restates the plan he says he described the previous night: he was looking for price to run up into a daily imbalance, then wanted to see it climb back above that level and use it as an inversion fair value gap to set up a push into the nearby highs. He notes at 0:50 that the opening bell delivered little retracement to work with.
At 0:57 he says he had shared the same expectation beforehand on Twitter and in his Telegram channel — that he would rather have seen the CPI release drop price down, take sell-side liquidity, and then run up into the blue fair value gap he had marked the night before. Those posts are not part of the recording and are not reproduced here; the video states only that he made them.
The morning sequence on the one-minute chart
From 1:18 he walks through what the one-minute chart did. He points out that price traded into a sell-side liquidity pool, and that when the CPI candle’s wick is measured from the open to its low, the upper quadrant of that wick overlaps another marked area. On that reading he identifies the first presented fair value gap for the session, says price traded down into it and left, and then lists the further references price moved through — an additional fair value gap with a volume imbalance, a breakaway gap and a measuring gap — before saying it should go slightly higher.
At 1:55 he identifies the 10:00 a.m. Eastern Silver Bullet window and notes that it overlaps the 9:50–10:10 macro he works with, inviting viewers to plot it on their own charts. At 2:08 he says price reached the consequent encroachment — the midpoint — of the daily fair value gap, the level he had named as the objective, and he traces how price behaved at its high, at the upper quadrant and then outside it.
The afternoon and the final hour
The chart is redrawn at 2:23 and 2:41 with the same blue-shaded daily area shown larger. He says price pushed outside that shading, came back into a buy-side imbalance / sell-side inefficiency, and rallied once more, and he then moves to the opening-range window he watches. The times he states there are internally inconsistent in the transcript, so this article does not assert an interval for that window; what is clear is that he identifies the first presented fair value gap belonging to it at 2:57.
From 3:03 he reviews the final hour. He points to two apparent failure swings, stresses that the candle bodies rather than the wicks tell the story, and says price broke lower below the first presented fair value gap during the 3:15–3:45 p.m. Eastern macro. After the break he describes price returning into that gap and treats it as an inversion fair value gap, says a second imbalance should behave the same way, and notes that the decline delivered into sell-side liquidity and the earlier short-term low. Those are his readings of the chart he had annotated; the transcript cannot establish that the levels were identifiable in real time.
What he said he would watch on Wednesday
At 4:04 ICT sets out the next session. He says he would look for the likelihood of an attempt to reach the lower portion of the daily fair value gap, and that if price broke a little lower he would treat that Tuesday’s first presented fair value gap as the draw. He is explicit that this is a short-term, intraday volatility scenario rather than a change of view: on the daily chart he says “I’m bullish”, and he adds that he is not trying to press the trade hard, partly because the Tuesday gap was delivered to almost immediately — one candle after it formed — rather than being re-delivered, which he treats as weaker evidence (4:18). He closes by saying to watch what the market does on the next open (4:46). The recording ends there, so this article documents only what he said he would watch, not what happened.
How to study a clip like this
A five-minute review is a catalogue of the marks one trader keeps on his chart, not a demonstration that those marks caused anything. The practical use is to replay the recording beside your own chart of the same session, confirm each level and window yourself against the exchange session times — the NYSE lists its core trading session as 9:30 a.m. to 4:00 p.m. ET[3] — separate the remarks that are retrospective commentary from the conditions he sets for the next session, and then log the outcome instead of assuming either one was predictive. The title identifies the instrument as the NQ review; CME Group describes the E-mini Nasdaq-100 as a liquid benchmark contract for the index,[4] though the transcript never names the contract month shown on the chart.
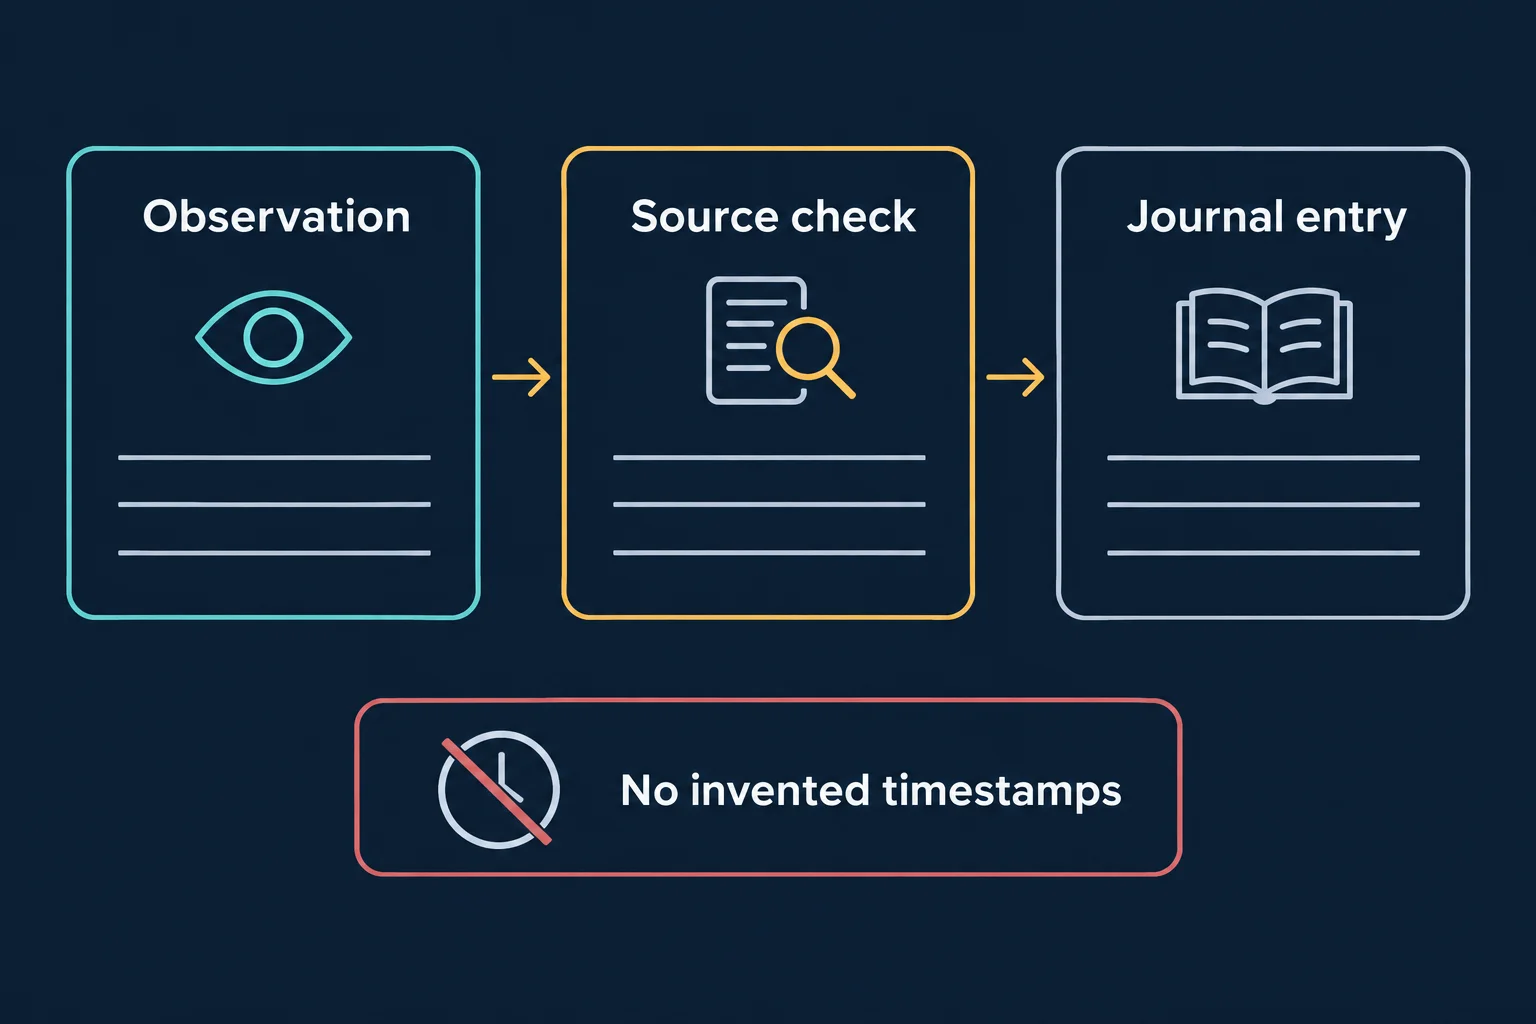
The schematic below shows that study order — observe, check the source, then write the journal entry. It deliberately contains no timestamps, prices or measured results.
Nothing in this review establishes profitability, and the recording’s publisher carries a standing hypothetical-performance disclaimer on the video description. ICT’s liquidity and fair value gap framework is his own interpretation of price delivery; the clip supports what he said about the session, not that the framework predicts markets.
Watching the source recording
Watch the source recording on YouTube
The video cannot be played inside another website. When its embedded player was opened and clicked in an isolated browser session on 14 September 2026, the player reported a video player configuration error (error 153) and settled on a “Watch on YouTube” prompt, with no duration and no playback progress reported. That is why no embed is left here; the recording is available directly on YouTube.
Watch 2025 Lecture Series — NQ Review CPI No Trade May 13, 2025 on YouTube ↗
Sources
- 2025 Lecture Series — NQ Review CPI No Trade May 13, 2025, The Inner Circle Trader (first-party recording; published 13 May 2025; runtime 309 seconds; watch-page metadata and player message read 13–14 September 2026). All timestamps in this article refer to this video.
- Consumer Price Index — April 2025 news release, U.S. Bureau of Labor Statistics (first-party statistical release; embargoed until 8:30 a.m. ET, Tuesday, 13 May 2025; read 14 September 2026). Cited only to establish that the CPI release the recording discusses was published on that date and time.
- NYSE: Holidays & Trading Hours (official exchange page, read 14 September 2026) — core trading session 9:30 a.m. to 4:00 p.m. ET, the session the review’s morning and afternoon windows sit inside.
- CME Group: E-mini Nasdaq-100 futures overview (official exchange product page, read 13 September 2026) — the NQ contract described as a liquid benchmark for the Nasdaq-100 index.





