
Key takeaways
ICT builds this session review around the prior regular-hours high, Asia’s low, the opening range gap and its midpoint. He describes a short toward sell-side liquidity and a later long toward buy-side liquidity using the first presented FVG. His key distinction is between a level reached overnight and one revisited in regular hours—not proof of a repeatable trading edge.[1]
How we researched this article
BestProps used document-based research from primary firm sources, checked September 14, 2026. The complete source list, scope, limitations, and commercial-state record appear near the end of this article.
In this installment of the 2025 Lecture Series, Inner Circle Trader (ICT) reviews Nasdaq futures price action associated with the April 1, 2025 session. He uses daily, 15-minute, one-minute and 15-second chart views to explain his intraday narrative, including the opening range gap, the first fair value gap presented after the cash open, Asia’s low and the prior regular-trading-hours high.[1]
The primary source is 2025 Lecture Series — NQ Futures Review, 04/01/2025. At 0:36–0:43, ICT explicitly identifies Tuesday, April 1, 2025. This recap uses automatic speech recognition of the original audio, not human-verified captions. The transcript cannot independently verify the displayed charts, Telegram calls, executions or profits.[1]
Higher-time-frame context and reference levels
ICT begins with a daily-chart overview. He describes a recent decline in relation to what he calls encroachment of a premium wick, a daily volume imbalance and relative equal lows. These are terms from ICT’s own price-action framework rather than universally standardized market definitions.[1]
Moving to the 15-minute chart at 1:45, he connects the example to his earlier day-trading and scalping modules. His intraday references include the prior regular-trading-hours high and an Asia-session low. At 2:44–2:48, he clarifies that the Asia low formed on his local Monday evening but belonged to Tuesday’s trading session. Numeric price levels are omitted because the automatic transcript contains inconsistent figures.[1]
Electronic trading versus regular trading hours
A central lesson is ICT’s distinction between activity during electronic trading hours and activity after the regular session opens. Beginning around 3:46, he explains that the shaded chart region represents electronic trading, followed by regular trading hours beginning at 9:30 a.m. Eastern.[1]

ICT argues that a level reached during electronic trading can remain relevant if regular-hours price has not yet confirmed or revisited it. In this review, he treats an overnight high and previously filled gap as candidates for another test after the opening bell. That is ICT’s market interpretation; the video does not present a statistical study establishing how often this behavior occurs.[1]
The opening range gap
On the one-minute chart at 5:51, ICT describes the opening range gap using the 9:30 opening price and the prior-session reference he calls the settlement price. At 6:18–6:21, he identifies its midpoint as consequent encroachment. This summarizes his chart convention, not an independently verified exchange settlement procedure.[1]
He then identifies the first presented fair value gap after the open and says it sits on top of the opening range gap high at 6:23–6:39. Keep those two references separate: the opening range gap supplies the session framework, while the first presented FVG is the reaction area he uses within that framework.[1]
The timing mattered to his narrative because economic reports were expected around 10:00 a.m. Eastern. ICT could not recall the complete release list during the recording, although he mentioned PMI. His stated premise was that if price remained below the opening range gap high at 10:00, a rally into the first fair value gap could provide the context for a move lower.[1]
The short-side narrative
At 7:32, ICT reviews price trading into the first fair value gap and describes attempting a short entry near that area. He interprets a short-term high being taken, price holding around the opening range gap high and candle bodies failing to sustain the rally as evidence supporting his bearish scenario.[1]
He also explains an alternate plan: if the initial position had been stopped, he would have watched for price to leave the opening range gap and then retest its midpoint from below. The important educational point is conditional planning. He outlines both the expected reaction and the chart behavior that would have challenged his first entry.[1]
ICT says a later fair value gap formed after price moved away from the opening range midpoint. At 10:05–10:52, he describes it as a reference that should keep price lower and compares the decline with a measured-move idea. At 11:23–11:40, he reports price reaching Asia’s low and reacting upward. These are his interpretation and reported sequence, not independently reconstructed prices.[1]
Reversal and long-side narrative
The review does not stop with the decline. ICT reports a reversal toward the prior Monday regular-hours high. At 13:21–14:14, he describes price returning to the opening range gap and later using the first presented FVG for a long. He distinguishes his shorter intraday scalps from a day-trading model that might have entered nearer the earlier reversal.[1]
At 11:56–12:12, he summarizes the two reported trades as one aimed at sell-side liquidity and another at buy-side liquidity, both using a first presented FVG. His later discussion of a long entry and a target above Monday’s high remains a speaker-reported trade, not a verified return.[1]
Execution review and risk management
The final section is introduced by ICT as a recording of his execution sequence. At 17:33–18:19, he describes the short’s stop in relation to a nearby high and looks for a close below the opening range gap low. He also discusses another downside reference derived from what he calls his event-horizon concept. No exact stop distance, contract risk or chart coordinates are reconstructed here.[1]
As price moved lower, he describes reducing the position in stages, moving the stop to cover costs and later placing it above a fair value gap. This illustrates his stated process of partial exits and adapting invalidation levels as the move developed. The transcript does not disclose complete account details, commissions, slippage or a verified profit-and-loss statement.[1]
Practical educational takeaways
- Mark overnight and prior-session reference points before the regular open.
- Distinguish between a level touched overnight and one revisited during regular trading hours.
- Define the opening range gap and its midpoint consistently before evaluating a setup.
- Observe the first fair value gap formed in the relevant direction, while remembering that this is an ICT-specific framework.
- Build conditional scenarios around scheduled data rather than assuming an announcement guarantees direction.
- Specify invalidation, stop logic and partial-exit rules before focusing on targets.
Near the conclusion, ICT cautions viewers that learning his material is not a quick process. Although he makes strong claims about the recurring availability of a “Silver Bullet” setup during the 10:00–11:00 hour, this recording alone does not establish frequency, reliability or profitability. The review is best treated as an explanation of ICT’s interpretation of one session—not as proof of a trading edge or a recommendation to trade NQ futures.[1]
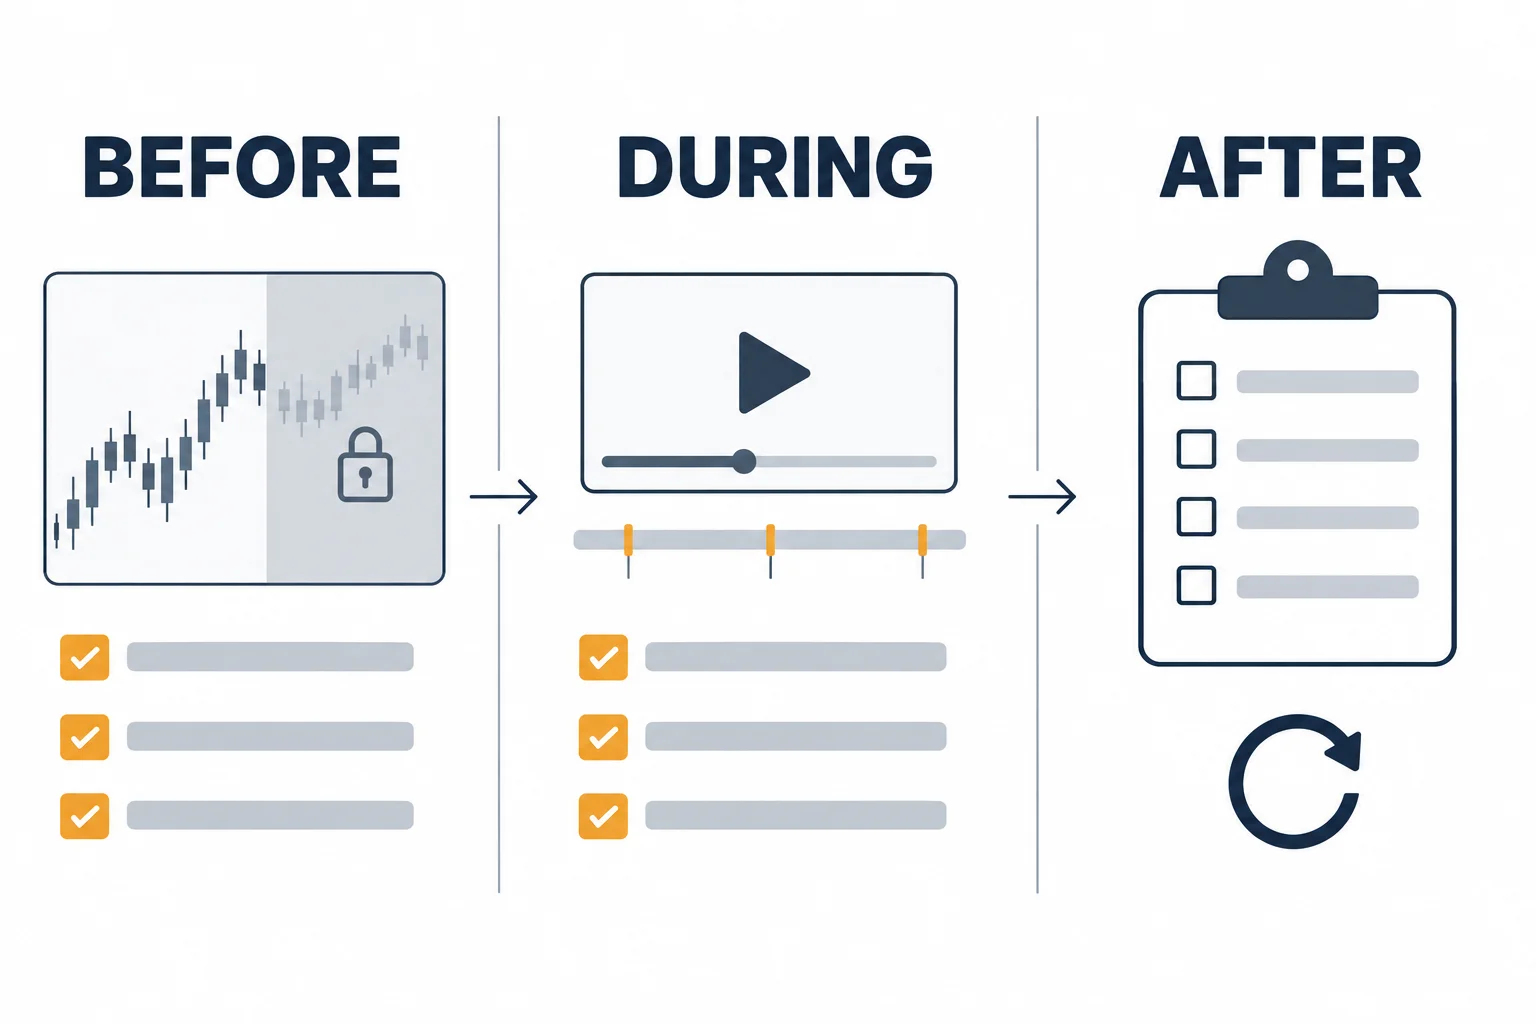
Study the review before, during and after playback
This is an editorial practice routine rather than an additional ICT entry model. Before playback, note the source date and hide later chart action in your own exercise. During playback, pause at the reference-level, opening-gap and trade-management passages above. Afterwards, compare your notes with the explanation and record where your interpretation differed. Replaying one successful example is not a statistical test.
Watch the original NQ futures review
ICT 2025 Lecture Series — NQ Futures Review, April 1, 2025
Use the original recording to inspect the chart details alongside this audio-grounded recap. The embedded player reported owner-disabled playback in a September 14, 2026 test; use the direct watch link instead.
Original-source study resources
ICT points viewers to his earlier day-trading and scalping modules at 1:49–2:28.[1] Find first-party material on The Inner Circle Trader’s channel.[2]
The CFTC’s Learn & Protect resources cover checking registrations and avoiding fraud; the agency warns that no trade or investment is risk-free.[4] For time-zone software context, IANA’s Time Zone Database documents local-time history, UTC offsets and daylight-saving rules. It is not a futures-session calendar.[5]





