
Key takeaways
In the January 27, 2025 lesson, ICT describes a bearish GBP/USD New York-session example using the New Week Opening Gap as a downside reference.
Read the full summary
In the January 27, 2025 lesson, ICT describes a bearish GBP/USD New York-session example using the New Week Opening Gap as a downside reference. The narration begins on a five-minute chart, then discusses an FXCM one-minute chart with a five-minute inversion fair value gap overlaid. The sequence is a structure shift, repeated tests of the inversion area, a break of a prior low and a later “Silver Bullet” continuation toward the weekly gap. The speaker explicitly describes the forex executions as paper trades, not real-money forex results. These notes combine the retrieved captions with review of actual recording frames at 1:00, 4:45, 7:35 and 11:00; they do not independently verify broker fills or profitability.
How we researched this article
BestProps used document-based research from primary firm sources, checked September 14, 2026. The complete source list, scope, limitations, and commercial-state record appear near the end of this article.
The original lesson is 2025 Lecture Series – SMC New York NWOG With Forex 01/27/2025, published by The Inner Circle Trader. The central idea is not “sell every weekly gap.” It is to use a weekly reference alongside an intraday bearish sequence and a specific invalidation area. Captions contain transcription errors, so the explanations below paraphrase identifiable concepts rather than present uncertain wording as exact quotations.
What the January 27 lesson covers
| Video time | Discussion | Meaning for the example |
|---|---|---|
| 0:42–1:16 | GBP/USD five-minute chart; Friday close and Sunday 5 p.m. Eastern open; rallies followed by a market-structure shift | The NWOG is the weekly reference, not a standalone entry signal. |
| 3:03–4:29 | New York-session inversion-gap discussion and a prospective break lower | The speaker connects the intraday bearish structure with a return toward the weekly opening area. |
| 4:39–6:31 | FXCM one-minute chart with the five-minute inversion gap; stop placement and candle bodies near the midpoint | The chart timeframe and the timeframe defining the gap are different. |
| 6:31–7:22 | Repeated tests, a low breaking and a later “10:00 Silver Bullet” | The narrated continuation follows confirmation rather than the first touch of a line. |
| 7:27–8:08 | Short entries, partial exit and covering near the weekly gap; explicit non-real-money forex disclosure | The execution story is a demonstration, not independently verified live performance. |
| 8:10–11:29 | Body-versus-wick behavior, overly tight stops and the move back toward the weekly gap | The recap emphasizes interpreting the sequence rather than claiming every wick invalidates it. |
How ICT identifies the New Week Opening Gap
At about 0:58–1:09, the speaker identifies the space between Friday’s close and Sunday’s opening at 5 p.m. Eastern as the new week opening gap. Later, around 4:39–5:15, he identifies the FXCM GBP/USD feed and discusses differences in the weekly gap across brokers. This matters because spot forex has no single centralized exchange close. A boundary from one feed should not be copied uncritically onto another.
A practical chart record needs the instrument, provider, week and displayed timezone. The IANA Time Zone Database is a reference for clock and daylight-saving rules, not a source of ICT price levels. The Federal Reserve H.10 exchange-rate release likewise does not determine a broker’s weekly opening quote.
The bearish New York sequence
The narration first describes rallies followed by a market-structure shift. Around 3:15, ICT discusses an imbalance that he expected to act as an inversion fair value gap. Price returning to that area matters because a former imbalance is being interpreted as resistance. The bearish case then requires a lower reference to break; the weekly opening gap is the destination being discussed, not the sole reason for a short.
At about 5:15, a five-minute inversion gap is shown over a one-minute chart in the speaker’s description. He describes a short near the area and a stop above a nearby small balanced price range. Around 6:17–6:29, he emphasizes candle bodies remaining in the lower half or near the midpoint, also called consequent encroachment. In this example, wicks above that midpoint are not treated the same as body acceptance above it.
From roughly 6:31–7:22, the narration describes several tests before the referenced low breaks, a return into a smaller fair value gap and a later “10:00 Silver Bullet” move toward the weekly gap. Those times locate the explanation in the recording; they are not an independently measured trade log. The captions alone do not establish the chart’s exact prices or the timing of individual fills.

Entries, exits and the paper-trading disclosure
Around 7:27–7:57, ICT narrates short entries, a partial exit approaching the NWOG and covering between two marked lines rather than continuing to wait for a lower limit order. At 8:00–8:04 he says he is not trading forex with real money. Around 11:17–11:29 he again distinguishes the forex paper trades from the index futures he says he trades with real money. The latter is his statement, not a verified account result.
This distinction prevents the demonstration from becoming a payout, win-rate or live-profit claim. No exact profit, risk/reward ratio, account return or independently confirmed fill is reported here. The captions also refer to earlier Telegram commentary; that separate message history was not reviewed, so its claimed advance timing is not independently established.
What the midpoint does and does not mean
Consequent encroachment means the midpoint of the particular range or imbalance being discussed. The lesson’s repeated midpoint discussion concerns intraday fair value gaps and the inversion area. It should not be rewritten as evidence that every trade was entered at the NWOG midpoint. A midpoint calculation is simple; deciding which range it belongs to is the important analytical step.
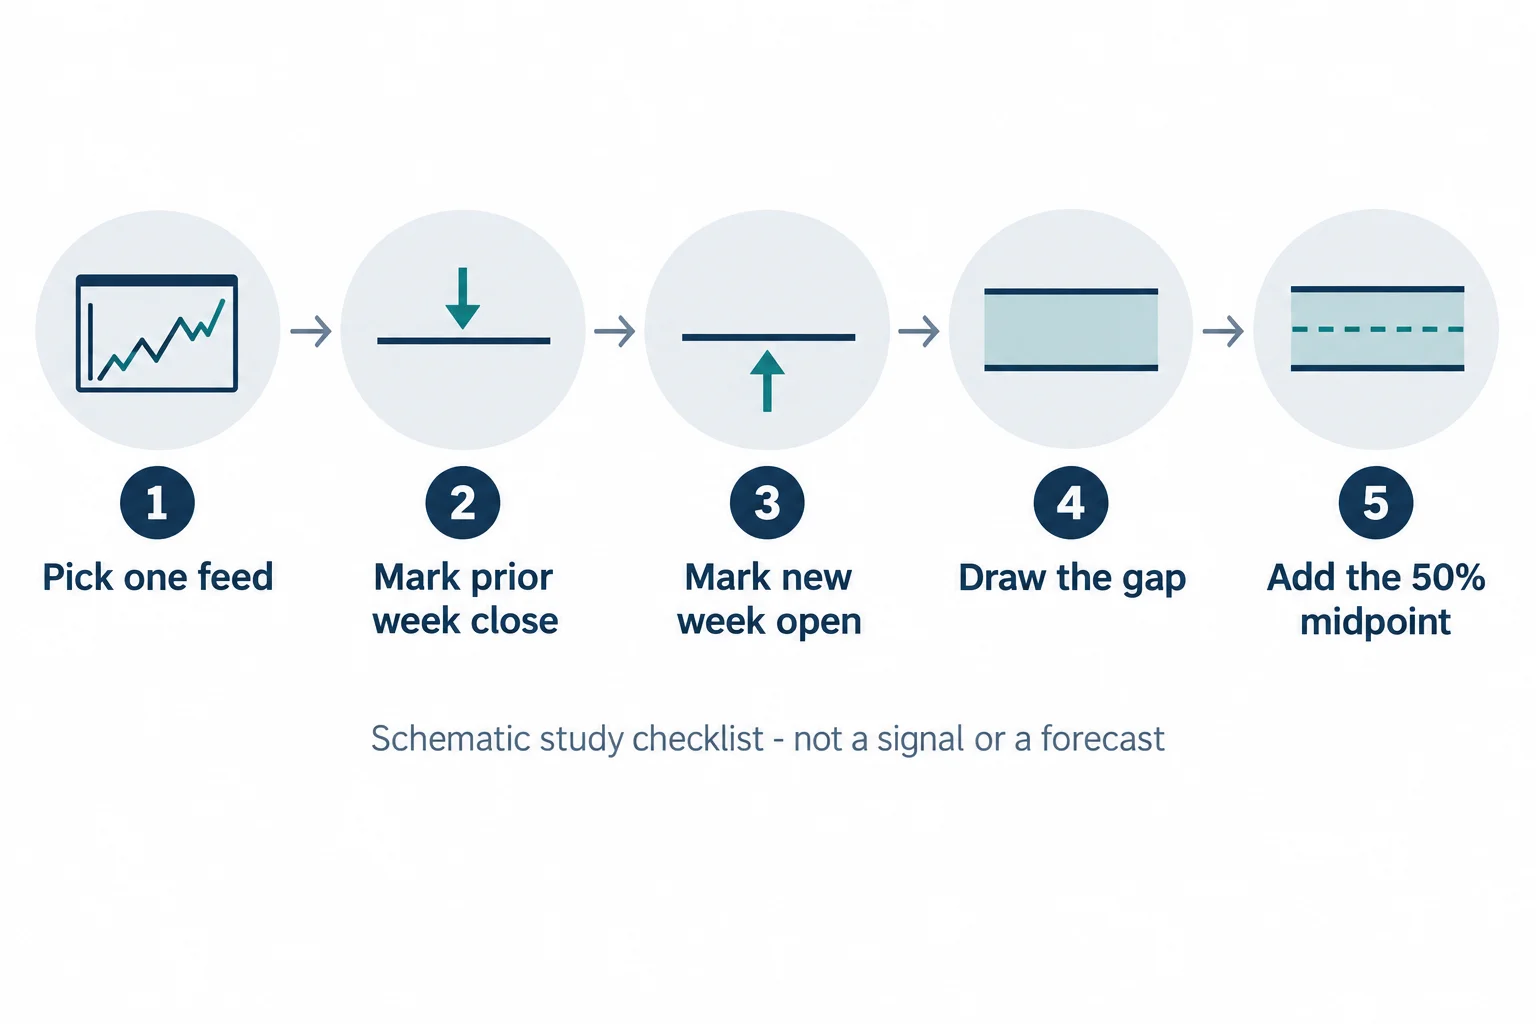
The generic weekly-gap schematic above explains how to record two weekly boundaries and their midpoint. It is an educational illustration, not a screenshot of this lesson or a reconstruction of its executions. A third-party NWOG explainer and a TradingView overview of related concepts provide background, not authoritative evidence of what this upload shows.
Risk and invalidation
A reference gap does not guarantee a return or a profitable reaction. The bearish interpretation depends on the described structure and inversion area continuing to behave as expected. A trader’s invalidation and loss limit must be defined before entry; the lecture’s criticism of excessively tight stops is not permission to widen risk after a trade goes wrong.
Scheduled news can change spreads and execution. Use official schedules such as the FOMC calendar for release dates, without assuming this lesson discussed a particular announcement. Evaluation and funded-account traders must also follow their own current news, holding, sizing and drawdown rules.
Testing should include failed reactions, gaps left unfilled and ambiguous sessions, not only the narrated successful example. Simulated trades do not establish live execution quality or future returns. Leveraged currency trading carries substantial risk; these notes are educational, not individualized financial advice.
Watch the original lesson
Watch the January 27, 2025 ICT NWOG forex lesson on YouTube. The reviewed recording frames show the GBP/USD FXCM five-minute and one-minute charts, the annotated bearish move toward the blue weekly-gap area, and on-chart sell/buy markers. The zone names come from the accompanying narration. Those markers are not independent brokerage proof of live-money fills, and no realized profit is claimed here.





