
Key takeaways
ICT’s high-probability scalping workflow identifies higher-time-frame direction and liquidity targets before seeking entries, then limits execution to a session window and refines setups from 15-minute to five-minute and one-minute charts.
Read the full summary
ICT’s high-probability scalping workflow identifies higher-time-frame direction and liquidity targets before seeking entries, then limits execution to a session window and refines setups from 15-minute to five-minute and one-minute charts. In GBP/USD, ICT treats an old daily low as potential support, targets equal highs and buy-stop liquidity around 1.3180 with a possible extension 10 to 20 pips beyond the prior high, and focuses on the New York kill zone from roughly 7 to 9 a.m. New York time after a London swing low. His Power of Three model describes accumulation, manipulation forming the low, and expansion higher. Fibonacci measurements use candle bodies rather than full wicks, producing about 79% on the 15-minute chart and 70.5% after recalibration on the five-minute chart, while the one-minute setup adds a market-structure break and retracement. In EUR/USD, a bullish daily bias follows a sweep below an old low and recovery above a later candle high, with equal highs near 1.1650 as liquidity, a post-7 a.m. 62% retracement as a possible entry, targets 10 to 20 pips above the highs, and 1.1680 as a hoped-for objective. ICT says the EUR/USD move did not offer the desired opportunity and acknowledges missing a high candle. The lesson is educational commentary on ICT’s framework, not verified evidence of fills, profitability, or predictive reliability, and live results remain exposed to spread, slippage, changing structure, and an incorrect directional premise.
How we researched this article
BestProps used document-based research from primary firm sources, checked September 25, 2026. The complete source list, scope, limitations, and commercial-state record appear near the end of this article.
In ICT Supplemental Session 01 – Mastering High Probability Scalping, ICT expands on concepts from an earlier three-part scalping series. Using GBP/USD and EUR/USD examples, he explains how he forms a directional idea, identifies liquidity near old highs, selects a trading-session window, and refines a hypothetical entry from a 15-minute chart down to five- and one-minute charts.
The lesson is best understood as a walkthrough of ICT’s own market framework, not proof that its setups are consistently predictive or profitable. The transcript records his interpretation of charts shown in the video, but it cannot independently verify the displayed prices, orders, fills, or later outcomes.
ICT Scalping Targets and Likely Price Destinations
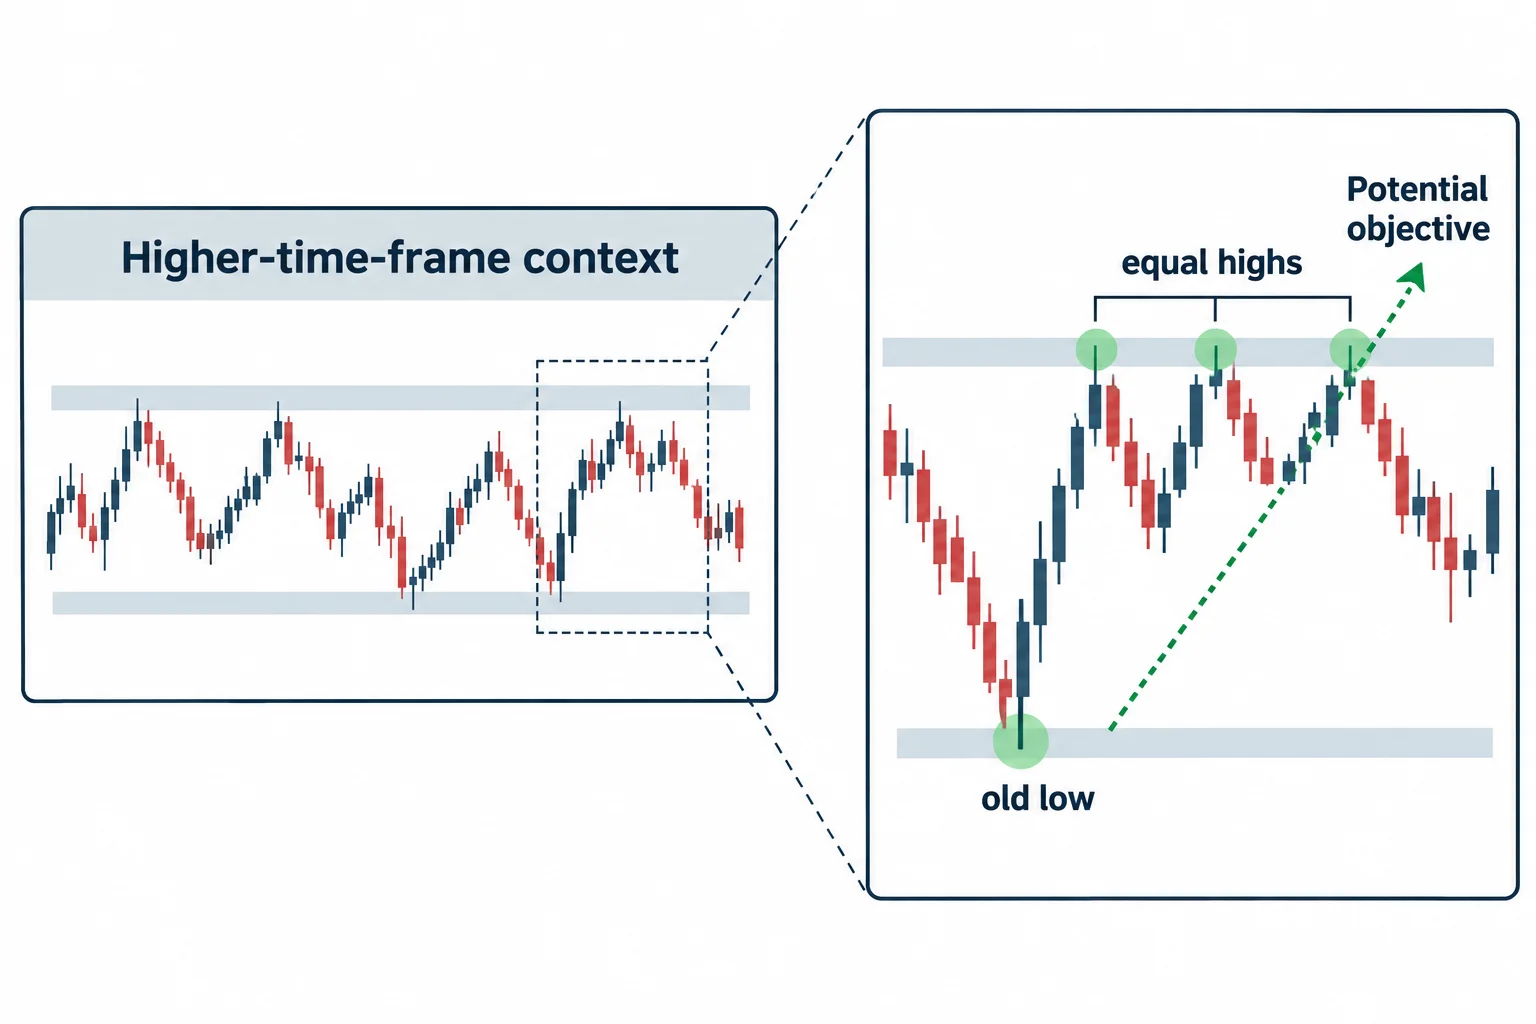
ICT begins with GBP/USD, commonly called “cable,” on the daily chart. He describes it as being inside a broad trading range, which makes a simple directional reading from daily swing points less useful. He therefore moves to the hourly chart and treats a revisit of an old low as potential support rather than automatically expecting a downside breakout.
At 2:06, he introduces the lesson’s central question: if the old low holds, where is price likely to be drawn next? His answer is the opposite side of the range, particularly a group of relatively equal highs. ICT interprets stops above those highs as potential liquidity and describes them as a possible objective for an upward move.
This reverses the order in which many beginners approach a setup. Instead of finding an entry first and then choosing an arbitrary profit target, ICT proposes:
- Establish the higher-time-frame context.
- Identify an old high or low that may attract price.
- Define the target area before considering an entry.
- Use lower time frames to look for a retracement consistent with that idea.
ICT Scalping Liquidity Around Equal Highs
Beginning around 2:35, ICT discusses horizontal levels that appear unusually clean or uniform. In his interpretation, traders may sell near repeated highs and place protective buy stops just above them. He consequently treats equal highs (often called a double top) as a liquidity area that price may trade through, rather than as resistance that must hold.
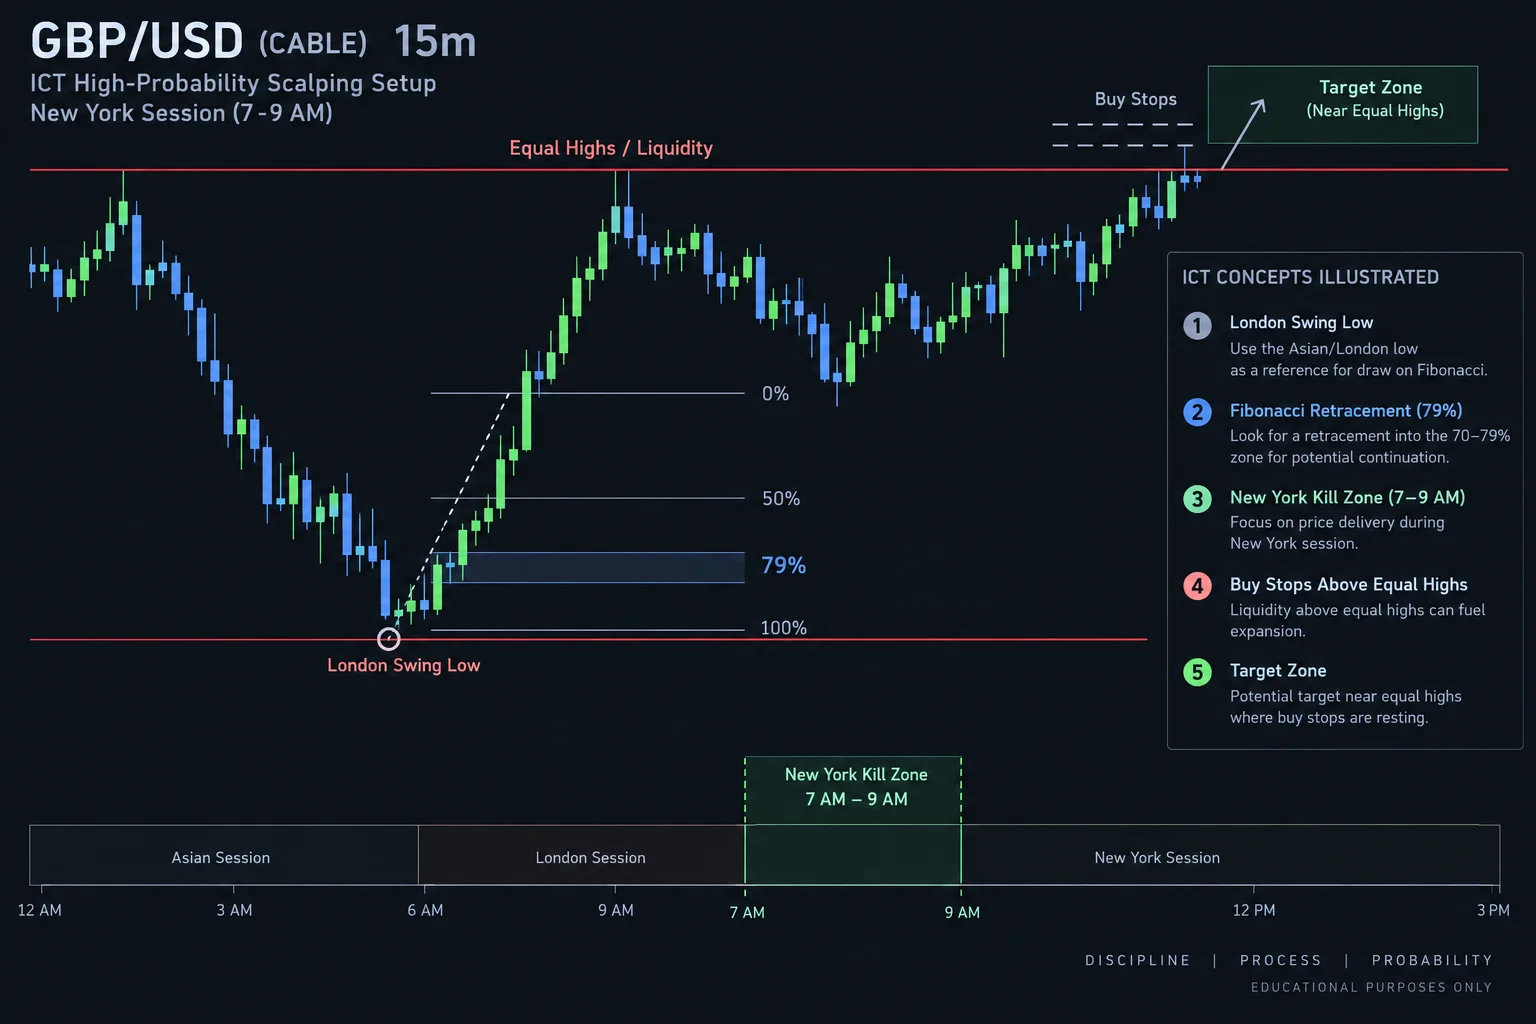
For the GBP/USD example, he identifies an old-high area around 1.3180 and discusses a zone extending approximately 10–20 pips beyond a prior high. Those figures are specific to his chart demonstration and should not be generalized into a guaranteed rule. He also says he preferred an earlier exit near what he calls an “institutional level,” although the transcript alone cannot establish the exact execution or fill.
ICT Scalping Session Timing and Trade Planning
On the 15-minute chart, ICT focuses on what he calls the New York “kill zone,” described in this lesson as roughly 7:00–9:00 a.m. New York time. At 7:18, he emphasizes marking the analytical reasons and exit plan on the chart before taking a position. His stated purpose is to reduce impulsive changes when price fluctuates.
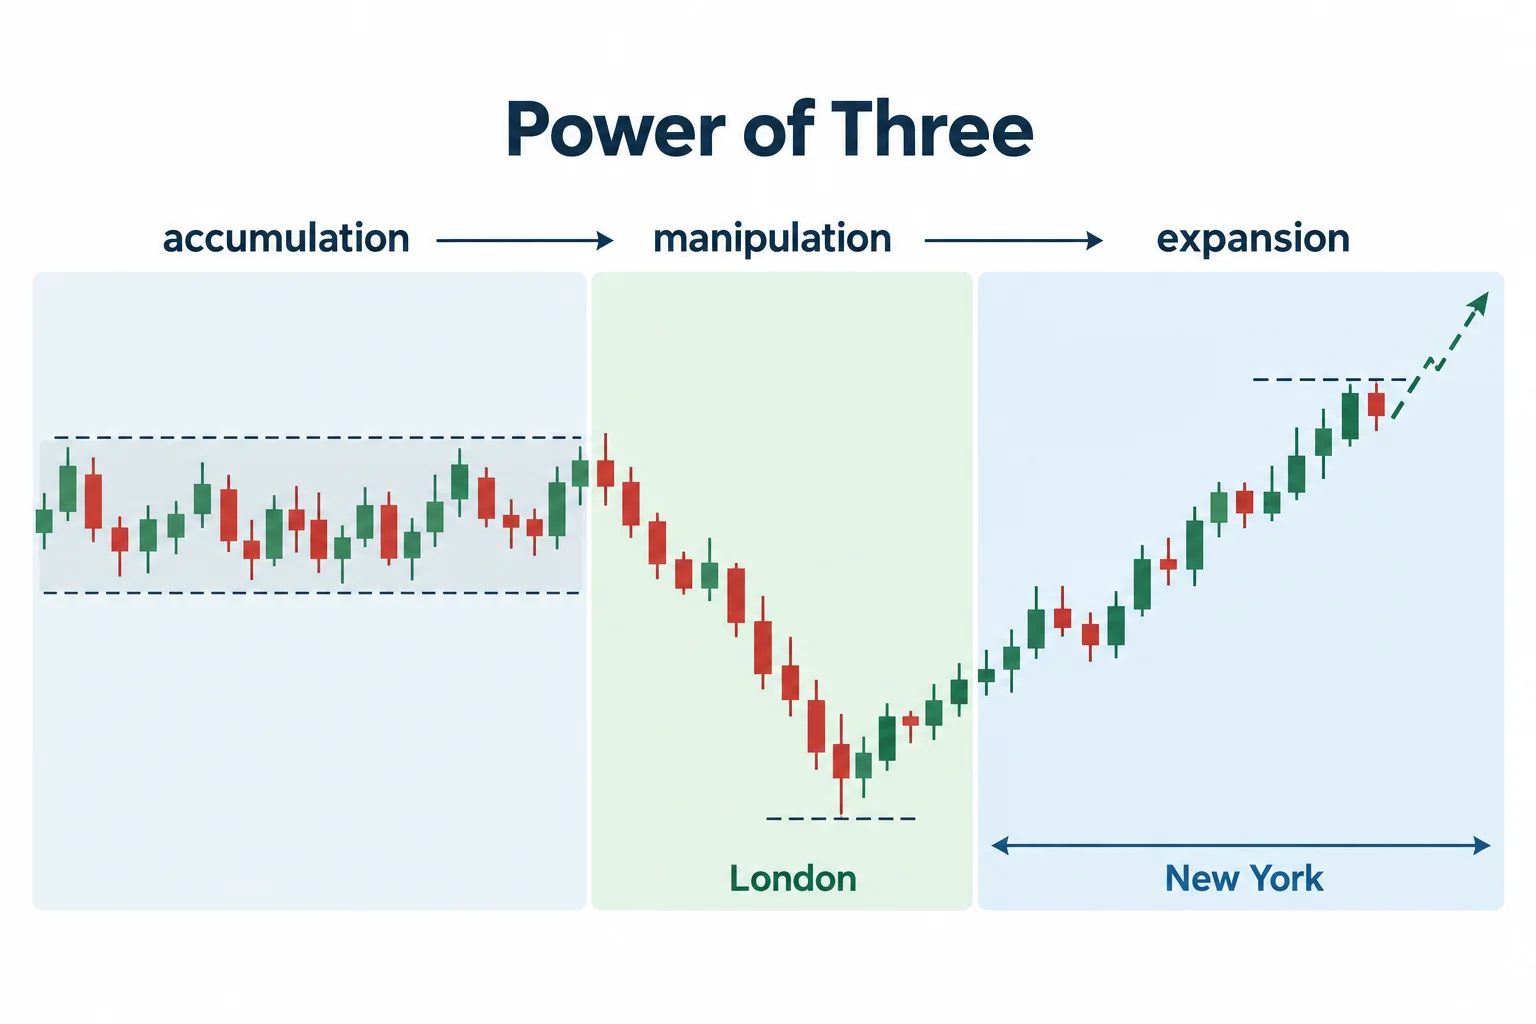
He then looks back into the preceding London session for a reference swing low. Under his proposed bullish scenario, London has formed the low of the day and New York may continue upward toward the previously identified highs. ICT connects this sequence to his “Power of Three” terminology: accumulation, a manipulation phase that creates the low, and subsequent expansion higher.
These labels are part of ICT’s educational model. A broader, framework-neutral interpretation is that the trader is combining market context, time-of-day constraints, a defined invalidation area, and a preselected destination. None of those elements removes uncertainty, and the same visual pattern can fail or be identified differently in real time.
Mastering ICT Scalping Across Time Frames
At 9:00, ICT measures a retracement using candle bodies rather than the full wick range. He draws the Fibonacci measurement from the lowest body open or close to the highest body open or close before the decline. On the 15-minute example, he highlights a retracement near 79% while maintaining the 1.3180–1.3190 area as the anticipated draw.
He subsequently recalibrates the measurement on a five-minute chart, where the relevant retracement is closer to his 70.5% level. This illustrates an important feature of the presentation: the exact percentage changes as the selected swing and time frame change. The Fibonacci level is therefore not presented in isolation; ICT uses it only after establishing session timing, directional bias, and a liquidity target.
For someone who missed the first retracement, the lesson moves to a one-minute chart at 13:09. ICT identifies a smaller version of the pattern: a market-structure break, a retracement toward the measured level, and continuation toward the higher-time-frame objective. This is his explanation of how a lower-time-frame entry might align with a broader intraday thesis, not evidence that every such retracement provides a viable trade.
ICT Scalping Concepts in the EUR/USD Example
At 14:36, ICT applies a similar process to EUR/USD. He describes a daily bullish bias after price trades below an old low, forms a swing low, and then moves above a subsequent candle high. On the intraday chart, two nearby highs around 1.1650 become the proposed liquidity objective.
After the London-session decline, he looks for a post-7:00 a.m. New York retracement and highlights a 62% Fibonacci level as a possible long-entry area. He discusses potential objectives 10–20 pips above the old highs and mentions 1.1680 as a hoped-for upper objective. Near the end, however, he says the move did not provide the opportunity he wanted at that level and that he missed a high candle. This qualification matters because the transcript does not establish a complete trade record or exact realized result.
Mastering the Main ICT Scalping Concept
ICT summarizes the lesson at 19:28: first determine where price may be drawn, especially around old highs or lows, and only then search for an entry. The recurring workflow is higher-time-frame context, a liquidity objective, a defined session window, retracement analysis, and lower-time-frame refinement.
Related ICT Scalping Session Resources
For traders who want to study ICT’s framework from first principles:
- The Inner Circle Traders (ICT Trading from first principles) (unofficial educational resource)
- ICT Trading: Profitable Guide To Inner Circle Trading (unofficial educational resource)
- ICT Core Content Month 1 Notes (unofficial educational resource)
Third-party resources are unofficial and untested. They are listed for reference only and do not constitute endorsement.
This material is educational commentary on ICT’s stated methodology, not investment advice or a promise of performance. Historical chart examples can look clearer after the fact, while live execution involves spread, slippage, rapidly changing structure, and the possibility that the underlying directional premise is wrong.

