
Key takeaways
In a two-and-a-half-minute clip, ICT narrates an NQ futures position he is managing to the upside: he says he is looking for a run on an older hourly swing high just under 11,000 (0:07), adds to the position as a displacement move holds (0:15), treats a fair value gap and an order block as the…
Read the full summary
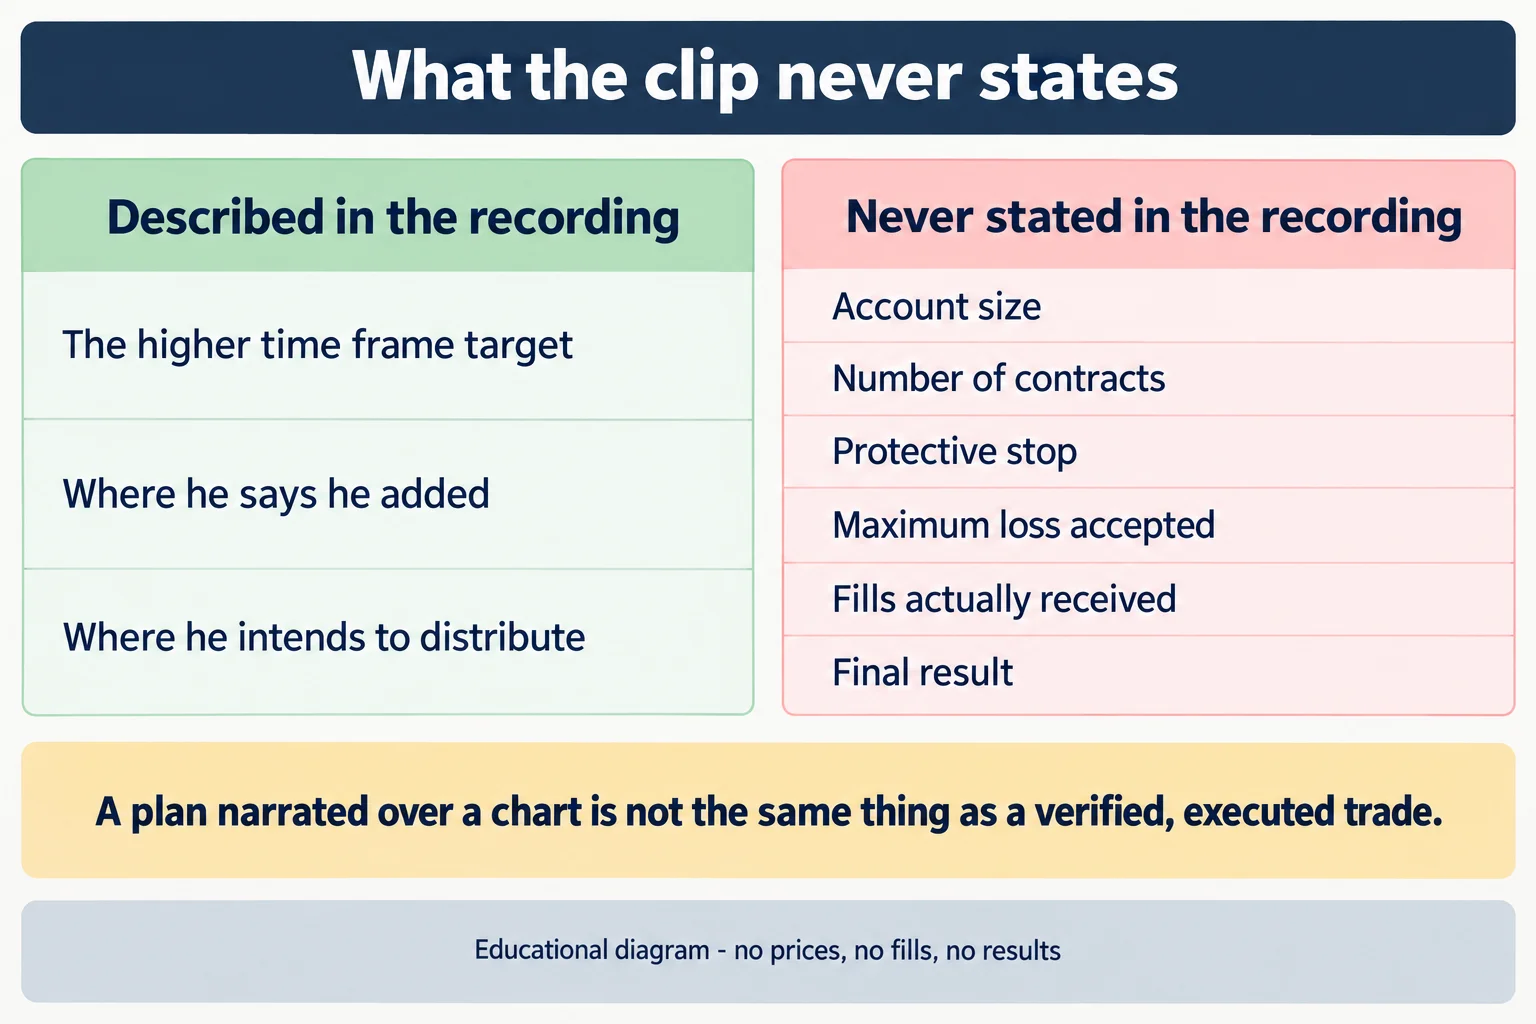
In a two-and-a-half-minute clip, ICT narrates an NQ futures position he is managing to the upside: he says he is looking for a run on an older hourly swing high just under 11,000 (0:07), adds to the position as a displacement move holds (0:15), treats a fair value gap and an order block as the areas he will buy from (1:06), describes a dip that swept short-term sell stops around 10,950 (1:12), and says he intends to distribute into buy-side liquidity above before price reaches roughly 10,997 (1:48). It is a narration of a plan over a chart, not a record of an executed trade: the clip never states account size, contract quantity, protective stop, maximum loss accepted, fills received or the outcome. Every level and every expectation below is the speaker’s own, taken from automatic captions, and is unverified.
How we researched this article
BestProps used document-based research from primary firm sources, checked September 24, 2026. The complete source list, scope, limitations, and commercial-state record appear near the end of this article.
The recording is NQ Futures Live Execution & Trade Management, published by The Inner Circle Trader on 29 December 2022 and about two and a half minutes long. It is a live-execution clip rather than a lecture: no session date is spoken in it, and the speaker moves straight into the position he is already holding. It illustrates how he narrates target selection, scaling and liquidity-based management; it does not demonstrate a completed trade or a repeatable edge.
What he says he is positioned for
He opens on the Nasdaq and says he is looking for a run on an older hourly swing high sitting just under 11,000 (0:03 and 0:07), then straight away says he is adding more and “pyramiding it in” (0:15). He does not spell out the direction in as many words, but the upside reading follows from the rest of the clip, where he points to buy stops above the market as the objective and describes larger participants’ short positions as protected by stops overhead (1:25 and 1:36). The captions never name the contract; the upload title and channel say NQ futures.
In his framework the prior hourly high is not a price to trade against but a place where orders may be resting, which is what he means when he calls it a draw on liquidity (0:47). The clip treats that higher-time-frame level as the objective and everything else as the route to it. Whether older swing highs reliably attract price is his interpretation, not something this recording tests.
Displacement, the imbalance, and where he says he adds
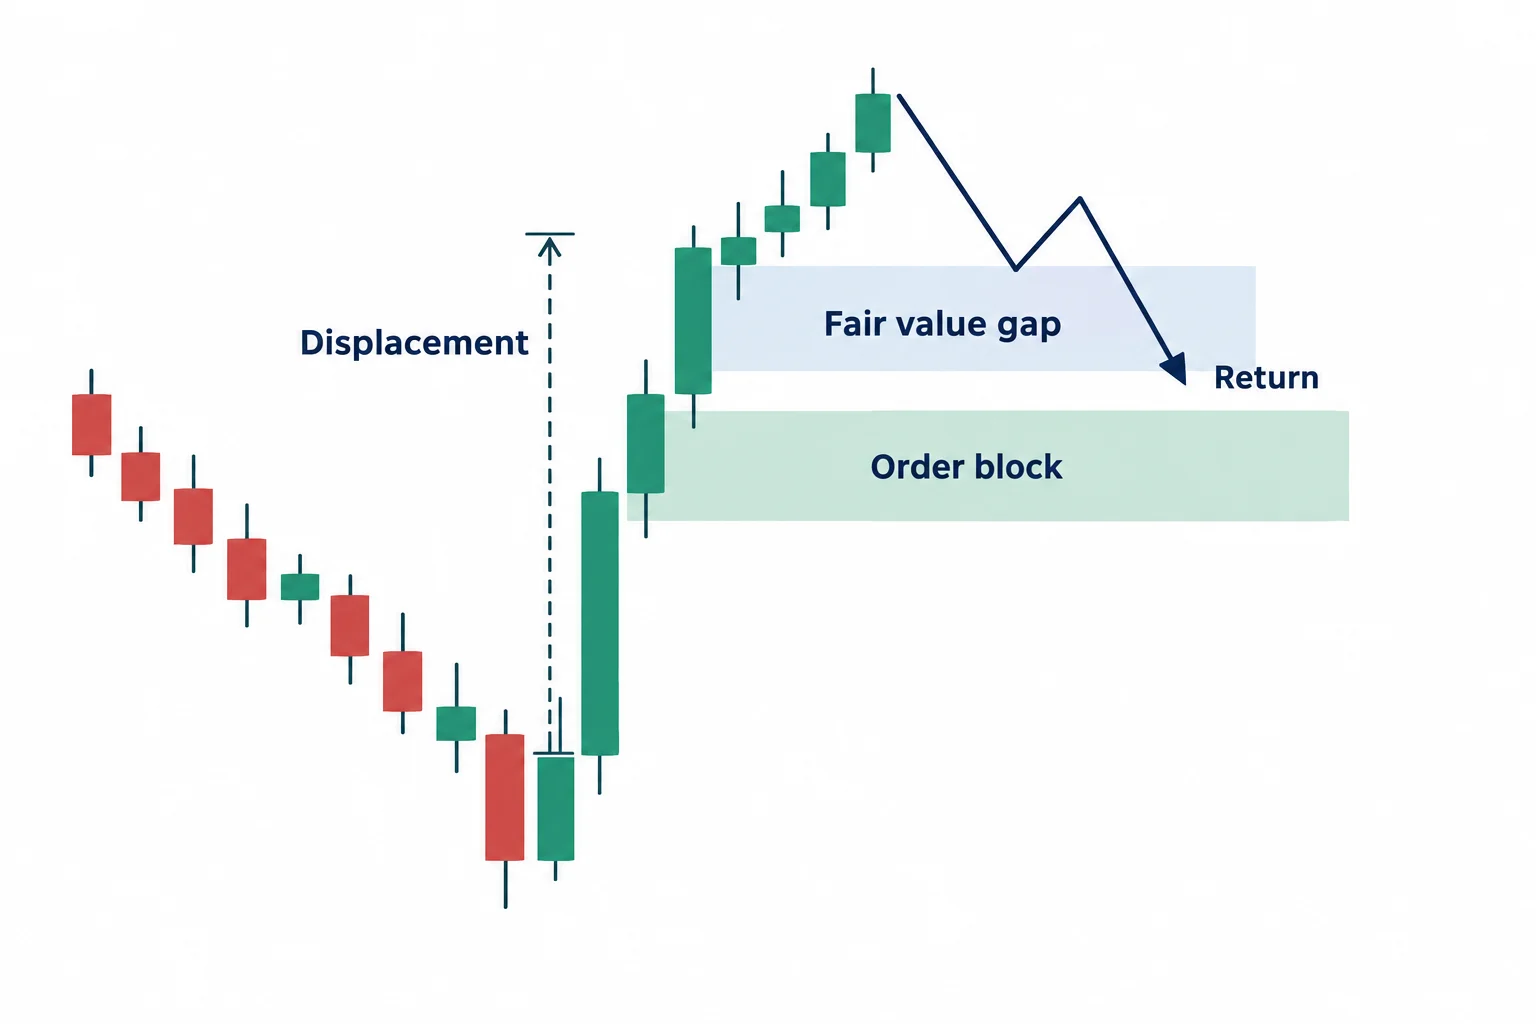
He points to a displacement move and says he wants it to stay intact, and specifically that he does not want to see price trading back inside the range that created a fair value gap; he has drawn a line for it (0:23 and 0:32). He adds that he does not think price will go below that line but would be willing to buy anything toward the low marked by a short blue trend line segment (0:35 and 0:41). Those are two different things at once: a structural expectation that the imbalance holds, and a standing willingness to add if price trades down toward a marked level anyway.
When price comes back close to the gap he says it is fine, that he is going to buy in there and add more, and that he is essentially trading inside an order block (1:04, 1:06 and 1:11). He then describes what preceded it as a small run on short-term sell stops resting around the 10,950 level, and says price will not go back below that again (1:12 and 1:20). He also refers to a fair value gap on a smaller chart, which the captions render as a 15-minute gap, as the place where he says smart money accumulated longs (0:54). Who actually traded there is not something captions or an unseen chart can establish, and pyramiding increases exposure quickly while the clip states no stop and no size.
The stop run and the liquidity pools above
He says large ranges are expected on the upside and that retail buy stops are in the crosshairs (1:22 and 1:25), then says retail has been smoked and that he is now focusing on the large funds (1:30 and 1:34). He says those larger participants’ short positions are protected by stops resting above a level, and that he is not expecting the fair value gap below to fill (1:36 and 1:42). The price he gives for that overhead stop is rendered by the automatic captions as a run-together figure that cannot be read as a single number, so it is left unresolved here rather than guessed at.
He closes the sequence by naming what he calls the new retail 2.0 buy stop liquidity pool, saying it will be engaged and that price will then run into the 10,997 level and allow him to get his distribution off (1:48, 1:54 and 1:58). Read in his terms, distribution means reducing or exiting the position into the buying he expects above, rather than adding once the objective is reached. “Retail 2.0” is his label for that pool, not a measured observation of the order book.
Which chart he is reading, and how the clip ends
His last chart instruction is to watch the chart in the upper-left corner, which he calls the hourly chart he is going to refer to, and he says the same level appears on the one-minute chart on the right-hand side, which he calls the largest chart (2:07, 2:10 and 2:16). That pairing is the practical point of the clip: the execution commentary runs on a fast chart while the objective is set on the hourly one.
He finishes by telling viewers to ignore what he calls fake rejections and the “supposed dois” the captions record — which in context reads as his shorthand for draws on liquidity — and to wait for a deeper move (2:20 and 2:23). The final caption is cut off mid-sentence, and the recording ends there.
What the clip does not establish
- No session date is spoken, and no order ticket, statement or account balance appears. The upload date is 29 December 2022; which trading day the clip shows is not established by the source.
- Account size, number of contracts, average price, protective stop and the maximum loss he was prepared to accept are all absent, so the risk actually carried cannot be reconstructed.
- The 10,950 and 10,997 levels are the speaker’s own readings, taken here from automatic captions, and are not independently verified. A third level in the clip is rendered as a run-together figure and is treated as unresolved rather than as a price.
- No fill, partial or final result is shown. A plan narrated over a chart is not the same evidence as an executed, profitable trade, and nothing here is a recommendation to copy the sequence.
- “Smart money”, “retail has been smoked” and “draw on liquidity” are the speaker’s characterisations of order flow. They are reported as his interpretation, not as verified facts about who was trading.
Watch the original recording
NQ Futures Live Execution & Trade Management
The Inner Circle Trader · published 29 December 2022 · about 2 minutes 30 seconds. This is the primary source for this article; every timestamp link above points into it.
The video is not embedded here because the owner has disabled playback on other websites. That was checked directly on 15 September 2026 from a BestProps page origin: the embedded player loads and returns “Playback on other websites has been disabled by the video owner” instead of playing, so no empty player is left on this page.
The watch page was read on 15 September 2026 and rendered as a public, listed video: NQ Futures Live Execution & Trade Management by The Inner Circle Trader, published 29 December 2022, listed duration 150 seconds, about 186,700 views, playback on other sites disabled by the owner. The scheduling inventory used for this article lists the same upload under 29 December 2022, so the two agree. The description on that page is a standard hypothetical-performance disclaimer rather than commentary on this clip.
Resources
These are the sources checked for this article. The regulator and investor-education pages are general material about futures and about trading systems sold to the public; neither assesses the speaker, verifies any level quoted above, nor endorses anything said in the recording. Any ICT, smart-money or third-party indicator, script, note set, transcript pack, chart annotation or re-upload circulating outside the publishing channel’s own page is unofficial and untested here.
- [1] NQ Futures Live Execution & Trade Management — The Inner Circle Trader (primary source; watch page read 15 September 2026, 150 seconds).
- [2] The Inner Circle Trader — official YouTube channel (read 15 September 2026).
- [3] Investor.gov — Glossary: Futures (read 15 September 2026) — general background on what a futures contract is.
- [4] CFTC — Fraud Advisory: Commodity Trading Systems Sold on the Internet (read 15 September 2026) — how hypothetical or simulated results are presented to the public.
Source: ICT, NQ Futures Live Execution & Trade Management, The Inner Circle Trader, 29 December 2022. Automatic YouTube captions were the transcript used for this article. This commentary is educational and is not investment advice.

