
Key takeaways
In 2023 Preview… Precision Inc., a three-minute clip published on 28 December 2022, ICT walks through a short-side model on a one-minute chart.
Read the full summary
In 2023 Preview… Precision Inc., a three-minute clip published on 28 December 2022, ICT walks through a short-side model on a one-minute chart. He says buy-side liquidity was purged and that market structure shifted bearish below the nearby lows (0:46 and 0:51), names the return into the block as the model entry he teaches on his YouTube channel (0:56), says he pyramids again at the last up-close candle (0:13), and sets the objective at sell-side liquidity, a relative equal low and two deeper discount arrays below (1:34). He reports a second partial already added (0:30) and repeatedly says his stop is nowhere near the market. No account size, contract count, entry prices, stop price or final result is given, and the automatic captions mangle several of his terms and one price, so the levels below are reported as he said them and are not independently verified.
How we researched this article
BestProps used document-based research from primary firm sources, checked September 24, 2026. The complete source list, scope, limitations, and commercial-state record appear near the end of this article.
The recording is short and demonstrative rather than explanatory: he opens by saying he is showing the model from 2022 using entries in close proximity (0:01). The captions are automatic YouTube captions, the reviewer did not see the chart, and nothing in this clip establishes that the model works or that the narrated orders were filled as described.
The setup he describes: liquidity purged, then a bearish shift
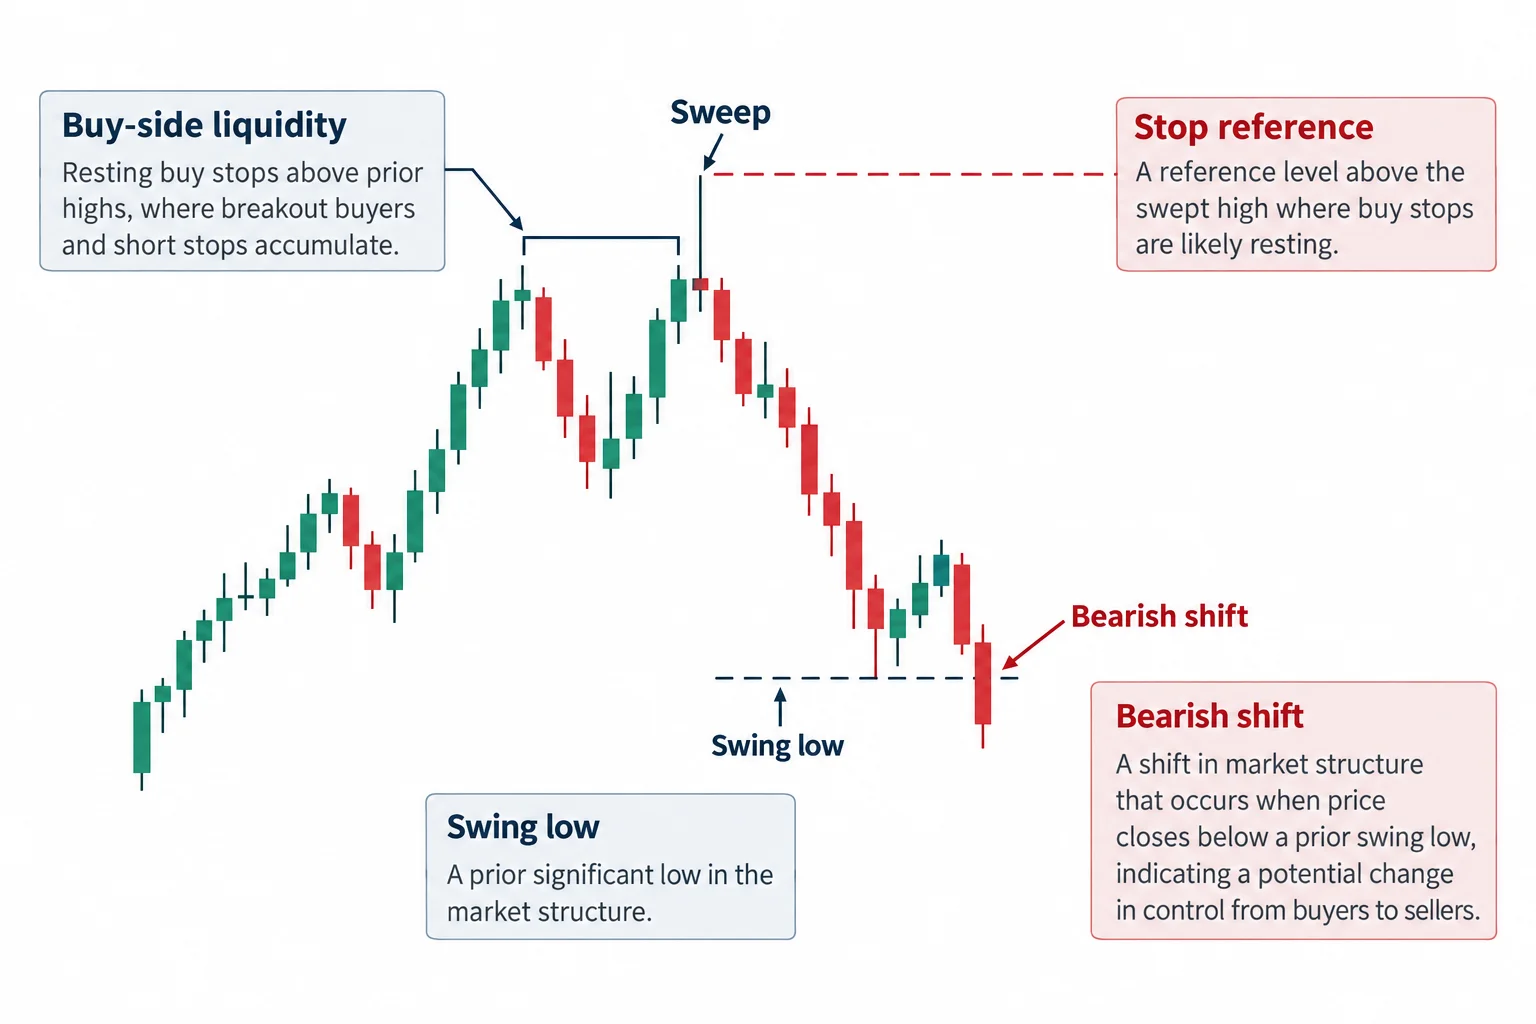
He says the framework starts with buy-side liquidity that “was purged”, followed by a shift in market structure that is bearish below the nearby lows (0:46 and 0:51). Within his framework that ordering matters: the stop run above comes first and supplies the context, and only then does the break of structure give the trade a direction.
He then points at the entry he would take from the material he publishes, saying that if you were using just the 2022 model from his YouTube channel, that break-and-return would be your entry (0:56 and 1:01). For invalidation he says the stop would sit above the high — the highest point of the fractal shown on the one-minute chart — with the pyramid placed at the bottom of the bearish block (1:04, 1:06 and 1:11).
How he builds and manages the position
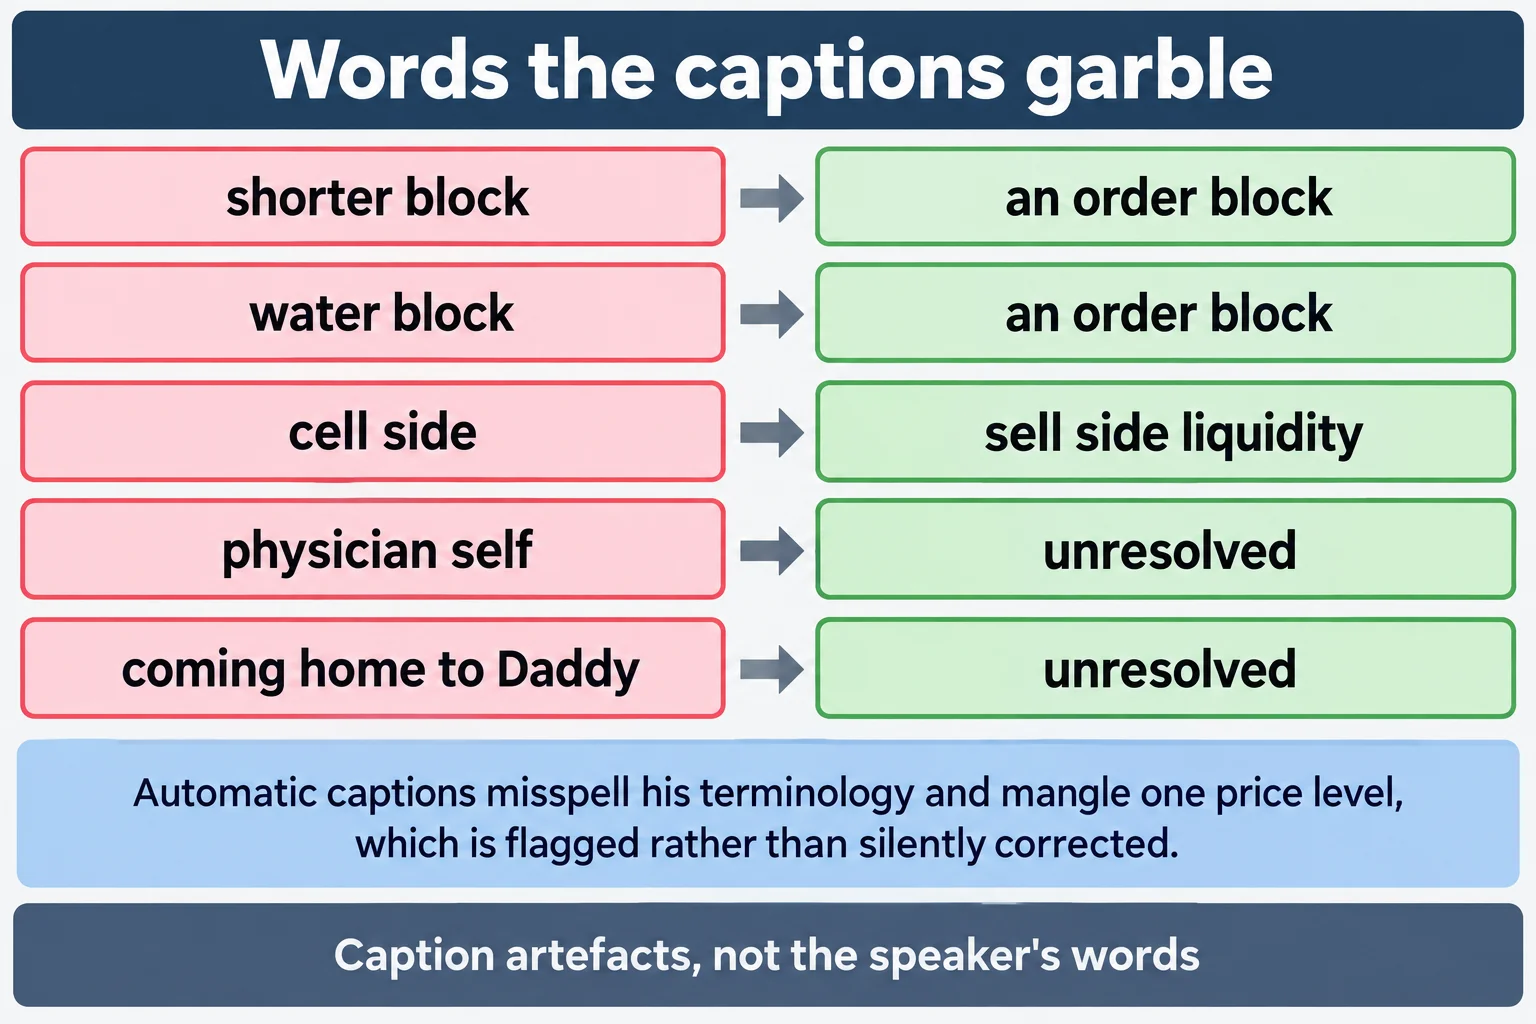
He says he is using what the captions render as a “bigger shorter block” to enter, and that he will pyramid an entry as price digs up into the last up-close candle (0:07 and 0:13). In context, “shorter block” and the later “bearish water block” both read as the caption’s rendering of an order block; the words are flagged rather than silently corrected, because the reviewer could not see the chart. He also says a second partial had already been added at that point in the recording (0:30).
Twice he points out that his stop loss is nowhere near the market and that he is not concerned about it, and later that it is completely outside the range (2:15 and 2:50). That is his own description of his risk placement. It is not the same as a stated stop price or a stated maximum loss, and neither is given in the clip, so how much he had at risk cannot be reconstructed from this source.
The objectives below: sell-side liquidity and discount arrays
He draws attention to where he expects price to be delivered (1:18 and 1:19). He points out a bullish breaker, which he says is the dotted blue line framing an up-close candle, and a fair value gap he is not in, and says there are two discount arrays below the sell-side liquidity pool (1:25, 1:31 and 1:34). His instruction is to watch how price delivers beyond the relative equal low and into a deeper discount (1:38 and 1:42).
He also refers to consequent encroachment, and immediately adds that this is not support and resistance (1:52 and 1:54). In the vocabulary he uses elsewhere, consequent encroachment is the midpoint of an imbalance or range rather than a barrier. Which midpoint he is marking on the unseen chart cannot be reconstructed from captions alone, so no price is asserted for it here.
Displacement, low volatility and the levels the captions garble
He says he is looking for a displacement lower and repeats that the focus should be downward, on price being delivered into the discount arrays (2:00, 2:07 and 2:10). He notes a small volume imbalance, calls the conditions very low volatility with not a lot of movement, and says the precision elements are still there (2:25 and 2:33).
Two price readings follow, and both are reported here as the captions render them rather than resolved into numbers. He says he wants price to remain below a level the captions show as a run-together figure, preferably below a second one at the maximum (2:39 and 2:43). Near the end he notes a fair value gap right above another run-together figure that he does not believe needs to be traded back to (2:55 and 2:59). Because the automatic captions compress those digits and the reviewer did not see the chart, none of them is asserted here as a price level.
Where the clip stops, and what it does not establish
His closing remarks are that the delivery looks nice, followed by a phrase the captions render as “my typical physician self” and then “coming home to Daddy” (3:03 and 3:14). Given the title’s use of “Precision”, the first phrase is plausibly the caption mishearing “precision”, but that is a reading and not a certainty, so it is left flagged. The second is his own informal phrasing and is not a technical term.
- No session date is spoken. The upload date is 28 December 2022 and the inventory agrees with it; which trading day the one-minute chart shows is not established by the source.
- Account size, number of contracts, average entry, stop price and maximum accepted loss are absent. “My stop is nowhere near the market” is his description of placement, not a stated risk figure.
- The claim that a second partial had been added is his own narration. No order ticket, fill, statement or account balance appears anywhere in the clip.
- The levels he reads out are damaged by automatic captions and are not asserted here as numeric prices. Sell-side liquidity, the relative equal low and the discount arrays are his labels for chart locations, not independently verified areas.
- “Liquidity purged”, “displacement” and “the algorithm will want to seek” are his characterisations of price action. They are reported as his framework, not as verified facts about who traded or why price moved.
- The clip shows no completed outcome. A three-minute walkthrough of a setup is not evidence of a repeatable edge or of realised profit, and nothing here is a recommendation to copy the sequence.
Watch the original recording
2023 Preview… Precision Inc.
The Inner Circle Trader · published 28 December 2022 · about 3 minutes 17 seconds. This is the primary source for this article; every timestamp link above points into it.
The video is not embedded here because the owner has disabled playback on other websites. That was checked directly on 15 September 2026 from a BestProps page origin: the embedded player loads and returns “Playback on other websites has been disabled by the video owner” instead of playing, so no empty player is left on this page.
The watch page was read on 15 September 2026 and rendered as a public, listed video: 2023 Preview… Precision Inc. by The Inner Circle Trader, published 28 December 2022, listed duration 197 seconds, about 75,500 views, playback on other sites disabled by the owner. The scheduling inventory used for this article lists the same upload under 28 December 2022, so the two agree.
Resources
These are the sources checked for this article. The regulator and investor-education pages are general material about futures and about trading systems sold to the public; neither assesses the speaker, verifies any level quoted above, nor endorses anything said in the recording. Any ICT, smart-money or third-party indicator, script, note set, transcript pack, chart annotation or re-upload circulating outside the publishing channel’s own page is unofficial and untested here.
- [1] 2023 Preview… Precision Inc. — The Inner Circle Trader (primary source; watch page read 15 September 2026, 197 seconds).
- [2] The Inner Circle Trader — official YouTube channel (read 15 September 2026) — the channel he references when he says the model comes from his YouTube material.
- [3] Investor.gov — Glossary: Futures (read 15 September 2026) — general background on what a futures contract is.
- [4] CFTC — Fraud Advisory: Commodity Trading Systems Sold on the Internet (read 15 September 2026) — how hypothetical or simulated results are presented to the public.
Source: ICT, 2023 Preview… Precision Inc., The Inner Circle Trader, 28 December 2022. Automatic YouTube captions were the transcript used for this article. This commentary is educational and is not investment advice.

