
Key takeaways
ICT’s trading-in-consolidations lesson is a May 2017 Amplified day-trading and scalping teaching that works top-down: read order flow on the daily chart, use the four-hour as the confirming directional reference, and only then study an hourly or 15-minute range (0:39).
Read the full summary
ICT’s trading-in-consolidations lesson is a May 2017 Amplified day-trading and scalping teaching that works top-down: read order flow on the daily chart, use the four-hour as the confirming directional reference, and only then study an hourly or 15-minute range (0:39). Lower-time-frame price action is what he calls subordinate to that higher-time-frame direction, so in a bearish daily or four-hour context a rally above a short-term high inside the range is treated as a run on buy stops rather than a bullish breakout, and in a bullish context a drop below a short-term low is treated as a run on sell stops rather than a break in structure (9:01). He calls the orders stacked above and below a range the “open float” (3:31), defines equilibrium as the midpoint — the fair value of the range — and says the conservative objective after an expansion is a return to equilibrium, not a guaranteed move to the opposite edge (12:29). The lesson lists no rules for measuring order flow objectively, contains no backtest, fills, risk parameters or verified outcomes, and does not establish that fading breakouts is profitable. This article is built from the timestamped captions of the recording.
How we researched this article
BestProps used document-based research from primary firm sources, checked September 24, 2026. The complete source list, scope, limitations, and commercial-state record appear near the end of this article.
In ICT Mentorship Core Content – Month 09 – Trading In Consolidations, ICT presents the fourth lesson of the May 2017 ICT Mentorship, described on the recording as ICT Amplified day trading and scalping (0:15). The YouTube upload recorded in the video’s own metadata is 11 October 2022, and the recording runs about 21 minutes; the lesson dates its own content to May 2017, so every reference below belongs to that teaching rather than to the upload date.
He frames the lesson around one question: what is order flow telling you on the daily, and is price suggested to go higher or lower, with the four-hour chart as what he calls the last line of defence for directional bias (1:00). Two points are stated from the start that keep the rest of the lesson in perspective: he wants the daily and four-hour to agree before looking at a lower-time-frame consolidation, and he explicitly says he does not always expect price to reach the far side of the range. The lesson is educational commentary on his own framework, it is not investment advice, and the transcript cannot show the chart levels he points at or establish that his readings were correct.
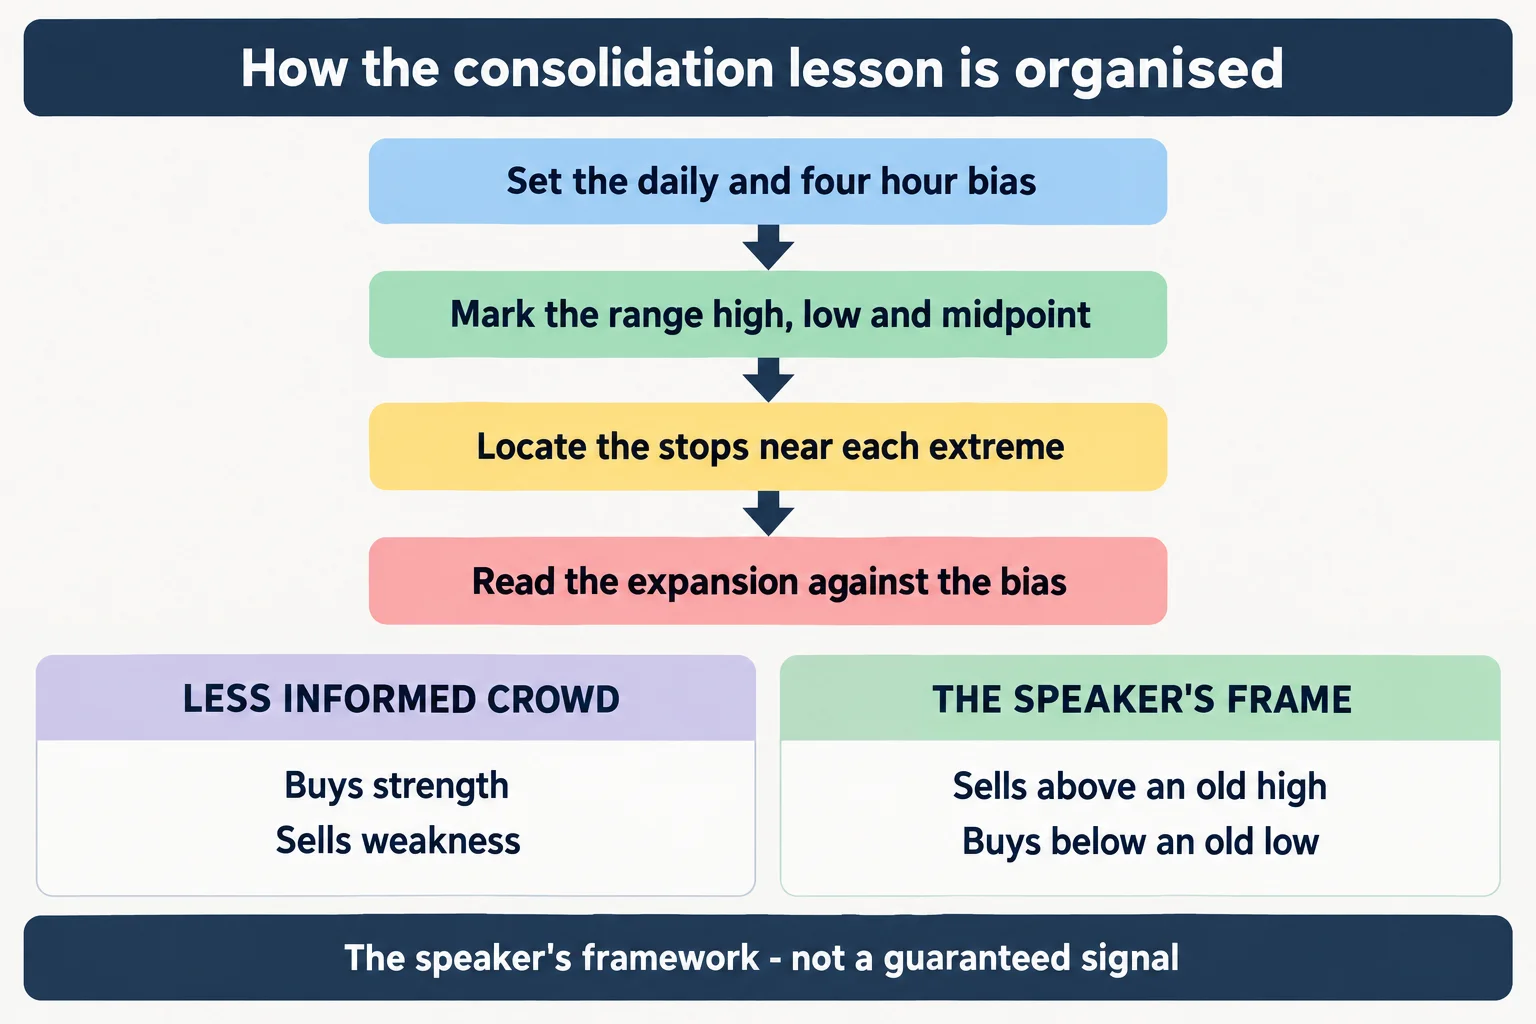
Set the bias on the daily and four-hour first
His first instruction is the top-down step. Establish what order flow is saying on the daily chart, then use the four-hour as the secondary reference — preferably both pointing the same way — before dropping to an hourly or 15-minute chart to look for a consolidation (0:39). The consolidation itself can be a buildup of new positions or a buildup of orders ahead of a rejection, which is the setup he calls a turtle soup (1:27).
He describes the market in two camps and asks the viewer to think about the opposite of what retail is doing (1:41):
- The crowd he describes: looking for breakouts to establish a direction, wanting a cause-and-effect confirmation, effectively chasing price.
- The behaviour he attributes to smart money: engineering or fading breakouts rather than following price, letting price run to a key level, liquidity reference or PD array before acting (2:12).
He notes that retail buys the previous low and sells the previous high, which he calls the classical support-and-resistance tradition, and argues that liquidity actually rests just above an old high or just below an old low — which is why the approach he describes buys under an old low and sells above an old high while price is consolidating (2:54). That attribution is his interpretation of market behaviour; nothing in the transcript identifies the participants behind any move.
What a consolidation permits: the open float
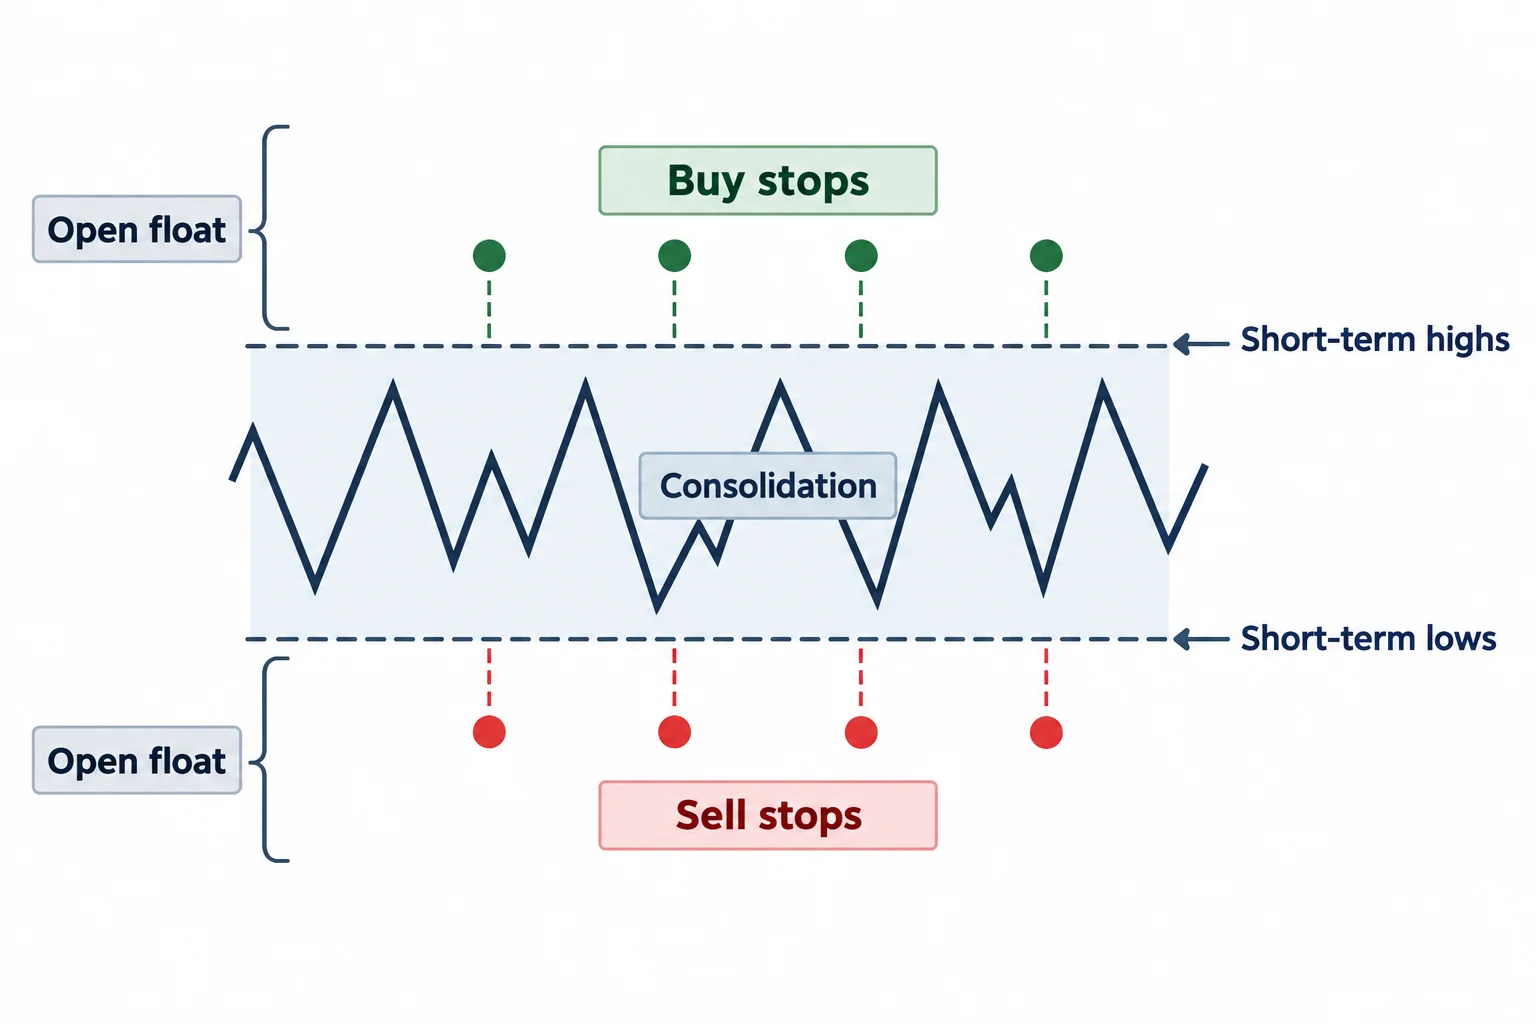
His term for the orders that accumulate around price during consolidation is the open float, and he is specific that it stacks on both sides: buy stops and sell stops above and below current market action (3:31). Where he looks is above short-term highs and below short-term lows, because that is where those orders are likely to sit (3:48).
The duration matters to him, with a caveat he states himself. A longer sideways consolidation allows more orders to build; as a day trader he does not expect a long phase and accepts that the consolidation can be rather brief (3:59). Inside it he lists the orders being permitted: breakout orders, trailed stop-loss orders and stop orders that key up entries — buying on a stop for strength, selling on a stop for weakness — and says those overlapping ideas concentrate open interest above and below the market, leaving liquidity bracketing price (4:22).
Subordination: the direction outside the range
The core of the lesson is the statement that whatever direction the daily or four-hour order flow is, that is most often going to be the direction of the move outside the consolidation (4:58). He then states both sides as scenarios rather than signals:
- If daily and four-hour order flow is bullish, moves below the consolidation are read as smart money accumulating sell stops ahead of a move higher (5:31).
- If daily or four-hour order flow is bearish, moves above the consolidation and above an old high are read as smart money knocking out buy stops while accumulating shorts (5:40).
He gives the retail counterpart: retail chases expansions away from equilibrium while smart money fades them (6:01). This is the pivot of the whole lesson and it is worth stating plainly what it rests on — an assumed identity for the two sides of the order book, which the transcript does not verify.
Expansion from equilibrium: the two scenarios
He repeats the logic with equilibrium as the reference point, expanding away from the middle of the range rather than from an old high or low. In the bearish case, price moves away from equilibrium, breaks a short-term high, and retail reads that as a bullish expansion or an ABCD-type move — where he instead treats it as a short-term stop run and looks for a move to the opposite extreme, just outside the range (6:27). He is explicit that this is where his focus differs from classical support and resistance: he watches the equilibrium price point because he is reading premium and discount rather than only what price previously did at an old high or low (7:24).
The bullish case inverts it. A short-term low broken on an expansion away from equilibrium is read as a run on sell stops or a sweep of sell stops used to accumulate longs, not as a break in structure for lower prices, with the other end of the range or just outside it as the target for the buy stops paired up there (9:01).
Then the qualification that matters most for anyone reading the lesson as a system. Price is only expected to return to equilibrium: he says he does not anticipate or always hold for the opposite end of the consolidation, that he has no idea whether that will occur with any validity, and that the move back to equilibrium is what he simply takes, because price in consolidation tends to gravitate back to the mean and equilibrium is the middle of what he deems fair value (12:29). An excursion past one boundary therefore does not, in his own telling, imply a full traversal of the range.
How he describes the trade at the extremes
Two worked descriptions fill out the middle of the lesson. In the bullish-higher-time-frame case he anticipates traders treating an old low as classical support, buying a retest of an equal low and placing stops just below the previous short-term low; when price instead trades below that previous low outside the consolidation, he describes buying up those sell stops as the low-risk entry (11:32). In the bearish case the mirror image: traders treat an old high inside the consolidation as support-and-resistance territory, sell short at it and place buy stops just above the previous high; the breakout above that high is where he describes selling into those buy stops and pairing with the liquidity sitting above (13:46).
He returns to the mechanics of the exit as well as the entry: in a bearish higher-time-frame environment he describes aiming for the liquidity resting below the previous low that created the consolidation support, and covering the short with the traders whose sell stops sit below an old low — all of it set up by the run on buy stops above the short-term high made just above equilibrium (16:02). Whether that liquidity is actually resting there, and whether participants behave as described, is asserted rather than demonstrated.
Reference points and the close
Near the end he adds a practical note about the lower time frame: the short-term low in question can in many cases be the Asian-session low or the previous day’s low, and either would be a suitable reference for a long day trade, with everything reversed for a short (19:20). This is a conceptual example from a chart on screen; no levels are recoverable from the captions.
His closing summary restates the hierarchy: the idea all stems from the subordination of price to the daily and four-hour direction bias derived from institutional order flow, with the PD array matrix used to decide whether discount or premium is in play (20:02), and he frames the whole lesson as a way to avoid working both sides of the market and instead seek liquidity on one side as the banks are described as doing (21:01).
What the lesson does not establish
Read as a research method rather than a set of instructions, the lesson offers a consistent organising idea: a range is a place where stops accumulate, and the higher-time-frame direction is the filter for which side of that liquidity to work. The parts that cannot be checked are the parts it depends on. It gives no objective test for classifying daily or four-hour order flow, no measured definition of the open float, no rule for choosing when price returns to equilibrium versus runs the full range, and no account of results. Terms such as PD arrays, premium and discount, and institutional order flow are used within his own framework rather than defined in measurable terms here.
The recording contains no backtesting, no fill data, no position sizing and no risk parameters, and it presents no evidence that this way of trading is profitable or suitable for any particular market condition. He also says himself that he does not always expect the opposite boundary to be reached. Futures and similar leveraged products can lose more than the amount committed. Nothing here is investment advice, and this article records his framework rather than endorsing it.
Watch the original lesson
This article was written from the timestamped English captions of the recording; the timestamp links above point to the passages being described.
Watch the original lesson on YouTube
The recording cannot be played inside another website. When its embedded player was loaded and clicked in a real browser on this article’s behalf on 15 September 2026, the player reported “Playback on other websites has been disabled by the video owner” and offered a “Watch on YouTube” prompt, with no duration loaded and no playback progress. No half-working embed is left here for that reason; the recording plays normally on YouTube itself.
Watch ICT Mentorship Core Content – Month 09 – Trading In Consolidations on YouTube ↗
Primary source and further reading
- The original Inner Circle Trader lesson: use the timestamp links in this article to compare each explanation with its source.
- Investopedia — stop orders: a general explanation of the stop and stop-limit orders whose accumulation the lesson assumes around range extremes; the page is independent reference material and is not part of ICT’s framework.
- Investopedia — support levels: the classical support-and-resistance reading the lesson contrasts itself against, useful for seeing exactly where his account diverges.
- U.S. Commodity Futures Trading Commission — learning resources: regulator material on futures markets and on evaluating trading claims, relevant to how much weight to give an untested discretionary method.
- CME Group — education: exchange course material on futures mechanics, including how orders and stop orders behave in a central limit order book.
This is independent educational commentary. It is not official ICT material, not a tested trading system, and not a claim that fading breakouts is profitable. References to broker or bank behaviour are the speaker’s characterisation of the market, and the third-party pages linked here were consulted as general reference and were not tested against his claims.

