
Key takeaways
ICT’s hypothetical trade copier scenario uses ten simulated $100,000 funded accounts, modelling 100 contracts in aggregate as the equivalent of ten contracts in each account, with about $750 of risk per account — roughly three-quarters of one percent — and $7,500 of combined modelled exposure before fills, fees or firm rules.
Read the full summary
ICT’s hypothetical trade copier scenario uses ten simulated $100,000 funded accounts, modelling 100 contracts in aggregate as the equivalent of ten contracts in each account, with about $750 of risk per account — roughly three-quarters of one percent — and $7,500 of combined modelled exposure before fills, fees or firm rules. Recorded live on January 10, 2024, the narrated setup moves from a 15-minute chart to one-minute and 15-second views and refers to relative equal highs as buy-side liquidity, plus fair value gaps, order blocks, premium arrays, a minor buy-side liquidity pool and a “Silver Bullet” entry. He states a figure of about $40,000 and then describes it as an annual salary rather than a gain on the position being discussed, and suggests that about 20 trades earning $50,000 each could total $1 million within six to twelve months; the recording supplies no verified prices, fills, fees, slippage or final result. He stresses that a simulated allocation is a risk limit rather than owned or withdrawable cash, says he does not operate a trade copier himself, and warns that funded-account firms may prohibit copying and ban participants. The most practical lessons are proportional sizing, preserving higher-time-frame context in chart labels, documenting invalidation and risk limits, and journaling plan adherence, intended versus actual risk, execution errors and psychology.
How we researched this article
BestProps used document-based research from primary firm sources, checked September 24, 2026. The complete source list, scope, limitations, and commercial-state record appear near the end of this article.
ICT Explains Funded Accounts and Trade Copiers
In What The #1 Day Trader On YouTube Could Do With Funded Accounts & Trade Copier, ICT sets out a hypothetical arrangement involving ten simulated funded accounts. The premise is that a decision made in one account would be copied across the other nine, and the lesson that follows is less about the copier itself than about position sizing, compounding and record keeping.
He presents the session as taking place while the market was open on January 10, 2024, with his chart set to New York local time. He says he is trading the E-mini S&P rather than using market replay. This article is written from an automatic transcription of the recording’s own audio, so his words can be checked, but the platform, the orders and the chart prices cannot: those remain his narration of the session rather than independently verified trade records.
At 0:38, he introduces a scenario based on ten accounts, each described as having $100,000 of simulated capital. He later states plainly that he does not know how to operate a trade copier himself, so for presentation he substitutes the arithmetic of 100 contracts, which he treats as the equivalent of ten contracts in each of ten accounts (0:56, 2:02).
ICT Funded Account Limits and Risks
ICT’s first point is a distinction that headline funding figures tend to blur: a simulated funding allocation is not the same as possessing an equivalent amount of cash or withdrawable equity. He argues that a seven-figure “funded” claim means very little unless the trader could write a cheque for that amount. In his framing the headline account size is a risk limit or notional allocation under a firm’s rules, not necessarily money owned by the trader (2:18).
At 2:41 he puts numbers on the model. Using the same setup, gearing and risk in each account, the exposure per account would be about $750, which he describes as less than one percent of a $100,000 account, or roughly three-quarters of one percent. Across ten identically copied accounts that scales to about $7,500 of combined modelled exposure — before any allowance for differences in fills, commissions, slippage, copier behaviour or each firm’s own rules. The recording does not work through those operational details, and they are where a copied strategy most often diverges from its paper arithmetic.
He contrasts the approach with over-leveraging a single account in pursuit of online attention, and states an intent to parlay the accounts toward $1 million within six to twelve months (2:53). That is an aspiration he sets out, not an outcome the recording establishes. He also concedes a practical obstacle at 8:37: funded-account firms are unlikely to permit this kind of activity and a participant would probably be banned. No particular firm’s current terms are examined, so the arithmetic should be kept separate from the contractual and technical realities of account copying.
ICT Day Trade Chart Framework
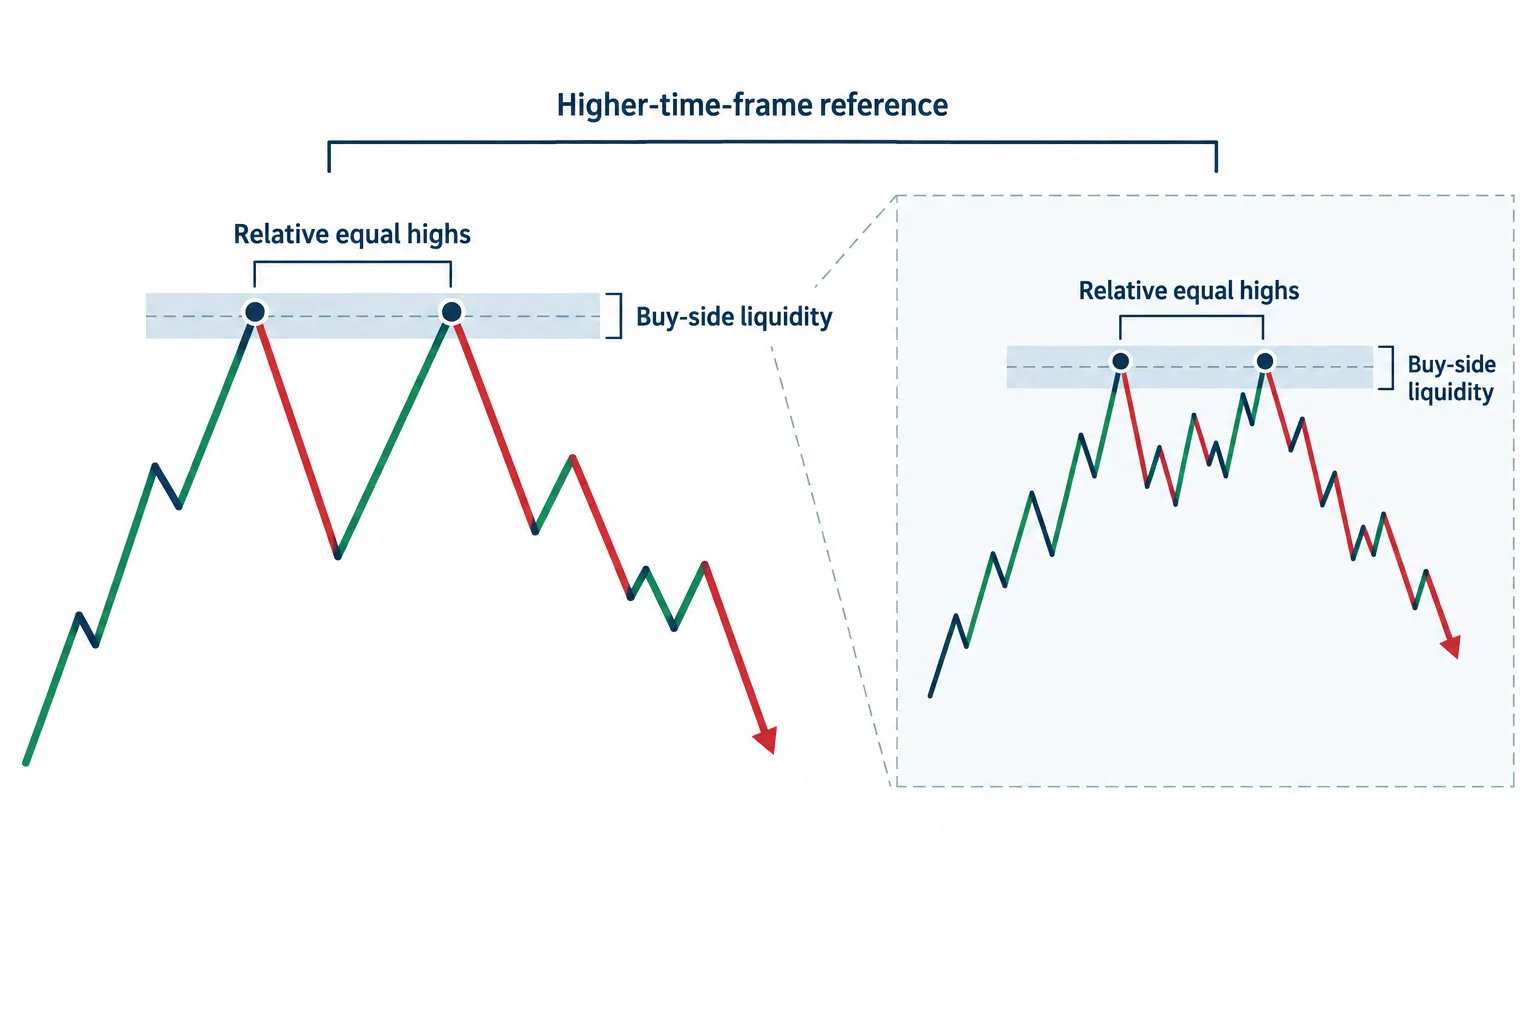
The trading discussion begins with what ICT calls relative equal highs, noting that the level is derived from the 15-minute chart. He treats those highs as a potential destination for price and labels them buy-side liquidity (1:07, 4:04). He then drops to a one-minute chart while retaining the higher-time-frame reference.
Other terms used in the narration include a fair value gap, an order block, a premium array and a minor buy-side liquidity pool (1:19, 3:19, 3:40). These are concepts within ICT’s own market framework; the video does not provide controlled evidence that they create a repeatable trading advantage, and this article makes no such claim.
A particularly useful educational section concerns chart organization. Starting around 4:25, ICT recommends making annotations meaningful enough to preserve their context, and admits he has been guilty of leaving unlabelled marks on his own charts. His example is an abbreviation for relative equal highs, paired with a note that the level represents buy-side liquidity derived from the 15-minute chart. Without that information, someone reviewing a one-minute or 15-second chart later might not remember why the line mattered.
ICT Chart Annotation Template
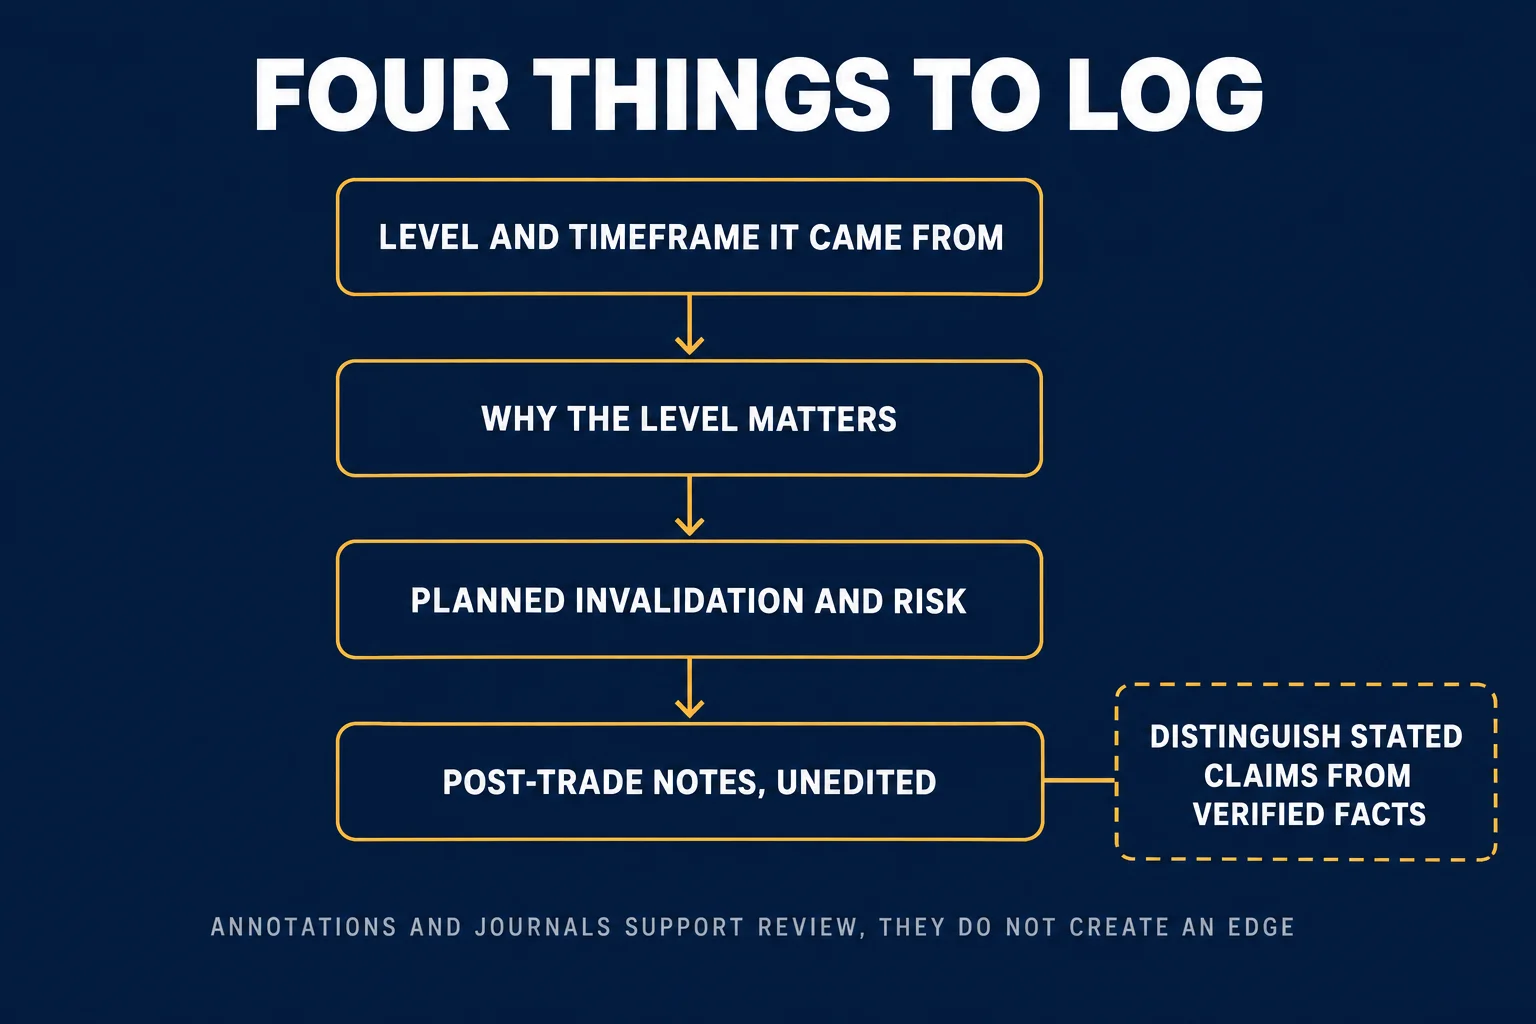
A general educational takeaway is to record enough information to reconstruct the original idea. A chart label could include:
- the level or pattern being marked;
- the time frame from which it was derived;
- the anticipated role of the level, such as a liquidity target;
- the time and market context;
- the planned invalidation and risk limit; and
- post-trade observations recorded without rewriting the original thesis.
This template is a general interpretation of the video’s journaling lesson, not a trading signal.
ICT Trade Journaling and Performance Review
At 6:13, ICT connects organized chart annotations with logging, journaling and key performance indicators, arguing that any business aiming to keep growing financially has to manage its metrics. He recommends monitoring psychology both during and after a trade, including reactions to gains, losses and drawdowns, and warns against letting a winner create overconfidence or a loss sour the process.
This is one of the more broadly applicable parts of the session. A journal can distinguish the quality of a decision from the result of a single trade. Potential review fields include adherence to the plan, intended versus actual risk, execution errors, emotional state and whether chart labels were understandable afterward. A sufficiently detailed log can expose inconsistent behavior, although it cannot make a strategy profitable by itself.
ICT Silver Bullet Trade and Earnings Claims
Around 7:00, ICT points to what he calls a fair value gap entry he says he would have taken had he not already been positioned, and identifies that type of setup as a “Silver Bullet.” He says it is the trade he intends to use in the 2024 Robbins Cup and that he would not need the larger setups, adding that he wants to make the attempt realistic this year by starting small and letting money management and compound growth do the work (7:14, 7:27).
At 7:58 he states a figure of about $40,000, and a few seconds later describes it as an annual salary — that is, what he says this kind of approach would produce over a year, not the gain on the position being discussed (8:15). The recording does not reveal chart prices, confirmed fills, costs, slippage or the final account result, so the figure should be read as his own working assumption rather than a measured return.
Near the end, ICT suggests that approximately 20 trades earning around $50,000 each would total $1 million (11:19). That is straightforward multiplication, but it rests on the much more consequential assumption that those gains could be achieved repeatedly while satisfying every account’s loss limits, payout conditions and copying rules. The recording does not validate that assumption, and he is clear that most viewers will not put in the work required to learn the skill set at all.
ICT Funded Account Trade Copier Takeaways
The video combines an aggressive multi-account thought experiment with more grounded lessons about keeping risk proportional, preserving higher-time-frame context and maintaining a detailed journal. ICT’s income projections and comments about high-probability setups represent his own market interpretations. They should not be treated as demonstrated performance, a promise of profitability or evidence that a funded-account firm would allow the proposed structure.
Watch the original recording
This article draws on the timestamped automatic transcription of What The #1 Day Trader On YouTube Could Do With Funded Accounts & Trade Copier. Because the source is speech recognition of the audio rather than human-checked captions, ambiguous terms and numbers should be verified against the recording, and the chart detail behind his annotations is best seen there. A transcript can establish what the speaker said; it cannot by itself verify reported fills or performance.
This embedded player was loaded, opened and clicked from a BestProps page on 14 September 2026 and began playing at the recording’s own duration of 11:34, so the video can be watched in place. The timestamp links above point at the passages being described.
Primary source and further reading
- The original Inner Circle Trader recording: use the timestamp links in this article to compare each explanation with its source.
- 17 CFR 4.41 (Cornell Legal Information Institute): the rule on advertising by commodity trading advisors, including the required statement for presenting simulated or hypothetical performance. Cited as a regulatory reference, not as a statement that this recording or this article meets every requirement.
- CFTC Learn & Protect learning resources: regulator material on futures market basics and fraudulent promotion claims.
- YouTube’s embedding documentation: platform guidance relevant to the player embedded above.
This is independent educational commentary. It is not official ICT material, a tested trading system, or a claim that the reported results can be reproduced. Simulated or hypothetical results carry inherent limitations and do not represent actual trading.


