
Key takeaways
ICT Volume 17 presents a retrospective GBP/USD Optimal Trade Entry (OTE) setup on the five-minute chart during the New York morning session.
Read the full summary
ICT Volume 17 presents a retrospective GBP/USD Optimal Trade Entry (OTE) setup on the five-minute chart during the New York morning session. Using the daily chart, ICT identifies prior highs near 1.2394 as a likely liquidity draw that creates a bullish directional bias. After 8:30 a.m., price retraces to the 62 % level for a hypothetical entry at 1.2388 with a 15-pip stop below the recent low. Targets progress from the old high (+15 pips) through graduated standard-deviation levels: +29 pips at 0.5 SD, +43 pips at 1 SD, +56 pips at 1.5 SD, and +70 pips at 2 SD, where the model’s day-trade rule requires an exit even if price continues higher. The speaker also notes traders may keep a small portion of the position for further movement.[1]
Volume 17 of the Optimal Trade Entry Pattern Recognition Series walks through a single GBP/USD example. The approach layers a higher-time-frame directional premise onto a lower-time-frame entry structure, then predefines risk and several profit targets before the hypothetical trade is taken.
How we researched this article
BestProps used document-based research from primary firm sources, checked September 25, 2026. The complete source list, scope, limitations, and commercial-state record appear near the end of this article.
Primary Source
The lesson is “OTE Pattern Recognition Series – Vol.17” from the Inner Circle Trader YouTube channel, uploaded June 1, 2020. The transcript below is derived from automatic speech recognition (Whisper large-v3-turbo) of the full original audio, not YouTube captions. All quoted prices, timestamps, and teaching points should be checked against the recording and visible chart.
Daily-Chart Liquidity Context
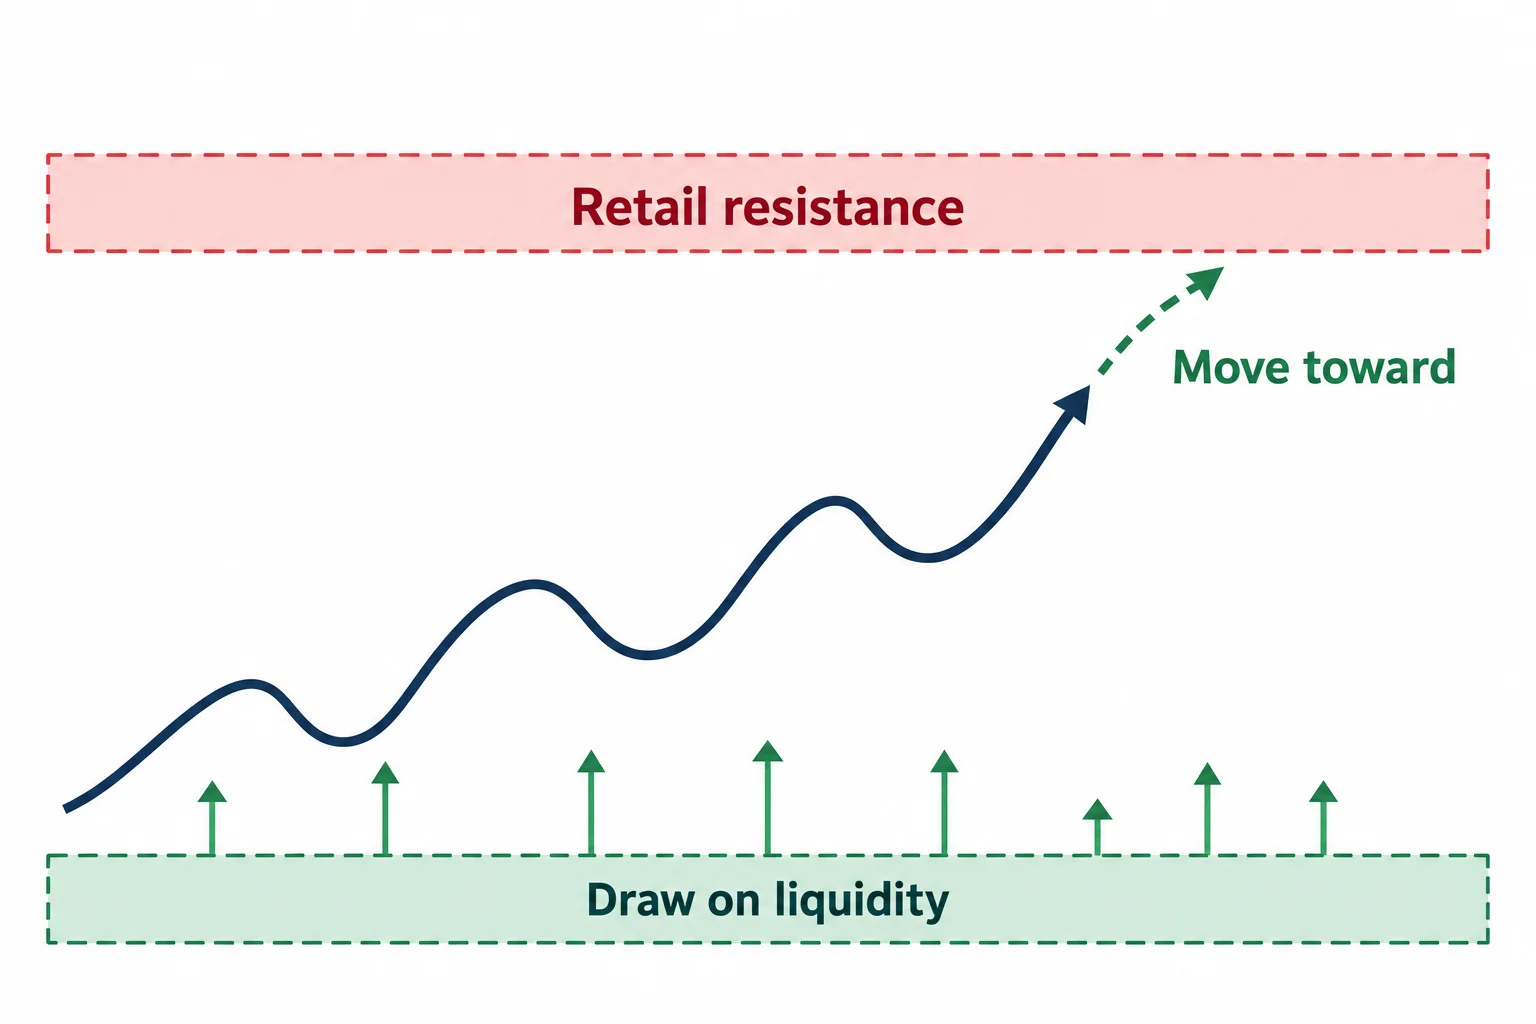
At 0:19, ICT opens on the GBP/USD daily chart and marks an area above current price as “retail resistance.” He treats this resistance as a likely draw on liquidity—a zone price is expected to move toward.
At 0:39, ICT makes a key distinction: price does not need to trade all the way to the level for the draw to matter. It only needs to move toward it. The ideal scenario would see price reach the highs, but that is not required, especially for day trades or intraday moves within the 8:30 a.m. to 11:00 a.m. New York window.
At 1:13, ICT references last Friday’s daily range and places a line on the daily high, which he states as 1.2394 “and one pipette.” In his interpretation, these highs make an upward move more probable than a downward move for the session under discussion.
Five-Minute OTE Setup and Hypothetical Entry
At 1:36, ICT switches to a five-minute GBP/USD chart and asks viewers to pause and study the price action before he adds annotations.
At 1:55, he identifies the OTE price move: after 8:30 a.m., price drops down into what he labels the 62 % retracement level. At 2:02, he calls the hypothetical entry 1.2388 and notes the setup suffers “three pips drawdown.” The stop loss is 15 pips, placed just below the nearby low at the old high.
These figures describe ICT’s retrospective chart walkthrough. The transcript does not establish that a live order was filled, and it cannot confirm bid-ask spread, slippage, execution conditions, or the exact visual placement of every annotation.
Graduated Standard-Deviation Targets
Beginning around 2:15, ICT maps a series of hypothetical targets measured from the entry:
| Level | Pips from entry | Context in ICT’s explanation |
|---|---|---|
| Old high (1:1) | +15 | Immediate one-to-one reached at the prior high. |
| 0.5 standard deviation | +29 | First scaled target. |
| 1.0 standard deviation | +43 | Second scaled target. |
| 1.5 standard deviations | +56 | Third scaled target. |
| 2.0 standard deviations | +70 | Model’s day-trade exit point. |
At 2:39, ICT states the model requires exiting the day trade at two standard deviations (+70 pips), even though the chart shows price continuing slightly farther in hindsight. His teaching point is that a rule-based exit can leave money on the table, and a trader following the model must accept that trade-off.
Optional Position Scaling
Near 2:56, ICT appears to mention keeping “a small portion of your original position” when anticipating further movement, based on the daily-chart liquidity draw shown earlier. The automatic transcript is slightly garbled here, so the exact wording and condition should be verified against the recording rather than treated as a complete rule.
How to Study This Lesson
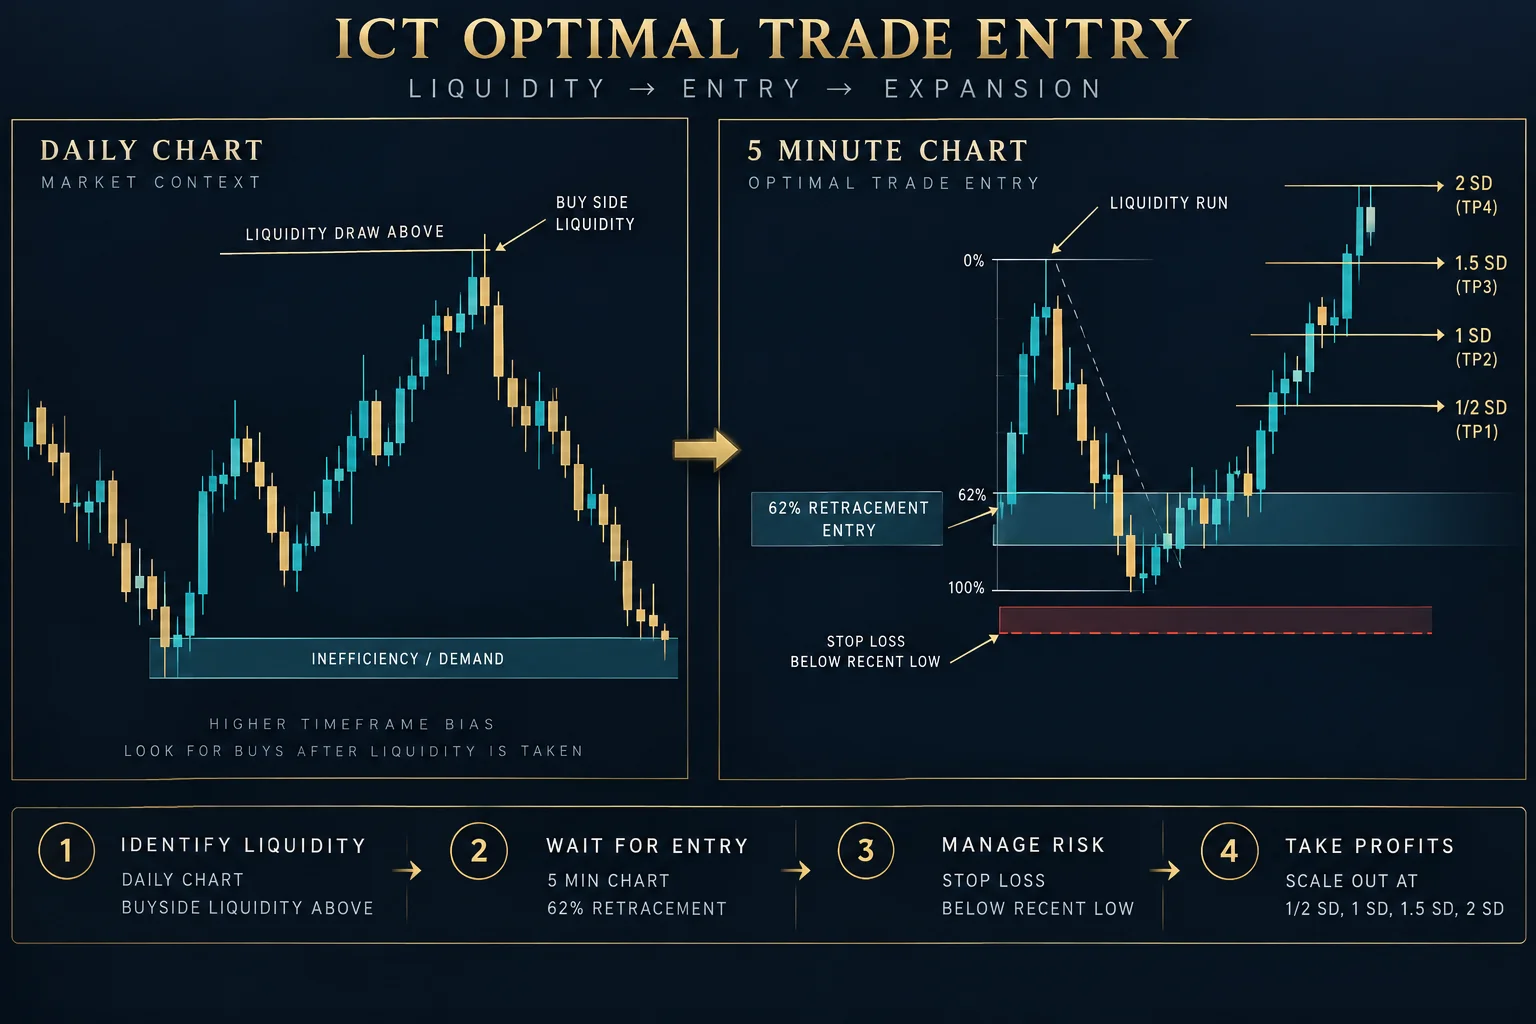
The example can be separated into three analytical layers:
- Directional premise: Prior daily highs act as a proposed liquidity draw, creating an upward directional bias.
- Entry framework: After 8:30 a.m., price retraces into the 62 % area on a five-minute chart, with a defined stop below the recent low.
- Exit framework: Multiple standard-deviation levels provide graduated objectives, with two standard deviations serving as the model’s stated day-trade terminal target.
In educational terms, this is an example of aligning a lower-time-frame retracement with a higher-time-frame directional thesis, then defining risk and exits in advance. That summary explains the structure of ICT’s interpretation; it does not demonstrate that the method has a proven edge or that similar formations will produce the same result.
Limitations
The lesson is retrospective and depends on a specific chart that cannot be reconstructed from transcript text alone. The audio supports the stated levels and ICT’s explanation, but it cannot confirm unseen candles, exact prices, order execution, or what happened beyond the portion displayed. Viewers should compare this summary with the full primary video for the necessary visual context.
Related Video
Resources
- Inner Circle Trader, “OTE Pattern Recognition Series – Vol.17” (June 1, 2020). Primary source for this article.
- ICT’s Optimal Trade Entry Pattern Recognition Series playlist (unofficial link—verify availability on the Inner Circle Trader channel).
- Investopedia, “Fibonacci Retracement” — general educational background on retracement levels.
- U.S. Commodity Futures Trading Commission (CFTC) — regulatory information for forex and futures traders.


