
Key takeaways
ICT Trading Plan Development 5 presents an educational intermediate-term currency framework built around a daily-chart thesis, several-week or multi-month holding periods, intermarket confirmation and lower-time-frame execution rather than a ready-made system.
Read the full summary
ICT Trading Plan Development 5 presents an educational intermediate-term currency framework built around a daily-chart thesis, several-week or multi-month holding periods, intermarket confirmation and lower-time-frame execution rather than a ready-made system. The checklist covers seasonality, interest rates, US, UK and German yields, two-, five- and ten-year Treasury futures, DXY, Commitment of Traders positioning, open interest, daily Williams %R, the Dow, S&P 500, Nasdaq, CRB commodity index, gold and oil. Rising yields, falling Treasury futures, a weaker dollar and firmer risk assets support the example risk-on template, while falling yields, rising Treasury futures, a stronger dollar and softer stocks or commodities support risk-off. Price must first reach significant monthly, weekly or daily support or resistance, then show possible SMT divergence among yields, DXY versus EUR/USD or GBP/USD, EUR/USD versus GBP/USD, or major US stock indices. Direction must agree with daily structure, with levels transferred to 60-minute, 15-minute and five-minute charts for entries using optimal trade entry, reflection patterns, MACD or stochastic divergence, or Turtle Soup patterns during relevant regional sessions. Mechanical example rules cap risk at 2%, reduce risk after a loss, use a 30-pip initial stop, close half after a 30-pip favorable move and manage the remainder near 127%, 162% and potentially 200% Fibonacci extensions. The 2012 walkthrough combines Treasury futures, yields, DXY, GBP and EUR futures, positioning, open interest and stock indices to form a spring risk-off thesis favoring a stronger dollar and weaker EUR/USD and GBP/USD, but provides no independently verified fills or performance and recommends demo testing.
How we researched this article
BestProps used document-based research from primary firm sources, checked September 25, 2026. The complete source list, scope, limitations, and commercial-state record appear near the end of this article.
In ICT – Trading Plan Development 5, ICT presents an example framework for intermediate-term currency trading. The lesson is not offered as a ready-made system. At 1:41, ICT explicitly says the example is intended to encourage prudent decision-making and help viewers assess whether they have the patience to follow a plan.
The central idea is to begin with a daily-chart thesis, use related markets to assess broader market conditions, and move to lower time frames only for execution. Because the intended holding period can span several weeks or months, ICT emphasizes patience rather than frequent trades.
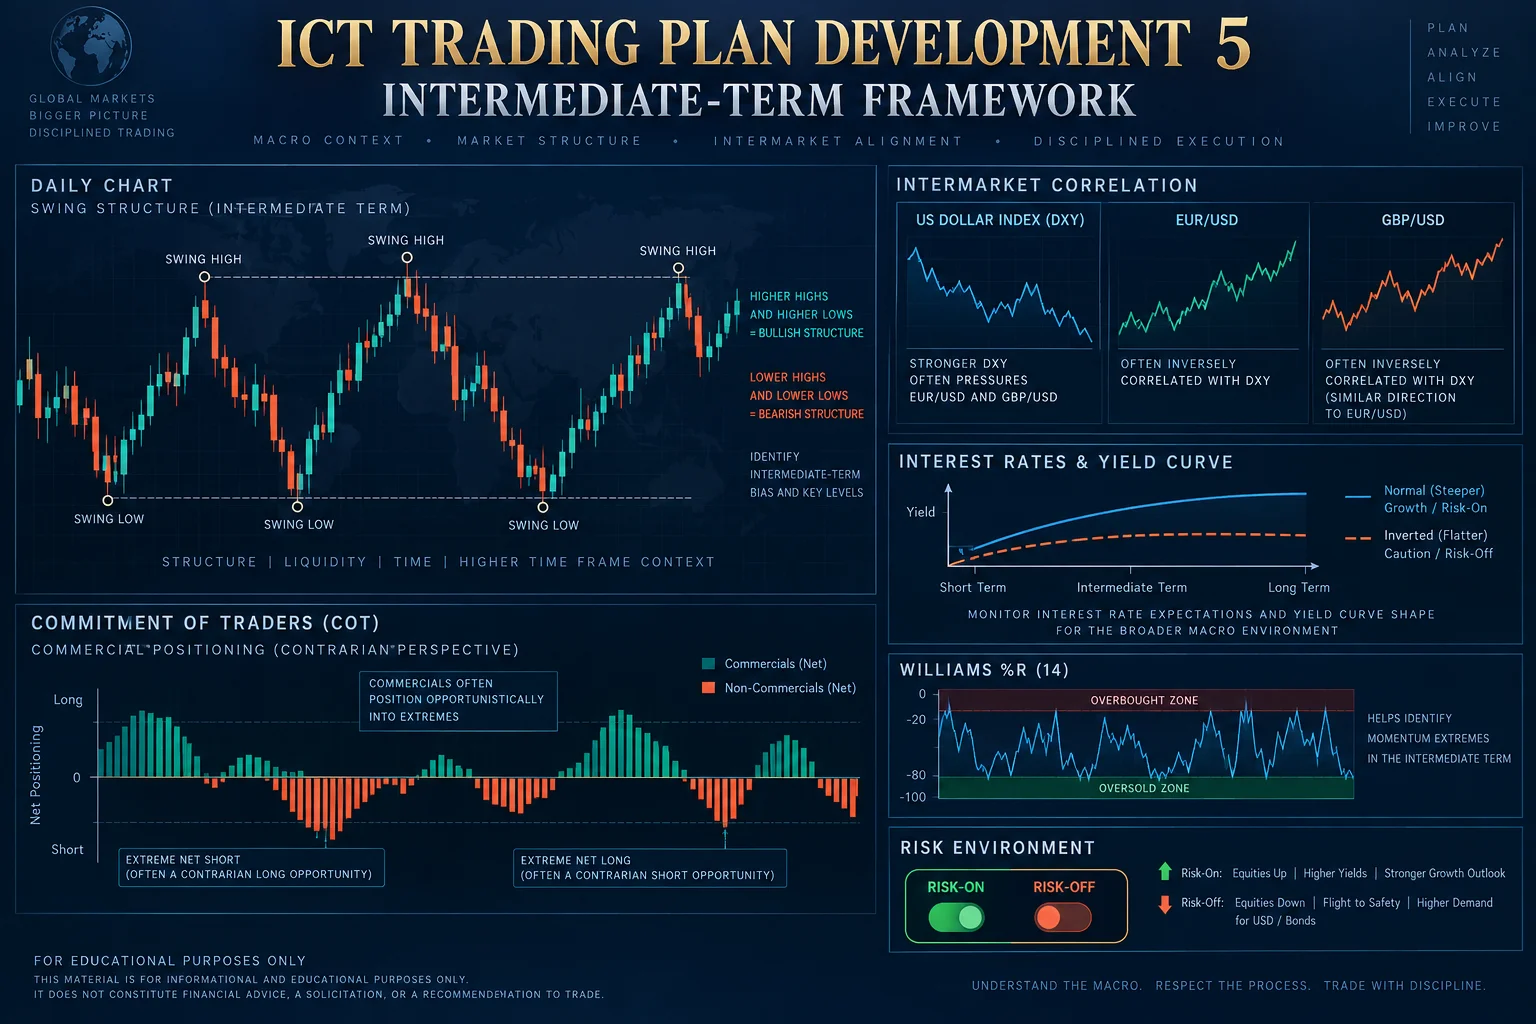
ICT Intermediate-Term Plan Time Horizons and Market Conditions
At 3:23, ICT identifies the daily chart as the plan’s primary time frame. The goal is to participate in intermediate-term daily price swings, not to treat an intraday fluctuation as the main thesis.
ICT organizes the analysis into bullish and bearish environments. His checklist considers:
- seasonal tendencies;
- interest rates and Treasury yields;
- the US Dollar Index;
- two-, five- and ten-year Treasury futures;
- Commitment of Traders positioning and open interest;
- daily Williams %R readings;
- major US stock indices;
- the CRB commodity index, gold and oil.
These relationships are ICT’s interpretation of intermarket behavior, not independently established rules. In his bullish template, rising yields, declining Treasury futures, a weakening dollar and firmer risk assets contribute to a “risk-on” assessment. His bearish template reverses much of that logic: falling yields, rising Treasury futures, a stronger dollar and softer stocks or commodities contribute to a “risk-off” assessment. The discussion begins around 4:13.
ICT Plan Levels for Anticipating Intermediate-Term Trades
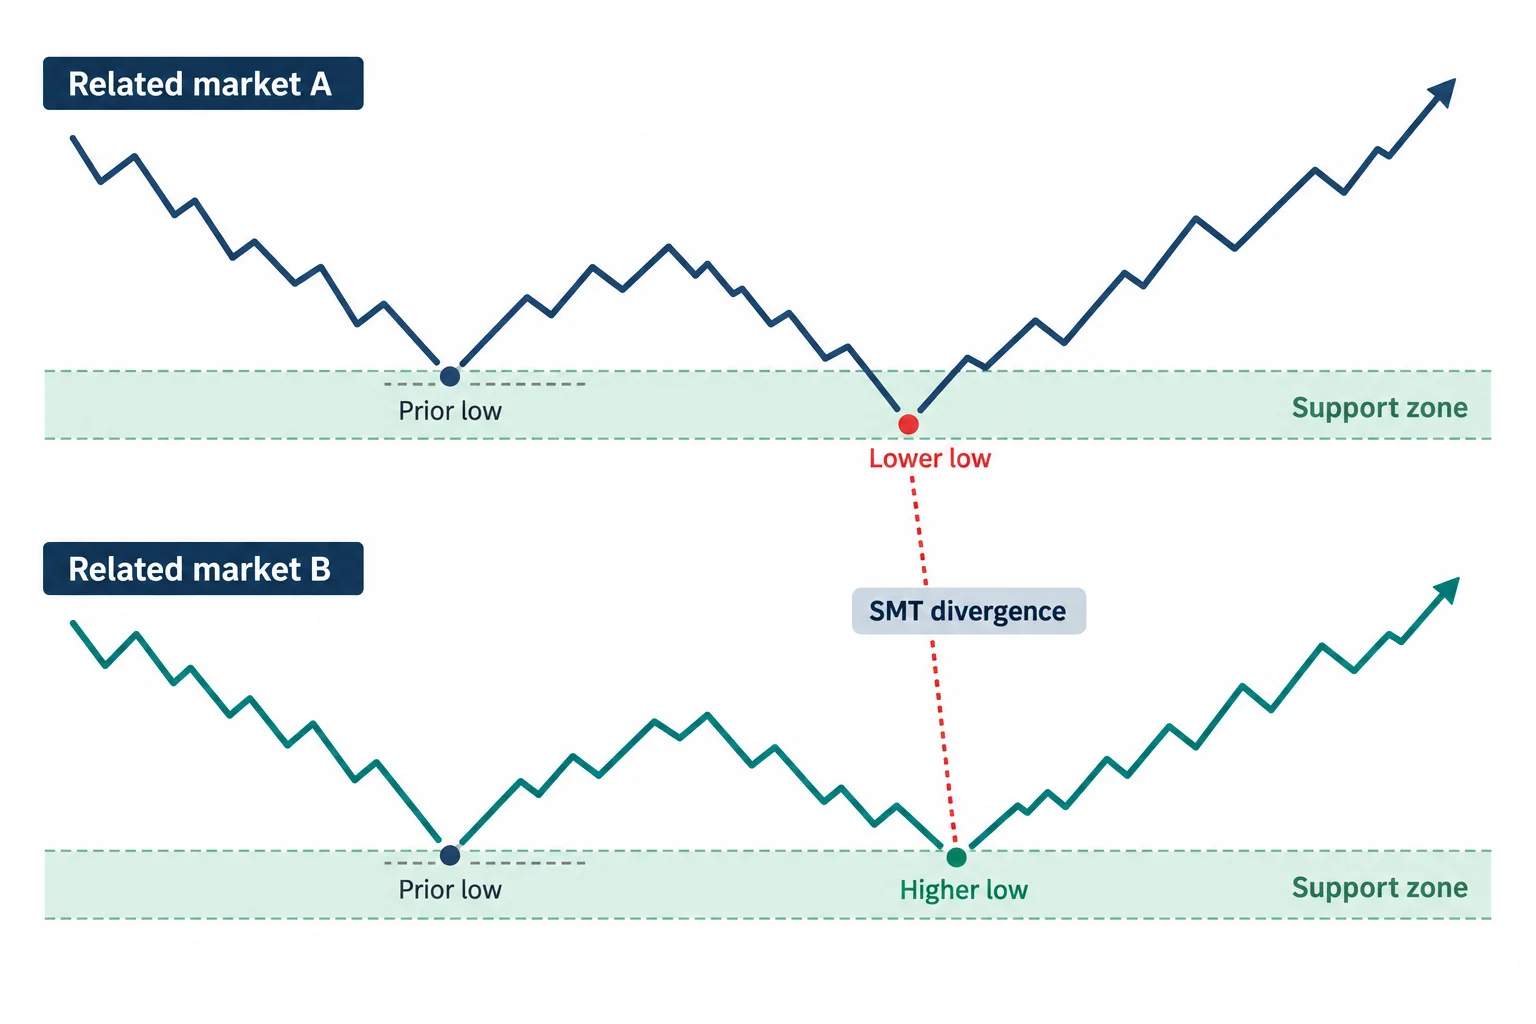
The anticipatory stage begins at 9:32. ICT requires price to reach a significant monthly, weekly or daily support or resistance area before considering a setup. In this framework, the macro checklist does not replace location: the proposed trade must also be anchored to a higher-time-frame level.
He then looks for what he calls SMT divergence, meaning a failure of closely related markets to confirm comparable highs or lows. Examples in the lesson include:
- divergence among US, UK and German yields;
- the US Dollar Index failing to confirm EUR/USD or GBP/USD;
- EUR/USD and GBP/USD behaving differently near support or resistance;
- the Dow, S&P 500 and Nasdaq failing to confirm one another.
ICT treats these discrepancies as warnings that a correlation may be weakening. He repeatedly ties them to higher-time-frame support or resistance rather than presenting every divergence as a trade signal. The currency comparison is explained from 11:29, followed by the stock-index comparison at 14:49.
ICT Trade Plan Positioning Open Interest and Sentiment
ICT also combines Commitment of Traders data with open interest. Around 16:03, he describes favoring long scenarios when commercial traders are net long and short scenarios when they are net short, while also considering the direction in which those positions are changing.
He gives special weight to rapid open-interest changes near key levels. His stated template looks for a sharp decrease near support in bullish conditions or a sharp increase near resistance in bearish conditions. These are ICT’s proposed readings of positioning data; the transcript does not provide a statistical test establishing their reliability.
ICT Trade Plan Execution From Daily Bias to Entry
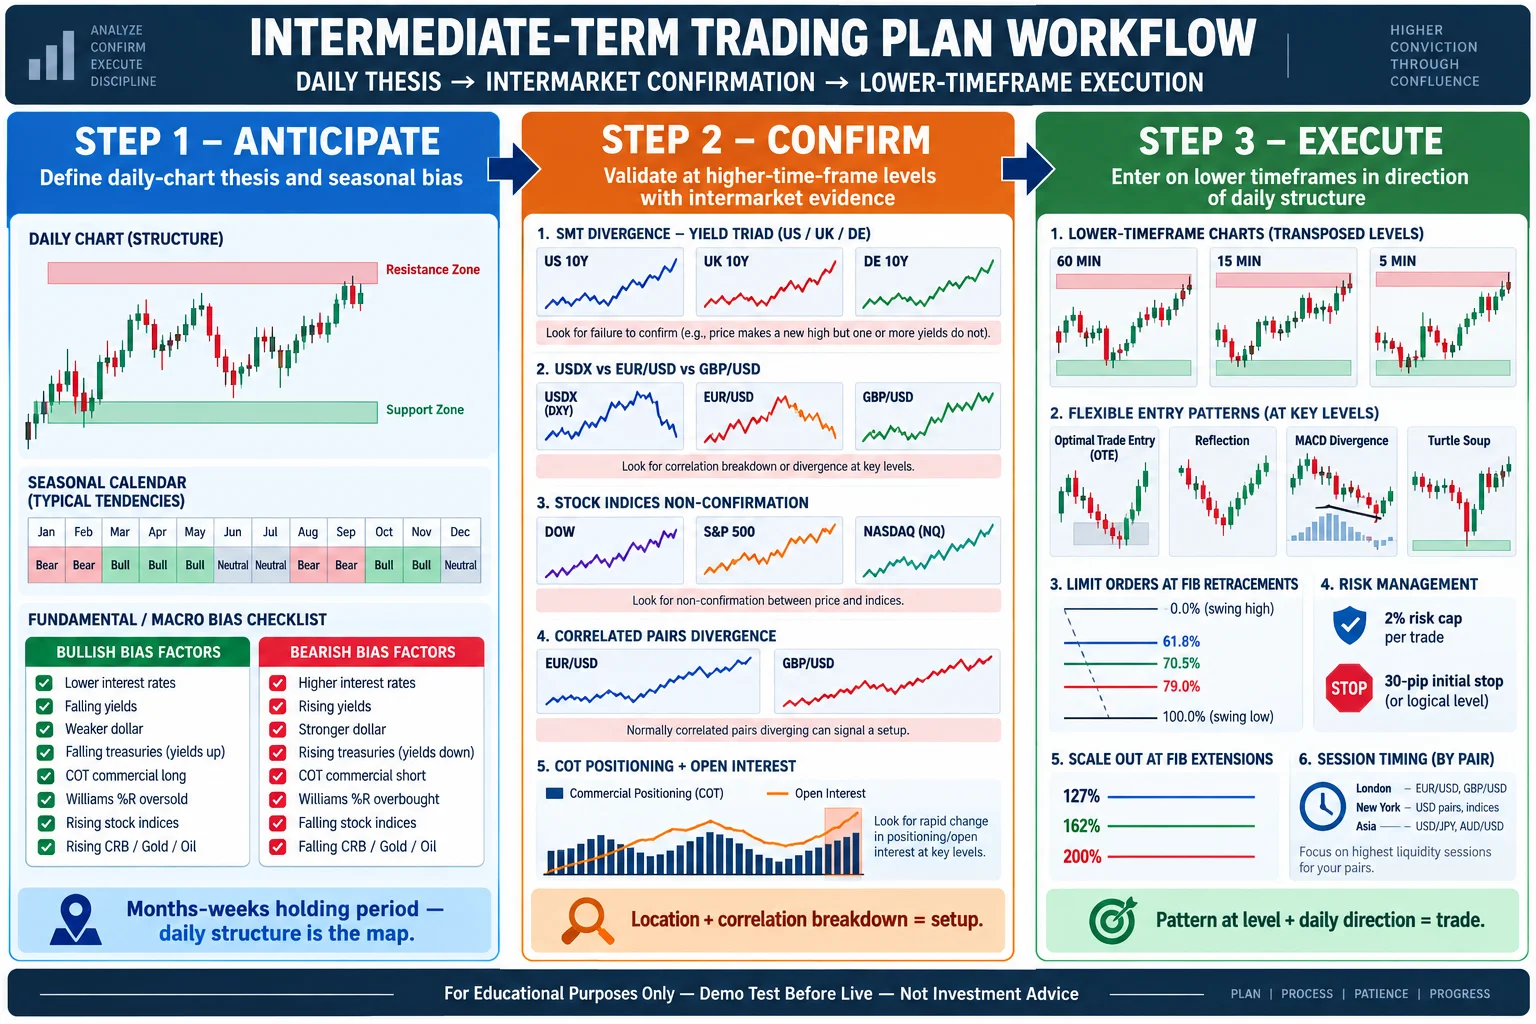
The execution stage starts at 18:09. ICT first determines whether the session fits his risk-on or risk-off assessment. The trade direction must agree with daily market structure, after which monthly, weekly and daily levels are transferred to 60-minute, 15-minute and five-minute charts.
The entry pattern itself is described as flexible. ICT mentions his “optimal trade entry” concept, reflection patterns, MACD or stochastic divergence, and Turtle Soup patterns. His key constraint is that the selected pattern occur at the predetermined level and in the direction of daily structure. He also discusses timing entries around active regional sessions, depending on the currency being traded.
At 21:17, ICT outlines the example’s mechanical parameters: limit entries around specified Fibonacci retracement levels, risk capped at 2% in the model, and reduced risk following a loss. He strongly recommends testing the framework in a demo account and acknowledges that losses are unavoidable.
The example also specifies a 30-pip initial stop, taking half the position off after a 30-pip favorable move, and managing the remainder around 127%, 162% and possibly 200% Fibonacci extensions. Those fixed distances are part of this historical example, not universal risk settings. Different instruments, volatility regimes and account constraints may make them unsuitable.
ICT Trade Plan Walkthrough From 2012
From 26:15, ICT applies the framework to charts he identifies as being from 2012. He reviews Treasury-note futures, US, UK and German yields, the Dollar Index, GBP and EUR futures, open interest, commercial positioning and US stock indices. He interprets the combined evidence as supporting a spring risk-off thesis, a stronger dollar and weaker EUR/USD and GBP/USD.
The later portion demonstrates how he moves from that macro view to daily, four-hour and hourly structures, then uses Fibonacci retracements and extensions for hypothetical entries and exits. The transcript contains ICT’s retrospective chart interpretation and reported pip measurements, but it does not document independently verifiable fills or account performance.
Practical Lessons for ICT Trade Plan Development
The most transferable lesson is the planning hierarchy: define the holding period, classify broader market conditions, mark higher-time-frame locations, write down confirmation criteria, and only then choose an entry method. The framework also separates anticipation from execution, which can help prevent a lower-time-frame pattern from becoming a trade without a larger thesis.
This is an educational summary of ICT’s presentation, not investment advice. Viewers evaluating the framework should treat its intermarket relationships, seasonal assumptions and execution rules as hypotheses to test rather than promises of an edge.
Watch the Full ICT Trade Plan Lesson
More ICT Trade Plan Development Resources
- BabyPips Forex Education – foundational forex concepts referenced in the ICT series
- CFTC Commitment of Traders Reports – official source for commercial positioning data discussed in the lesson
- Investing.com Rates & Bonds – Treasury futures and yield data for intermarket analysis
- US Dollar Index (DXY) on TradingView – chart the dollar index referenced throughout the framework

