
Key takeaways
ICT’s trading plan framework moves from macro context to execution by reviewing 2-year, 5-year, 10-year, and 30-year yields, the US Dollar Index, Treasuries, major stock indices, the CRB Index, gold, and oil to assess risk-on or risk-off conditions and cross-market divergences.
Read the full summary
ICT’s trading plan framework moves from macro context to execution by reviewing 2-year, 5-year, 10-year, and 30-year yields, the US Dollar Index, Treasuries, major stock indices, the CRB Index, gold, and oil to assess risk-on or risk-off conditions and cross-market divergences. For GBP/USD, ICT compares US and UK yields with German yields as a third component — a “yield triad” — and considers seasonality, COT positioning, open interest, futures premiums, sentiment, and higher-time-frame support and resistance while recommending specialization in one or two related markets. At 10 minutes 30 seconds, execution begins with confirming that the monthly, weekly, daily, four-hour, and one-hour premise remains valid before using 5-minute or 15-minute structure, prior lows for bullish setups, prior highs for bearish setups, market flow, and Asian, London, and New York session timing. ICT generally uses limit orders for entries and exits, protective stops, and stop entries mainly for breakouts. Trades should be reduced or closed when expected volatility fails to appear, price strongly rejects the premise, unexpected events occur, or personal circumstances prevent objective management. Fractal analysis links higher-time-frame direction to lower-time-frame entries through failed resistance retests, breaks of prior lows, selling retracements, and recurring consolidation and expansion sequences. Swing highs have lower highs on both sides, while swing lows have higher lows on both sides. The methodology is discretionary, with no standardized stagnation or rejection thresholds and insufficient evidence to verify fills, costs, predictive value, or profitability.
How we researched this article
BestProps used document-based research from primary firm sources, checked September 25, 2026. The complete source list, scope, limitations, and commercial-state record appear near the end of this article.
In ICT – Trading Plan Development 3, ICT presents a framework for moving from macro market analysis to trade execution and management. The lesson covers interest rates, cross-market confirmation, higher-time-frame direction, recurring price patterns, entry logic, and reasons to exit when a trade is not behaving as anticipated.
This is a summary of ICT’s stated methodology, not independent evidence that the approach predicts markets or produces profitable results. The recording does not provide enough information to verify fills, execution costs, or subsequent performance.

ICT Trading Plan Top-Down Analysis
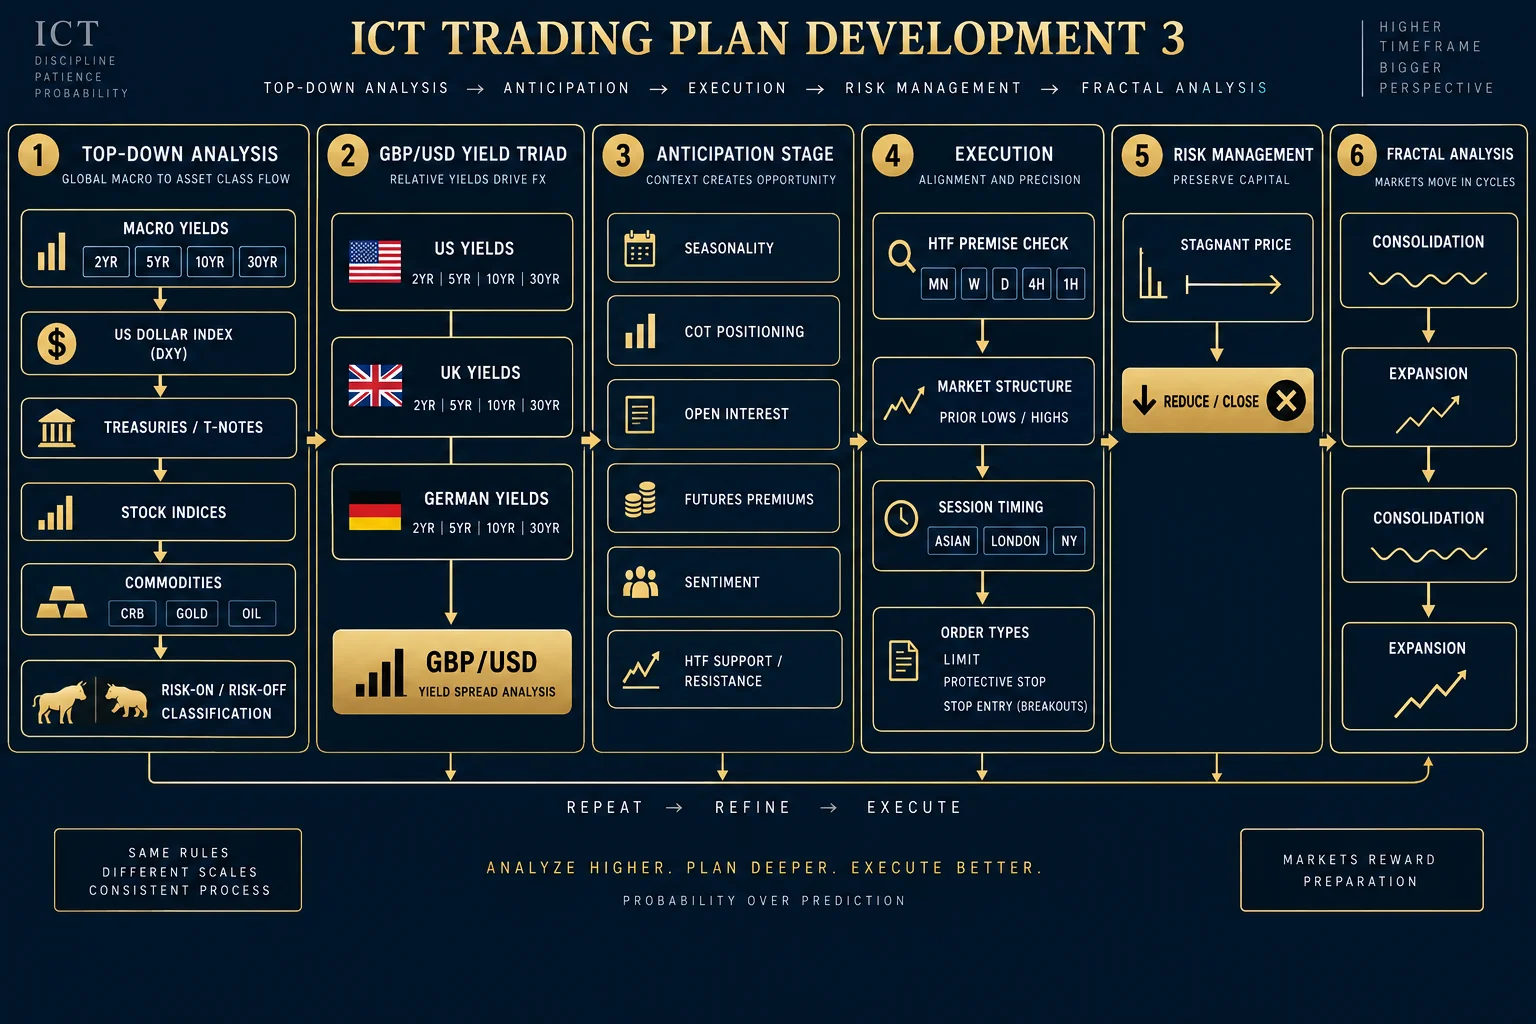
ICT starts by placing interest-rate markets at the top of his analytical hierarchy. At 1:09, he says he monitors yields across maturities such as the 2-year, 5-year, 10-year, and 30-year. In his framework, yields moving together help characterize the prevailing risk climate, while a failure to confirm comparable highs or lows may warn of a transition.
For a currency pair, ICT describes comparing yields associated with the relevant economies. His GBP/USD example uses US and UK yields alongside German yields as a third component — what he calls a “yield triad” at 3:08. He attributes significance to divergences within that group.
The proposed top-down sequence becomes more explicit at 5:26:
- Review interest rates and yields on a higher time frame.
- Assess the US Dollar Index and its important technical levels.
- Inspect Treasury or T-note markets.
- Compare major stock indices for confirmation or divergence.
- Use commodities, including the CRB Index, gold, and oil, as additional context.
ICT frames these relationships as tools for classifying conditions as “risk-on” or “risk-off.” These are his market interpretations rather than universal mechanical rules. Correlations can change, so the framework is better understood as a structured checklist than as proof of a directional outcome.
ICT Trading Plan Anticipation
At 7:09, ICT calls anticipation the stage in which a trader will spend the most analytical time. He includes seasonal tendencies, yield divergence, correlated markets, positioning, open interest, futures premiums, sentiment, and higher-time-frame support and resistance.
He also recommends specializing in one or two closely related markets instead of trying to follow everything. The practical principle is focus: study how a limited group behaves together and look for confirmation or disagreement around significant highs and lows.
The transcript refers to weekly “COT” positioning, apparently the Commitment of Traders concept, but does not explain its categories or calculation. It also mentions open interest and differences between nearby and later contract months. Because the lesson does not supply a formal test or complete decision rule, these items remain contextual inputs rather than standalone signals.
ICT Trading Plan Execution
ICT turns to execution at 10:30. Before entering, he says the trader should reassess whether the new day still agrees with the higher-time-frame premise. Monthly, weekly, daily, four-hour, and one-hour support or resistance should be visible even when working from 5- or 15-minute charts.
Market structure is then used to align an entry with that premise. Under a bullish view, ICT looks to prior lows as reference points; under a bearish view, he looks to prior highs. He combines this with what he calls market flow and with session timing, including the Asian range, London open, and New York open.
At 15:09, ICT discusses his own order-entry preference. He says he generally uses limit orders for entry and exit, protective stop orders, and stop entries mainly when intentionally trading a breakout. This is a description of his stated routine, not a recommendation or a verified execution record.
ICT Trading Plan Reactions When Execution Fails
The risk-management discussion begins at 16:05. ICT argues that a trade expected to expand should be reconsidered if price instead becomes stagnant, particularly as the relevant period of anticipated volatility passes.
His broader message is to avoid treating one trade as the event that must recover losses or deliver a major result. He lists several reasons to reduce or remove exposure:
- Expected volatility or follow-through does not appear.
- Price strongly rejects the trade premise.
- An unexpected event disrupts the market.
- Illness, grief, family responsibilities, or disconnection prevent objective management.
Educationally, this section separates planning from hope: define the expected behavior before entry, then reassess if observable behavior conflicts with it. The transcript does not provide standardized thresholds for “stagnant” price or “strong” rejection, so those terms remain discretionary.
ICT Trading Plan Fractal Analysis
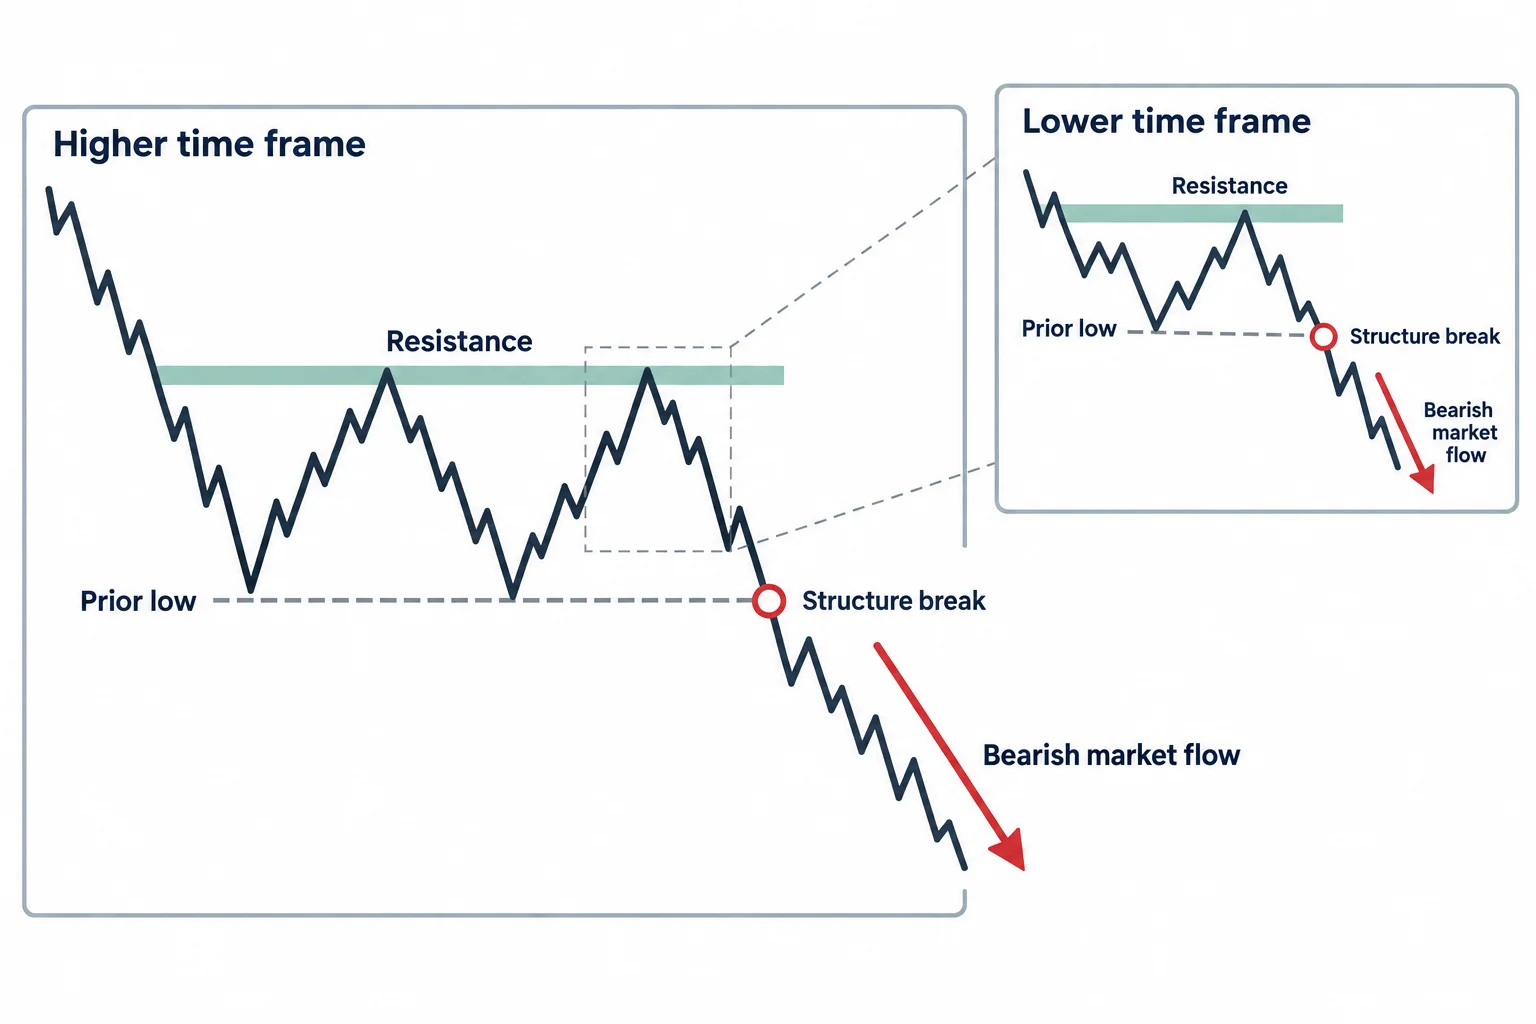
From 21:51, ICT describes price as fractal: patterns visible on a higher time frame may contain similar structures on lower time frames. His main example begins with price approaching resistance, pulling back, retesting unsuccessfully, and then breaking a prior low. Within his framework, that break indicates bearish market flow and shifts attention toward selling retracements.
At 29:17, he connects this pattern to the contraction-and-expansion sequence taught earlier in the series: consolidation, directional movement, another consolidation, and another expansion. Lower-time-frame setups are considered only after the higher-time-frame structure establishes the intended side of the market.
The final section, beginning around 41:00, reduces a turning point to individual candles or bars. ICT illustrates a swing high as a high with lower highs on both sides and a swing low as a low with higher lows on both sides. He then discusses possible market, limit, or stop entries around those structures. These are schematic examples; the transcript alone does not establish actual fills or results.
Practical ICT Trading Plan Lessons
The video’s central contribution is its ordered workflow: establish macro context, form a higher-time-frame premise, mark relevant levels, wait for aligned lower-time-frame structure, and react when the expected behavior fails to appear. ICT presents fractal analysis as the bridge between the broad premise and a smaller execution pattern.
For study purposes, each stage can be documented separately so that a later review distinguishes the original macro premise, the entry trigger, and the evidence that supported holding or exiting. That is a general educational interpretation of the framework, not investment advice, a performance promise, or validation of the method.
Related Video
Resources
- ICT – Trading Plan Development 3 (YouTube) — Primary source video
- Commitment of Traders (COT) Reports — CFTC — Referenced in transcript for weekly positioning data; unofficial and untested for trading decisions
- US Treasury Yield Curve — Treasury.gov — Source for 2yr, 5yr, 10yr, 30yr yields referenced in the lesson
- US Dollar Index (DXY) — ICE — Barometer for foreign currency markets per ICT’s framework

