
Key takeaways
ICT market structure organizes directional analysis across three timeframes based on holding period.
Read the full summary
ICT market structure organizes directional analysis across three timeframes based on holding period. Position trading uses monthly, weekly, and daily charts, swing trading uses daily, four-hour, and one-hour charts, short-term trading uses four-hour, one-hour, and 15-minute charts, and day trading uses one-hour, 15-minute, and five-minute charts. The highest timeframe sets premise and bias, the middle timeframe refines structure and manages the position, and the lowest timeframe times entries. Traders mark support, resistance, and whether price is trending, reversing, or consolidating, then seek structural shifts such as a short-term swing-low break after a rally into resistance for a bearish case or a prior-high break after support holds for a bullish case. Retracements, broken support acting as resistance, nested swing points, lower highs and lower lows, and price-based projections of completed swing distance can help preserve or challenge the premise, but levels are not exact boundaries. Bias remains conditional on timeframe, invalidation criteria, and alignment with the setup, while targets and trade paths remain uncertain and do not imply 100 percent accuracy or profitability.
How we researched this article
BestProps used document-based research from primary firm sources, checked September 25, 2026. The complete source list, scope, limitations, and commercial-state record appear near the end of this article.
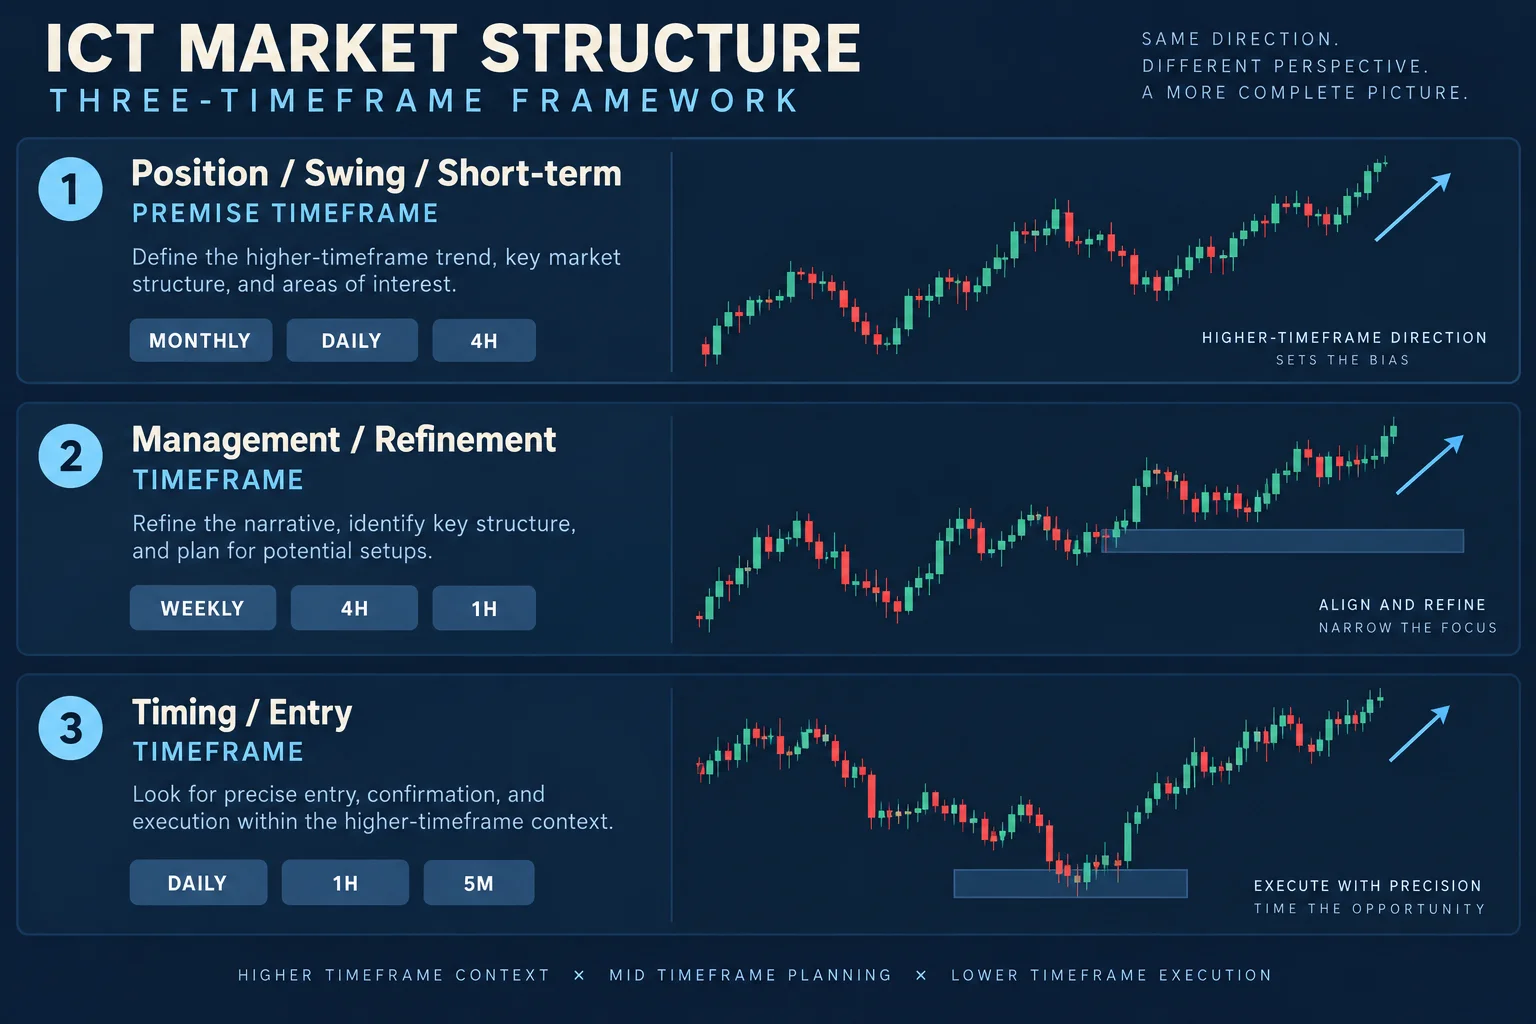
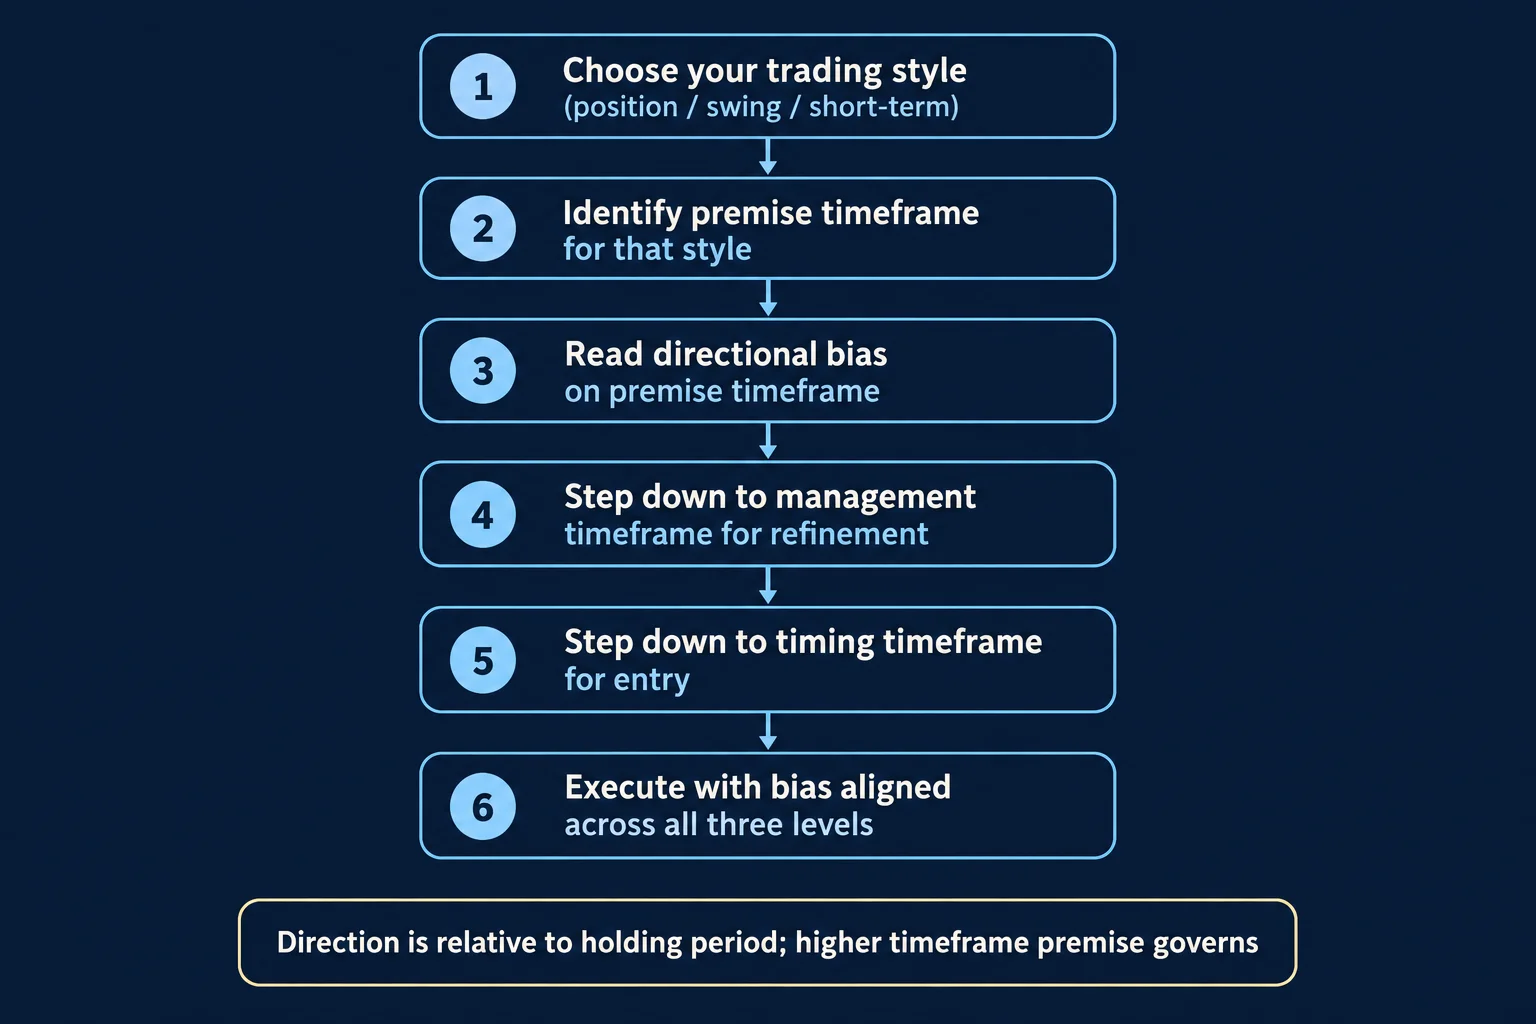
In Essentials To ICT Market Structure, ICT presents market structure as a way to organize directional analysis across three related timeframes. The lesson does not offer a formula for predicting every move. Instead, it asks traders to select a trading style, establish context on a higher timeframe, refine that context on a middle timeframe, and use a lower timeframe for timing.
The central message is that market direction is relative to the trader’s holding period. A day trader and a swing trader can reasonably hold different biases because they are studying different portions of the same price movement.
Choose Your ICT Market Timeframe
ICT begins by noting how easily a new trader can become overwhelmed by monthly, weekly, daily, intraday, and tick charts. At 1:28, he proposes starting with a simpler question: which timeframe and style are you actually trading?
He groups the analysis into three-timeframe sets:
- Position trading: monthly for the premise, weekly for the middle level, and daily for the lower level.
- Swing trading: daily for the premise, four-hour for management and refinement, and one-hour for timing.
- Short-term trading: four-hour for directional context, one-hour for management, and 15-minute for timing.
- Day trading: one-hour for context, 15-minute for management, and five-minute for entry timing.
These combinations are introduced between 3:40 and 6:36. ICT also says they are a framework rather than a prohibition against consulting other charts.
Give Each ICT Timeframe One Job
At 7:18, ICT reduces the framework to three functions:
- Highest timeframe: establish the trade premise and directional bias.
- Middle timeframe: refine relevant structure and manage the position.
- Lowest timeframe: look for an entry consistent with the larger premise.
For example, under his swing-trading model, the daily chart frames the idea, the four-hour chart supplies more detailed structure, and the one-hour chart is used for timing. This hierarchy is meant to prevent a small fluctuation on an entry chart from overriding the larger context without a structural reason.
Use Support and Resistance in ICT Market Structure
ICT does not treat a trend label as sufficient by itself. Around 8:48, he argues that a higher-timeframe bullish premise may become less useful when price is approaching significant resistance. In his framework, support and resistance therefore shape how market structure should be interpreted.
He also distinguishes among trending, reversing, and consolidating conditions at 10:24. This “market profile” classification is not explained as a mechanical indicator in the video. It functions as a contextual question: is price progressing, turning, or remaining inside a range?
Understand an ICT Market Structure Shift
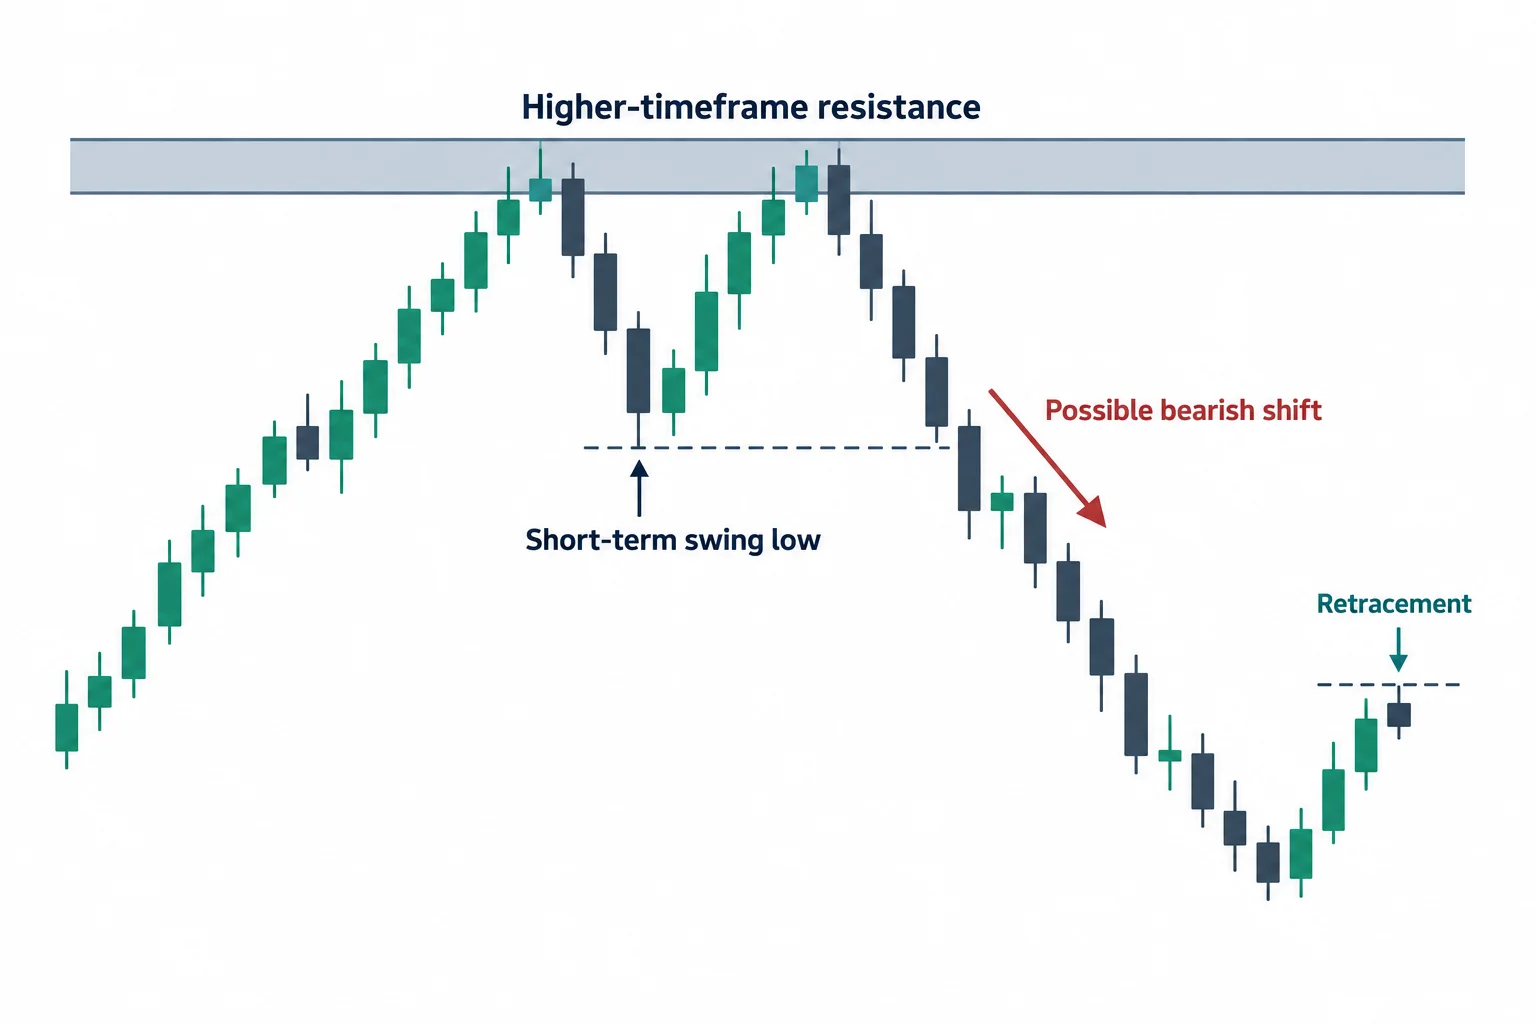
In the bearish illustration beginning near 11:00, ICT describes price rallying into higher-timeframe resistance and then breaking a short-term swing low. He treats that break as evidence of a possible bearish shift. The next step is to inspect lower timeframes for retracements and resistance rather than immediately assuming that every downward tick is an entry.
The bullish logic is the inverse: after price reaches support, ICT looks for support to hold and resistance or prior short-term highs to be broken. Pullbacks may then be evaluated in the direction of the higher-timeframe premise.
Importantly, ICT repeatedly describes these developments as anticipated rather than known. At 14:14, he calls the path between a possible entry and an expected objective a “gray area.” The transcript explicitly acknowledges that price may fail to reach the target or may reverse against the position.
Map Swings and Retracements in ICT Market Structure
Later, ICT discusses measuring a completed swing and projecting a comparable distance after a retracement. The explanation starts around 23:42. He says this can be done from price itself rather than requiring Fibonacci tools.
He combines that projection with structure: in a bearish context, a broken support area may act as resistance on a retracement, while successive lower highs and lower lows preserve the bearish premise. He also cautions that support and resistance are not perfectly precise boundaries, so a modest move through a prior level does not automatically settle the structural question.
The generated captions become unclear when he names some categories of swing highs and lows near 28 minutes. What is reliably supported is the broader method: mark recurring swing points, observe how shorter and larger swings nest together, and use that hierarchy to distinguish local movement from the dominant structural leg.
Keep ICT Market Bias Conditional
One of the lesson’s clearest qualifications appears at 32:00. ICT says that a bullish bias does not mean every day will produce a profitable bullish trade. A trader following this framework waits for price to align with the selected timeframe, level, and setup rather than attempting to trade every movement.
At 34:34, he makes the timeframe-dependent nature of bias especially explicit: market participants can potentially trade both directions during the same day, but an individual trader must define the direction relevant to that trader’s own horizon and plan.
Use the ICT Market Structure Framework Responsibly
A practical way to interpret this lesson is as an analytical checklist rather than a signal:
- Define the intended holding period before opening several charts.
- Select three timeframes with distinct roles.
- Mark major support, resistance, and the current market condition on the highest chart.
- Look for a structural change, such as a relevant swing being broken.
- Use the middle chart to refine the level and the lowest chart only for timing.
- Record what would invalidate the premise instead of treating bias as certainty.
ICT closes by stressing uncertainty and explicitly stating that directional bias does not guarantee accuracy or profitability. His summary from 39:12 onward is to accept incomplete visibility, avoid expecting 100% accuracy, and keep activity controlled. This material is educational commentary on ICT’s framework, not investment advice or evidence that the approach is profitable.
Explore More ICT Market Structure Resources
- Essentials To ICT Market Structure (YouTube) Primary video source for this article.
- Market Structure Definition (Investopedia) General reference on how market structure analysis frameworks work.
- GBP/USD Charts (TradingView) Live and historical charts for GBP/USD used in ICT examples.
- Forex Timeframes Explained (BabyPips) Background on multiple timeframe analysis concepts discussed in the lesson.


