
Key takeaways
ICT defines the Asian range as the highest high and lowest low formed from seven p.m.
Read the full summary
ICT defines the Asian range as the highest high and lowest low formed from seven p.m. to midnight New York time, with both boundaries extended into later sessions as reference levels rather than standalone signals. Traders must translate New York time to broker or chart platform time and adjust for daylight saving. The model requires an independent higher-time-frame directional bias, session timing, and a liquidity narrative. In the bullish model, price should first take the Asian range low or move below the midnight open, recover, and later approach or break the range high. In the bearish model, price first moves above the range high or midnight open and weakens, or breaks below the range low and retests it as possible resistance. London and New York timing can strengthen setups within ICT’s methodology. ICT recommends manually marking the five-hour range to study which boundary is crossed first, whether price accepts beyond it or returns inside, and whether that behavior supports the prior bias. He credits Chris Laurie with introducing the framing and cautions that the range is not magical, while the presentation provides no independent order-flow evidence, statistical testing, verified fills, or proof of profitability.
How we researched this article
BestProps used document-based research from primary firm sources, checked September 25, 2026. The complete source list, scope, limitations, and commercial-state record appear near the end of this article.
ICT Forex Asian Range Overview
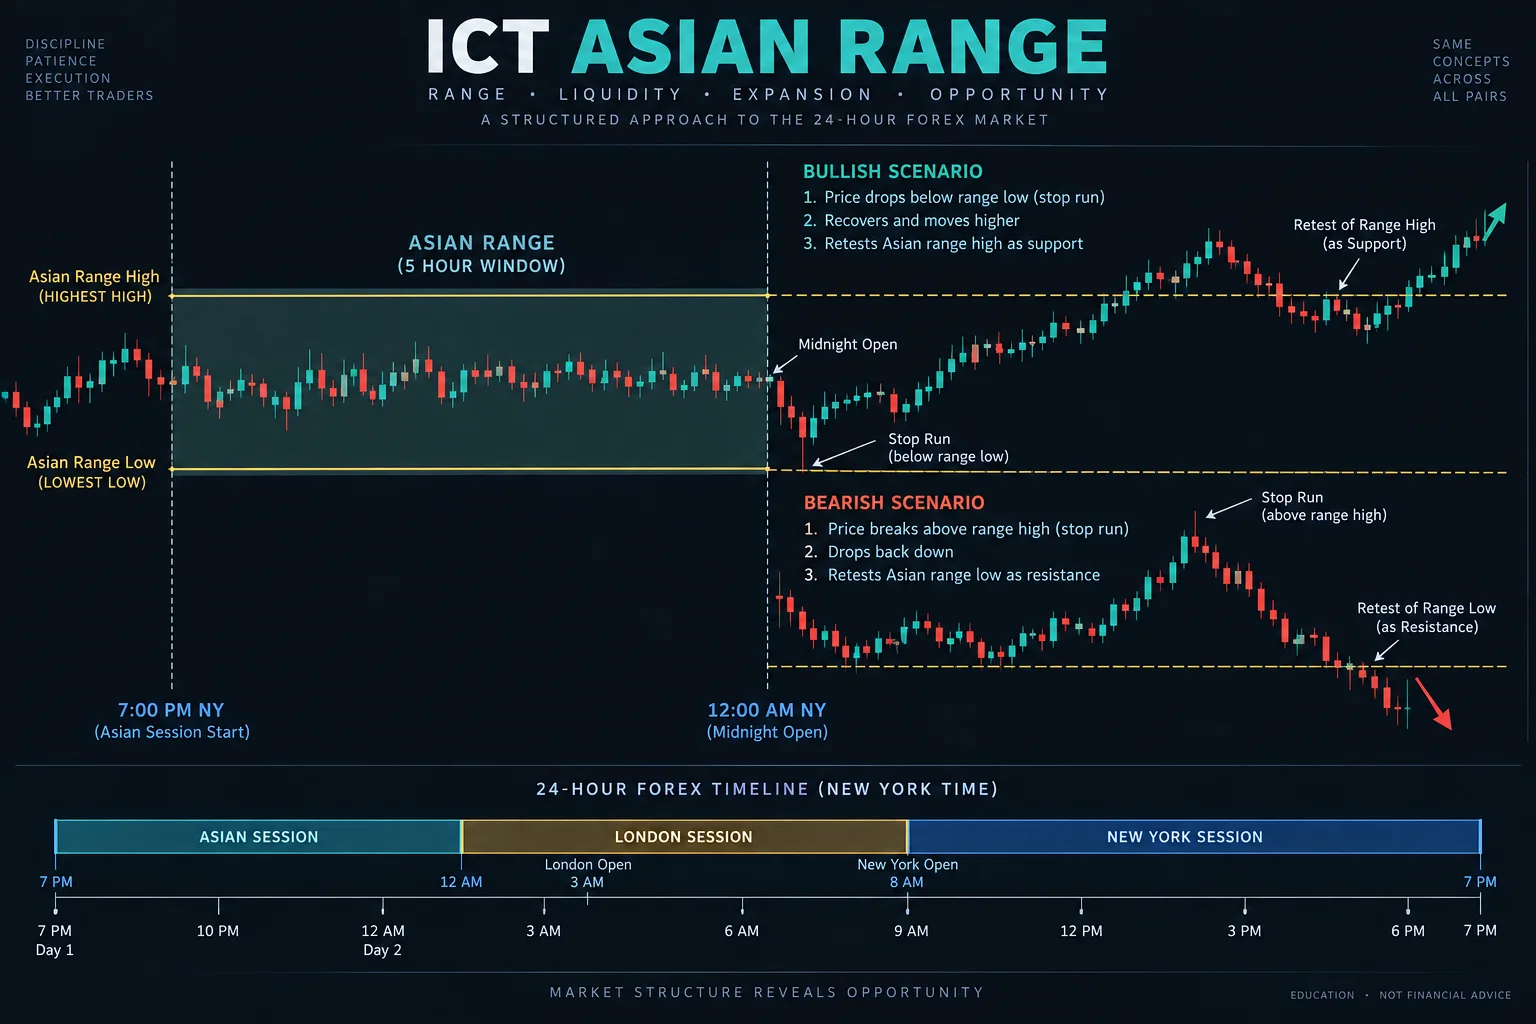
In ICT Forex – Implementing The Asian Range, ICT explains how he marks a five-hour overnight range and uses its boundaries to organize an intraday market narrative. He presents separate bullish and bearish models, but repeatedly stresses that the range is not a standalone signal. In his framework, it must be combined with a directional bias, time-of-day context, and an expectation about where liquidity may be located.
ICT also says that he did not create the Asian range concept. He credits trader Chris Laurie with introducing him to this particular framing, which he subsequently incorporated into his own approach. That attribution begins near 1:48.
How ICT Defines the Asian Range
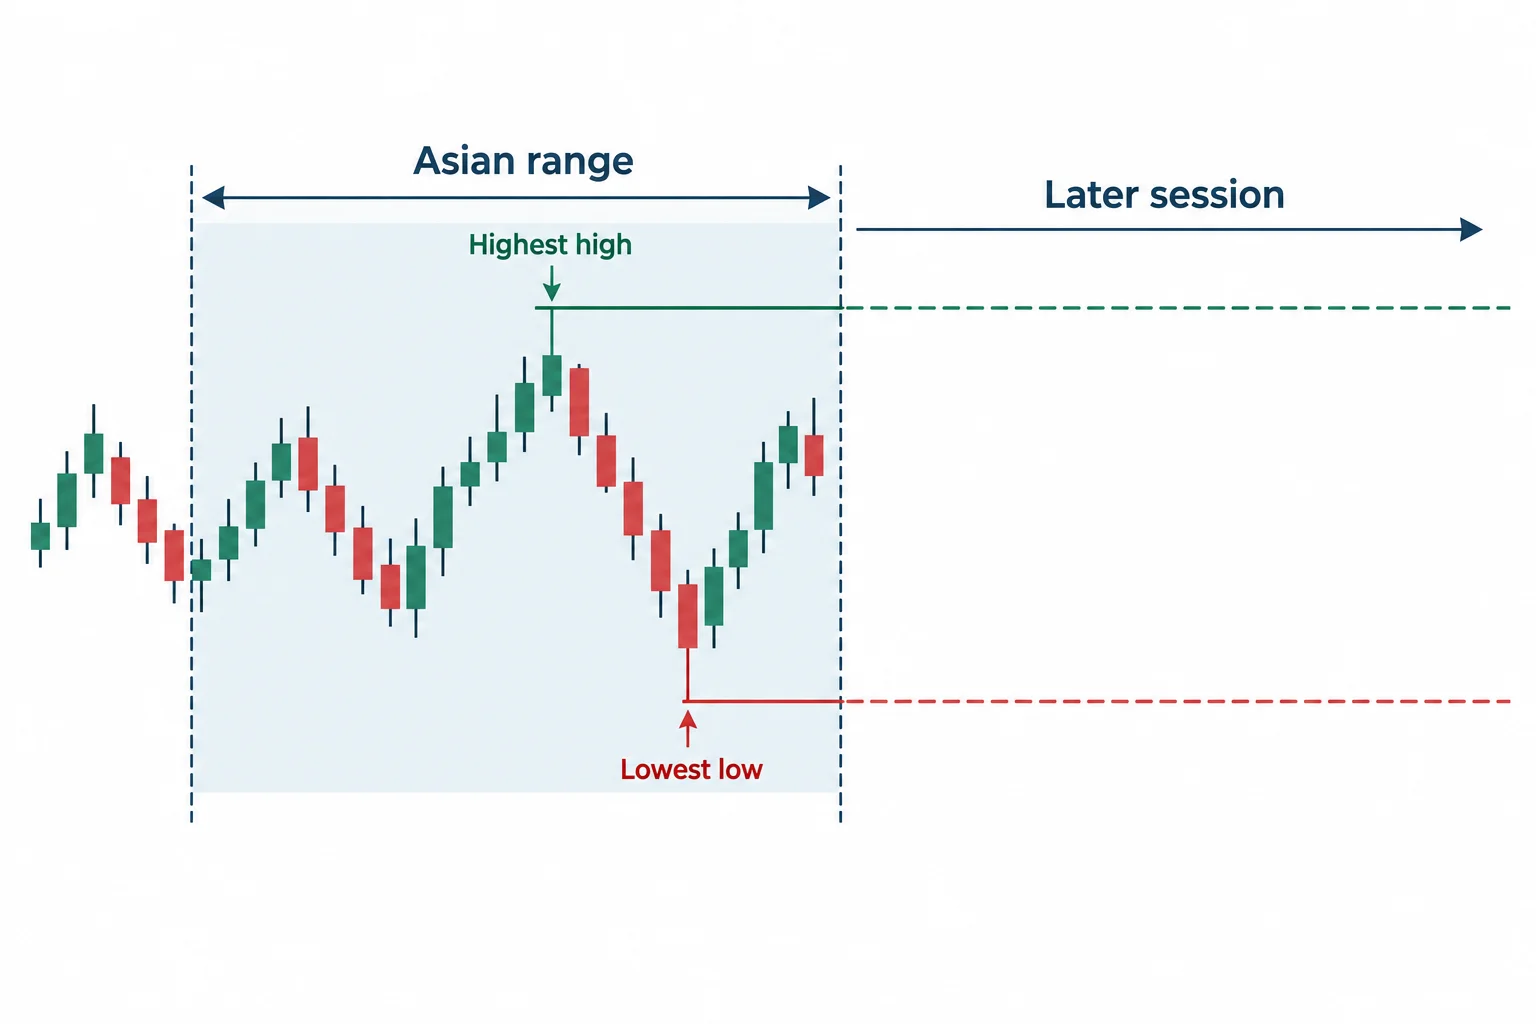
ICT’s definition is specific: the range begins at 7:00 p.m. New York time and ends at midnight New York time. Its upper boundary is the highest high formed during those five hours, while its lower boundary is the lowest low. He explains this definition at 4:22.
His chart-marking process is straightforward:
- Find 7:00 p.m. New York time on the chosen charting platform.
- Place one vertical marker there and another at midnight New York time.
- Identify the highest high and lowest low inside that interval.
- Extend those horizontal boundaries into the later trading session.
Because brokers and charting platforms can use different server times, the trader must translate New York time correctly. Daylight-saving changes also need to be handled carefully rather than assuming a fixed platform offset throughout the year.
ICT Forex Asian Range Market Narrative
Beginning around 7:10, ICT describes his interpretation of the range. He treats the high and low as areas around which breakout entries and protective stops may accumulate. A move through one boundary can therefore attract breakout participation or trigger stops.
In ICT’s model, a narrow overnight consolidation is particularly noteworthy. He proposes that price may first move through one side of the range, place traders on what he considers the wrong side, and then travel in the opposite direction. This is ICT’s market interpretation, not a fact established by the transcript through independent order-flow data or statistical testing.
The central lesson is therefore not “trade every range breakout.” Instead, ICT asks which side is more relevant given a pre-existing higher-time-frame bias. He warns that using the same boundary mechanically in every market condition can produce conflicting decisions.
Applying the ICT Asian Range in Bullish Markets
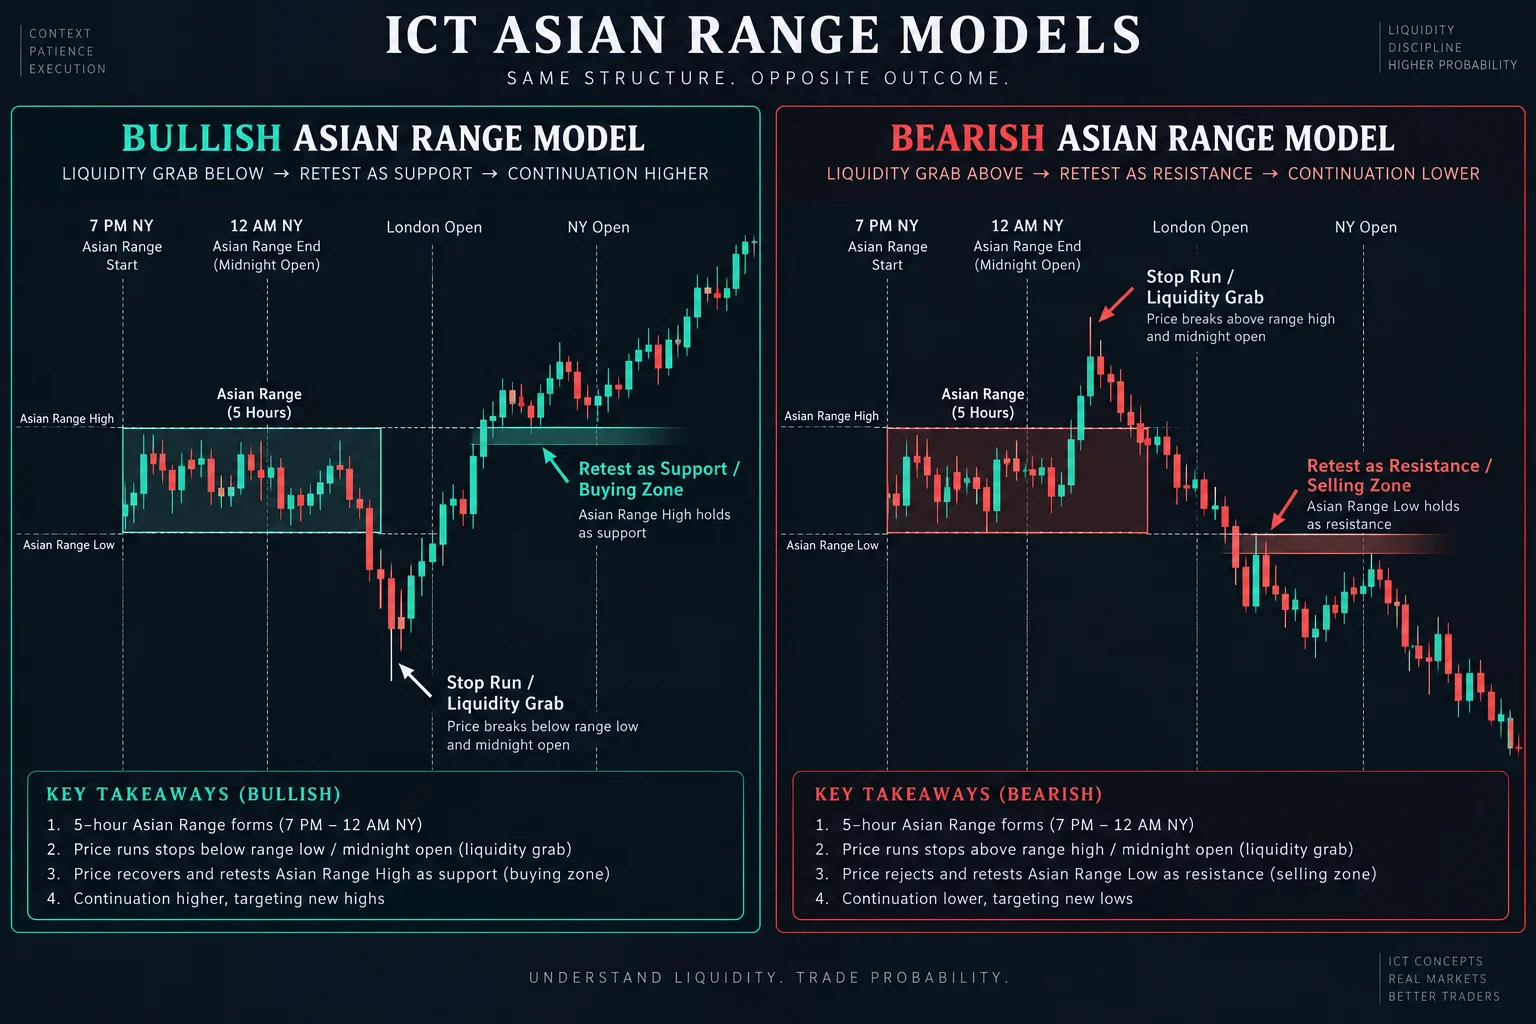
The bullish model starts at 11:02. ICT assumes that higher-time-frame analysis has already produced a bullish expectation. Under that assumption, he extends the Asian range boundaries forward and watches how price interacts with them after midnight.
His preferred sequence is broadly:
- Establish a bullish daily or higher-time-frame narrative independently of the range.
- Observe price move below the midnight opening price or through the Asian range low.
- Look for recovery rather than treating the downside break as an automatic short signal.
- Use the Asian range high as a potential reference when price returns to it.
Near 23:00, ICT discusses a chart example in which a return to the extended range high overlaps with his bullish narrative and New York-session timing. He characterizes that overlap as potential buying context. The captions describe the setup but do not provide reliably visible prices, independently verified fills, or a documented outcome beyond ICT’s narration.
ICT’s key qualification appears around 25:19: in his bullish version, he wants the Asian range low taken before considering a later break above the range high. That sequence is an internal rule of the model, not evidence that every such pattern will reverse higher.
Applying the ICT Asian Range in Bearish Markets
The bearish section begins at 26:01. It largely mirrors the bullish model. ICT first assumes a bearish higher-time-frame bias, then looks for price to move above the midnight open or Asian range high before weakening.
He presents two principal bearish reference points:
- A move above the Asian range high, interpreted within an already bearish narrative.
- A break below the Asian range low followed by a return to that boundary, which he treats as possible resistance.
ICT summarizes these alternatives around 34:14. He adds that London- or New York-session timing strengthens the setup in his methodology. His probability statements are personal claims in the presentation; the video supplies no independent test results with which to validate them.
What the ICT Asian Range Can and Cannot Show
A useful educational interpretation is to view the Asian range as a structured observation window. It gives the analyst consistent reference levels and encourages explicit questions: Was the range narrow or wide? Which boundary was crossed first? Did price accept beyond it or return inside? Does that behavior align with the previously stated directional thesis?
That interpretation is distinct from assuming that the range predicts direction. ICT expressly says near 3:47 that the range itself is not magical and requires context. A disciplined study process could therefore record the range and subsequent behavior without presuming that every example is actionable.
At the end of the lesson, ICT recommends drawing the levels manually rather than relying immediately on an indicator. His stated purpose is to build familiarity with recurring price behavior through direct chart review. Historical observation can support learning, but it does not remove hindsight bias, execution costs, spread variation, or the possibility that a directional thesis is wrong.
This summary is educational commentary on ICT’s presentation, not investment advice or a claim that the method is profitable.
Related Resources
- ICT Forex – Implementing The Asian Range – the complete primary source video.
- Investopedia: Candlestick Charting – general reference for reading the candle patterns discussed in the lesson.
- Investopedia: Market Structure – general reference for the break and retest logic the method relies on.
- Investopedia: Risk/Reward Ratio – general reference for the stop and target framing demonstrated in the lesson.

