
Key takeaways
ICT’s daily-chart Forex framework helps traders who cannot monitor intraday markets establish directional bias by marking rolling 12-month, quarterly, calendar-month, and previous-week highs and lows, classifying markets as trending, ranging, or unclear, and watching for price to breach equal or older highs or lows before returning through them as evidence of rejection.
Read the full summary
ICT’s daily-chart Forex framework helps traders who cannot monitor intraday markets establish directional bias by marking rolling 12-month, quarterly, calendar-month, and previous-week highs and lows, classifying markets as trending, ranging, or unclear, and watching for price to breach equal or older highs or lows before returning through them as evidence of rejection. The workflow starts with the US Dollar Index and then cross-checks major pairs, avoiding trades near the middle of ranges or where structure is ambiguous. In the late-December 2017 examples, ICT was neutral-to-bearish on EUR/USD, avoided unclear GBP/USD, AUD/USD, and NZD/USD, and viewed USD/CAD as better aligned with possible dollar strength after lows were breached and rejected while relatively equal highs remained overhead, though year-end conditions reduced confidence. USD/JPY illustrates the core rule of waiting at obvious daily-range boundaries rather than initiating ideas in the middle, then targeting a conspicuous opposing high or low after rejection. Traders should mark double tops, double bottoms, swing highs, and swing lows, record hypotheses, accept that setups may take days or weeks, and avoid assuming any liquidity sweep, reversal, or target is guaranteed. The lesson supplies no reliable prices, documented fills, performance outcomes, complete risk model, or mechanical trading system.
How we researched this article
BestProps used document-based research from primary firm sources, checked September 25, 2026. The complete source list, scope, limitations, and commercial-state record appear near the end of this article.
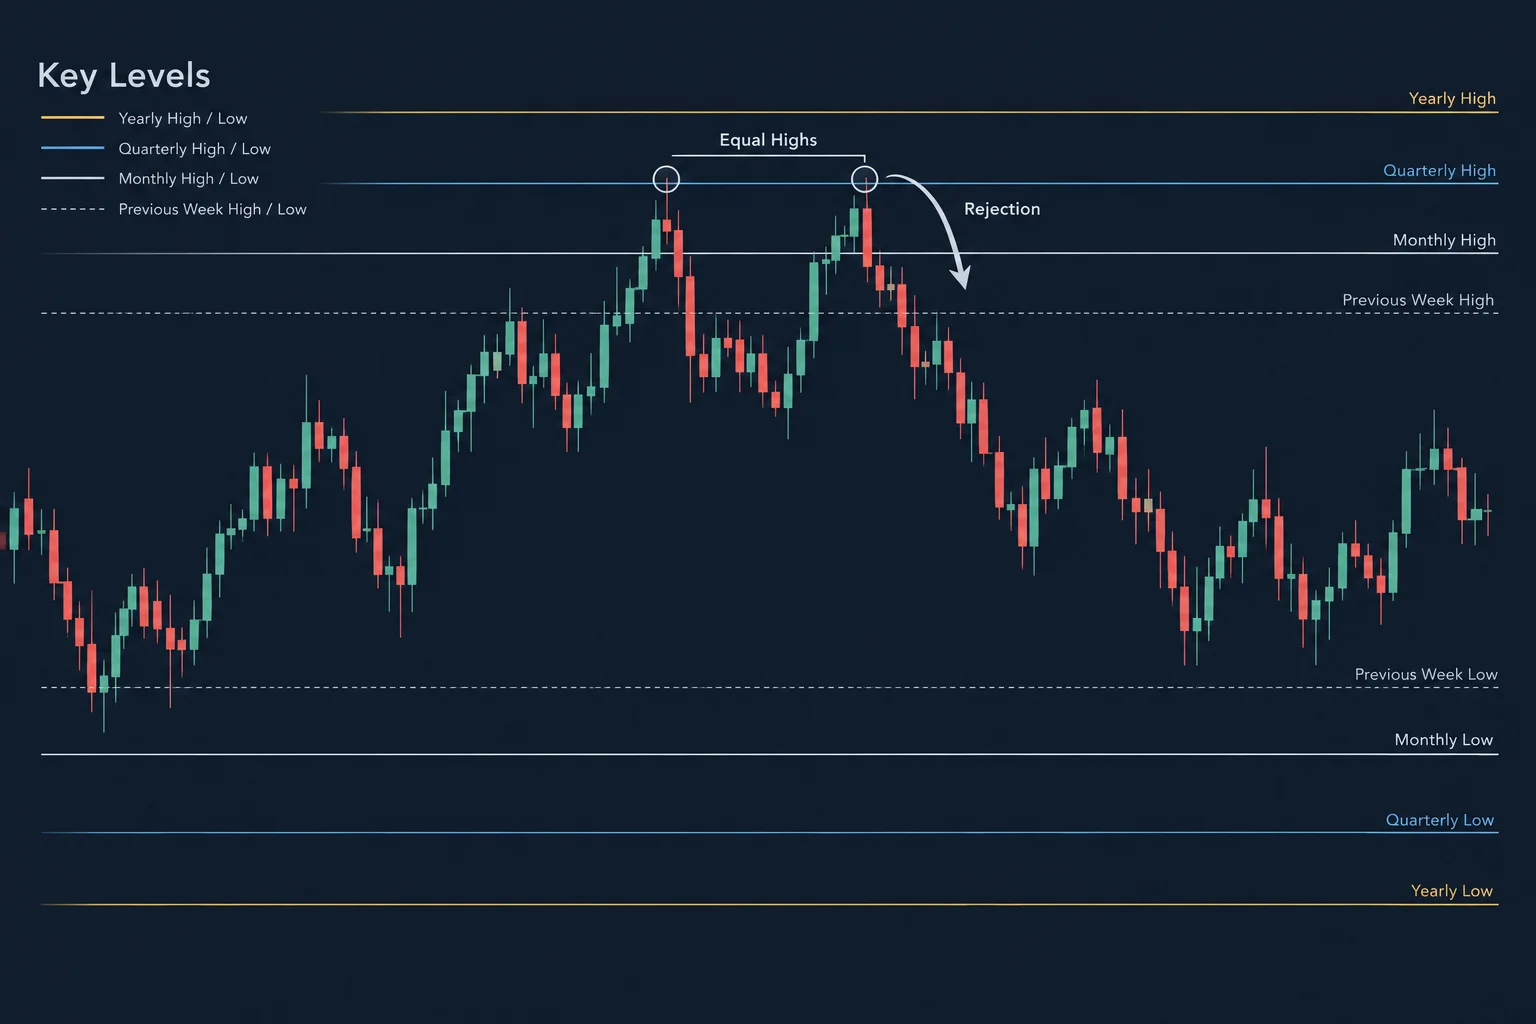
In ICT Forex – Higher Time Frame Concepts, ICT presents a daily-chart framework intended primarily for traders who cannot continually monitor intraday markets. The lesson focuses on identifying fixed reference levels, observing how price behaves around prior highs and lows, and declining to trade when a market has no clear directional structure.
The examples come from a late-December 2017 market review covering the US Dollar Index and several major currency pairs. They illustrate ICT’s interpretation at that time; the transcript does not provide reliable chart prices, documented fills, or later outcomes.
Mark ICT Higher Time Frame Key Levels
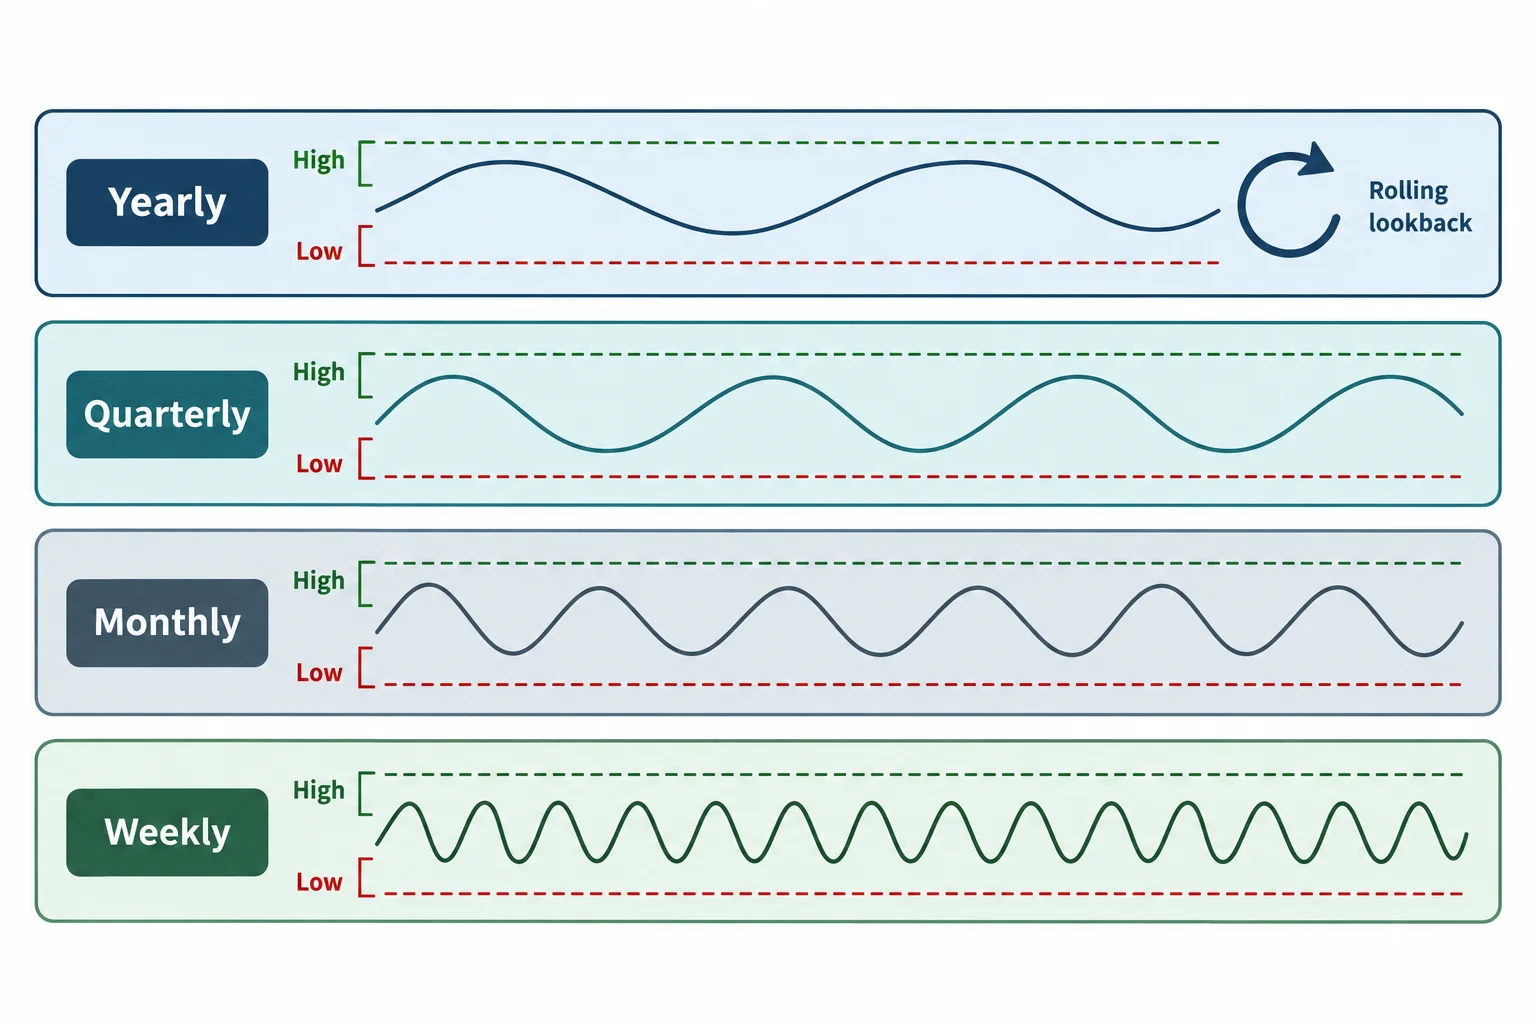
ICT opens by defining the lesson’s main subjects as key levels and price rejections. At 0:33, he identifies yearly, monthly, and weekly highs and lows as the principal references. His yearly range is rolling: from the current date, look back 12 months and mark the highest high and lowest low rather than automatically using January through December.
The transcript also refers to quarterly ranges. Although one phrase near the introduction is garbled by automatic captioning, the later chart discussion supports separating yearly, quarterly, monthly, and previous-week reference points.
- Yearly: the high and low of the trailing 12 months.
- Quarterly: highs and lows associated with approximately three-month segments.
- Monthly: recent calendar-month highs and lows.
- Weekly: most notably, the previous week’s high and low.
The practical advantage is consistency. These levels are based on defined periods rather than a level moved retrospectively to fit a narrative. ICT later emphasizes this point in the USD/JPY example, describing the references as specific rather than ambiguous (21:11).
Use ICT Sweeps at Higher Time Frame Levels
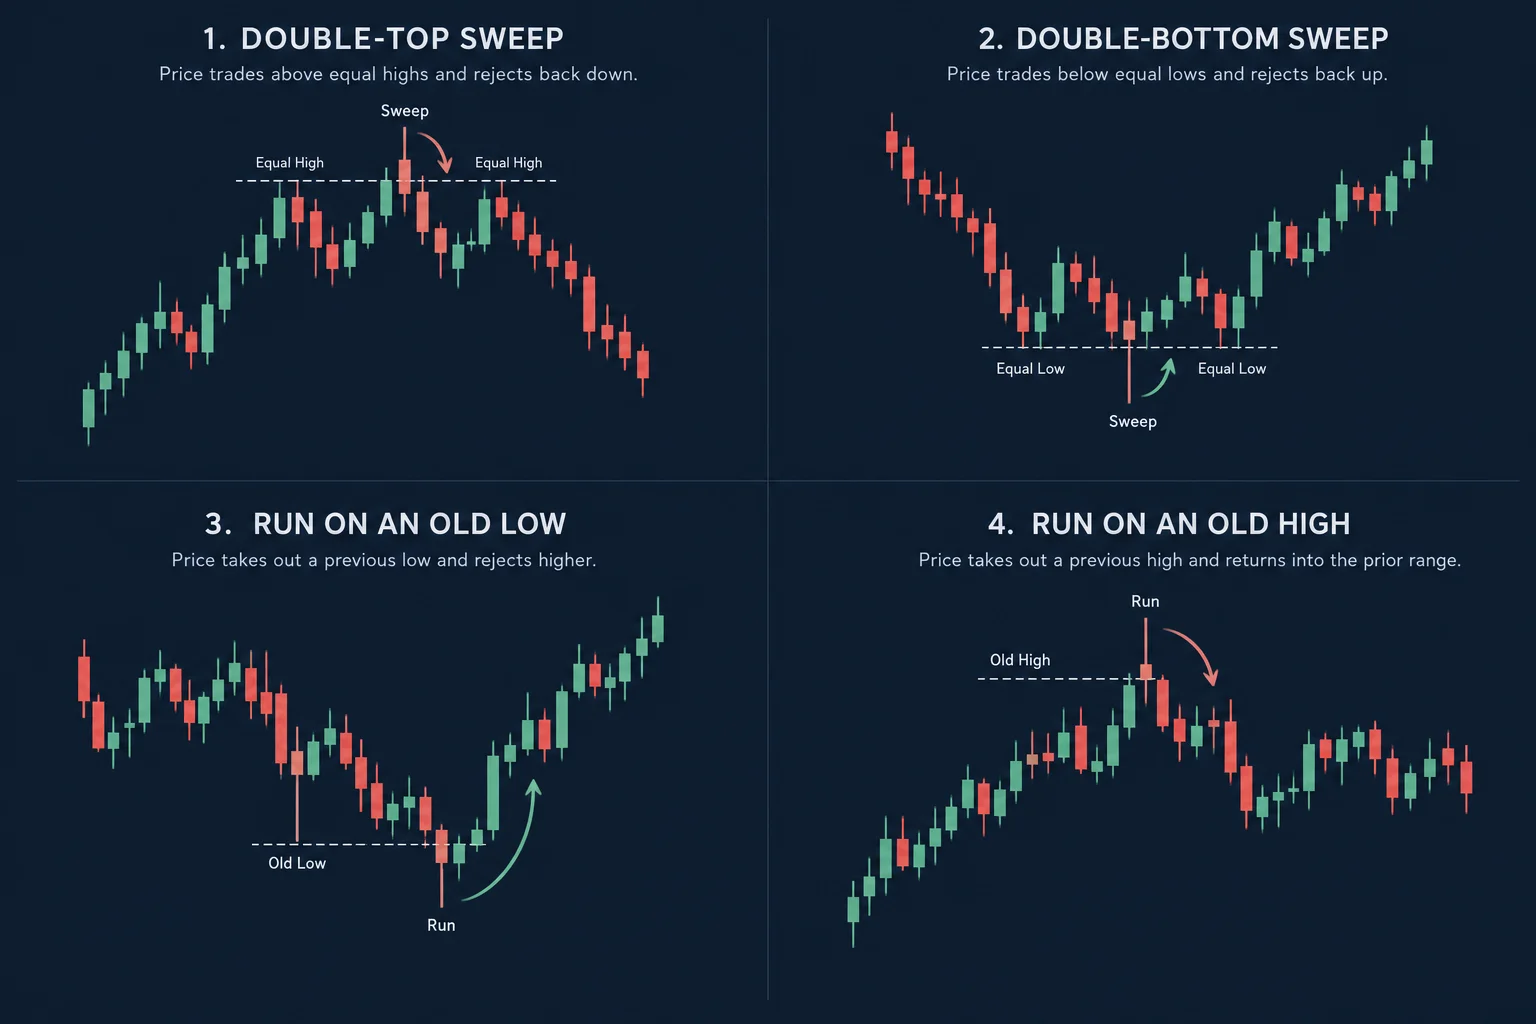
At 1:52, ICT introduces four recurring price behaviors:
- A move above equal or nearly equal highs followed by a return lower.
- A move below equal or nearly equal lows followed by a return higher.
- A run below an older low that subsequently rejects.
- A run above an older high that subsequently falls back into the prior range.
In ICT’s terminology, equal highs and lows represent potential liquidity areas. His analysis asks which conspicuous high or low may be approached next and whether price accepts beyond it or quickly returns. A brief breach alone is not the full signal described in the lesson: the return through the old level supplies evidence of rejection.
These are ICT’s market interpretations, not proof that every equal high or low will be swept or that a reversal must follow. A level can fail, price can continue through it, and a transcript cannot establish the profitability of the framework.
Set Forex Direction With Higher Time Frame Structure
ICT begins his chart review with the Dollar Index and asks whether the daily market is trending, ranging, or potentially reversing (5:17). This classification matters because a market in the middle of a broad range may not offer a useful higher-time-frame setup.
He does not claim certainty about whether the Dollar Index will revisit or break a particular low. Instead, he frames possible paths and argues that analysis can still define a range between the current area and a suspected objective. He also notes that late December can produce consolidation, while presenting that seasonality as part of his own profiling process rather than a guaranteed rule.
At 8:39, ICT states that the same price-action ideas used on lower time frames can be applied to daily charts. In this lesson, “fractal” means he expects similar patterns of highs, lows, sweeps, and rejections to appear across chart intervals, not that their timing or outcome is identical.
Cross-Check Forex Pairs With Higher Time Frame Signals
ICT cycles through the major pairs after assessing the Dollar Index. His historical read was neutral-to-bearish on EUR/USD, partly because he interpreted the euro as the inverse side of possible dollar strength. GBP/USD appeared less clear to him, and he explicitly preferred not to trade it under those conditions.
AUD/USD and NZD/USD were also treated as uncertain. In the Australian dollar discussion, ICT says price was near the middle of a range and that he would wait for a new setup (13:59). This is an important part of the lesson: scanning markets is not merely a search for a trade. It is also a process for eliminating charts with poor location or unclear structure.
By contrast, ICT considered USD/CAD more aligned with his contemporaneous dollar view. He observed that lows had been breached and rejected while relatively equal highs remained above, leading him to identify those highs as a possible objective (15:56). He nevertheless reduced his confidence because the review occurred close to the year-end holidays.
Apply Higher Time Frame Levels to USD/JPY
The most extended demonstration begins around 18:25. ICT characterizes USD/JPY as being trapped in an obvious daily range. His central rule is to avoid initiating a higher-time-frame idea in the range’s middle. Instead, he waits for price to reach or run an old boundary, then looks for rejection and a possible move toward an opposing high or low.
For someone limited to daily charts, this can mean waiting many days or weeks. ICT recommends beginning simply: mark obvious double tops, double bottoms, individual swing highs, and individual swing lows. Then note where price most recently came from and identify the conspicuous level on the other side of the market.
Follow an ICT Higher Time Frame Checklist
- Open the Dollar Index daily chart, then review the major currency pairs.
- Mark the relevant rolling-year, quarterly, monthly, and previous-week highs and lows.
- Decide whether each chart is trending, ranging, or structurally unclear.
- Identify old highs, old lows, and relatively equal highs or lows near current price.
- Observe whether price trades beyond a level and then returns through it.
- Avoid forcing a directional view when price is near the middle of a range.
- Record the hypothesis and study what follows rather than assuming the projected level must be reached.
Watch the full lesson: ICT Forex – Higher Time Frame Concepts (27:16)
If the embed does not play, use the link above to watch on YouTube.
Further Reading
- ICT YouTube Channel – Inner Circle Trader (original source)
- Multiple Time Frame Analysis – BabyPips (general education)
- Liquidity Definition – Investopedia (general reference)
This checklist is a general educational interpretation of the workflow demonstrated in the video. It is not investment advice, a mechanical trading system, or evidence of expected performance. ICT mentions stop losses while acknowledging that markets can move against a scenario, but the lesson does not provide a complete risk-management model.


