
Key takeaways
ICT Charter Price Action Model 11 is an unverified day-trading framework that uses weekly range expansion for directional bias, an old daily high or low as external liquidity, and intraday retracements into internal liquidity such as fair value gaps, liquidity voids or order blocks for entry.
Read the full summary
ICT Charter Price Action Model 11 is an unverified day-trading framework that uses weekly range expansion for directional bias, an old daily high or low as external liquidity, and intraday retracements into internal liquidity such as fair value gaps, liquidity voids or order blocks for entry. Preferred context requires an estimated 50-to-100-pip weekly move toward the objective, while trade management targets a nominal 30 pips and favors exiting before the exact level to account for spreads and retail feed differences. The New Zealand dollar case study moves from weekly and daily analysis to hourly and 15-minute bearish imbalances and order blocks, based on analysis from the weekend of April 27, 2019 despite a February 10, 2024 upload date. An advanced contrarian variation applies only after the original external objective, called the terminus, has been reached and reversal behavior appears. ICT acknowledges losses, recommends hindsight review, walk-forward observation and paper study before demo or live trading, and provides no tested win rate, complete trade record or verified returns. The roughly fifty-nine-minute recording relies on automated transcription, so chart prices, candle geometry and executions cannot be confirmed, while its compounding examples are hypothetical arithmetic rather than documented performance and CFTC context notes that two out of three retail forex traders lose money each quarter.
How we researched this article
BestProps used document-based research from primary firm sources, checked September 24, 2026. The complete source list, scope, limitations, and commercial-state record appear near the end of this article.
In ICT Charter Price Action Model 11 – Day Trading, ICT presents a top-down framework for seeking short-term trades within an anticipated weekly price expansion. The lesson centers on a nominal 30-pip objective, but its more important theme is selectivity: determine a higher-time-frame direction, wait for a retracement into what ICT calls internal range liquidity, and look toward an older high or low as external range liquidity.
This is a summary of ICT’s interpretation of price action, not proof that the terminology predicts markets or produces a trading edge. The transcript also makes clear that losses remain possible and recommends historical study and paper observation before demo or live execution.
ICT Model 11 Day Trading Framework
ICT introduces the model as a day-trading setup operating inside a weekly range expansion. At 0:31, he says the weekly chart supplies the larger directional setting. The daily chart is then used to identify the intended draw on liquidity:
- Under a bearish weekly expectation, ICT looks toward liquidity beneath a previous daily low.
- Under a bullish weekly expectation, he looks toward liquidity above a previous daily high.
- Entries are framed on retracements into internal areas rather than on the initial stop run itself.
At 2:30, ICT summarizes this as using internal range liquidity to target external range liquidity. In his vocabulary, internal areas may include fair value gaps, liquidity voids and order blocks. External liquidity generally refers here to stops presumed to rest beyond recognizable highs or lows.
These labels are part of ICT’s own analytical framework. The transcript does not independently establish who holds orders at those levels or verify the institutional behavior attributed to them.
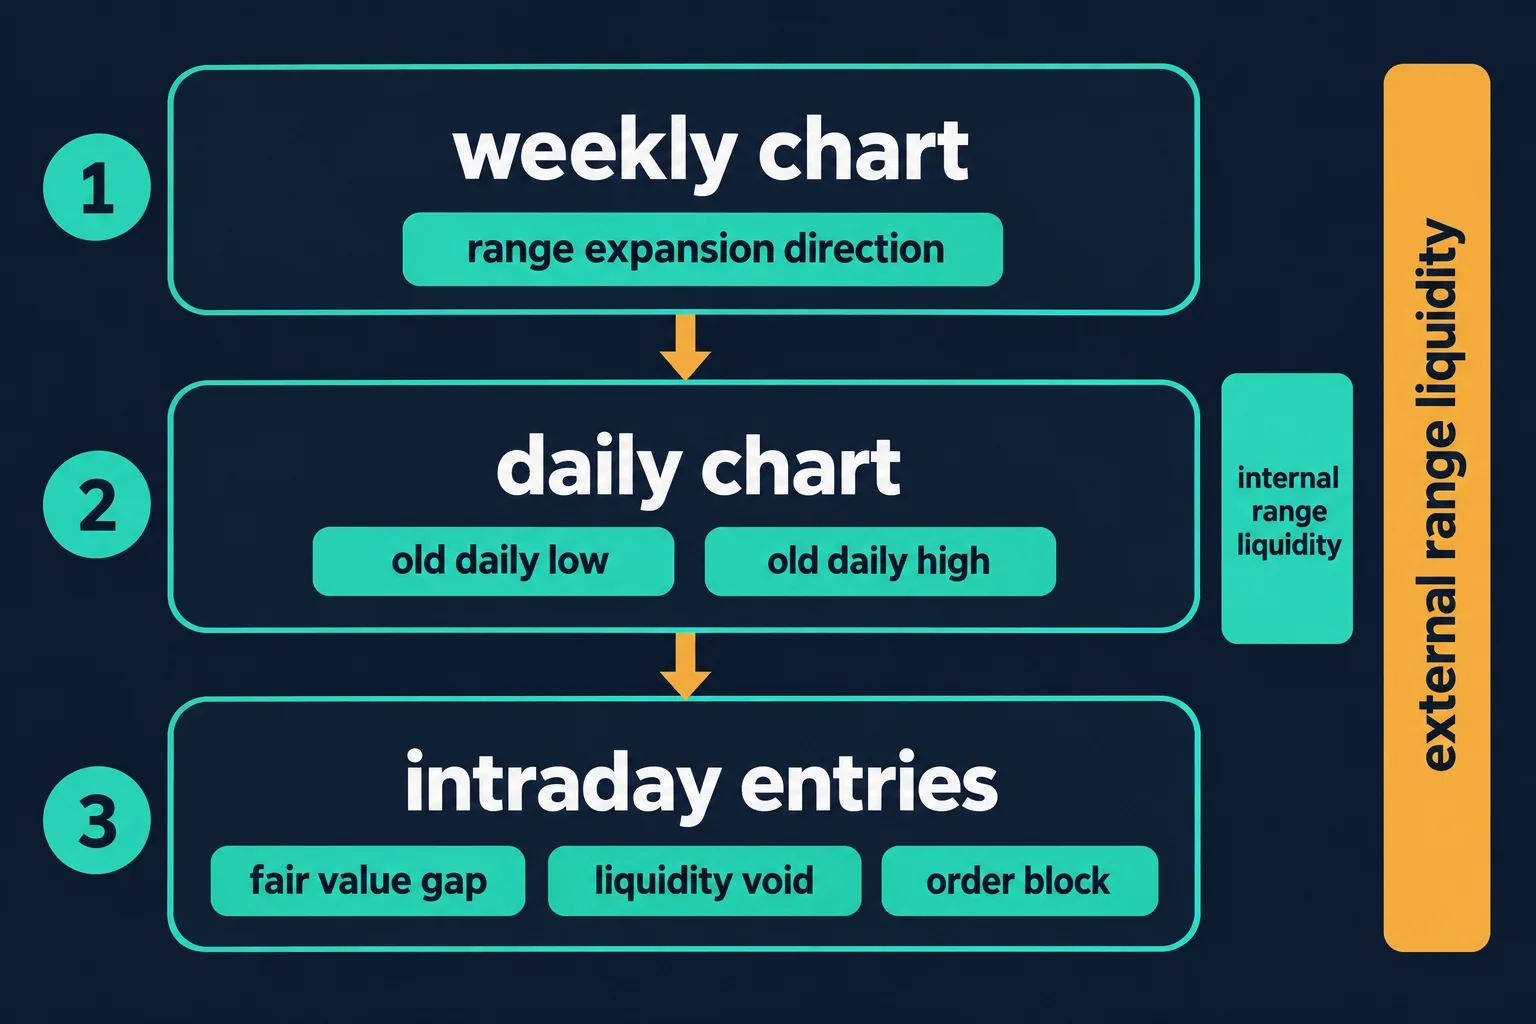
ICT Model 11 Weekly Context for Intraday Entries
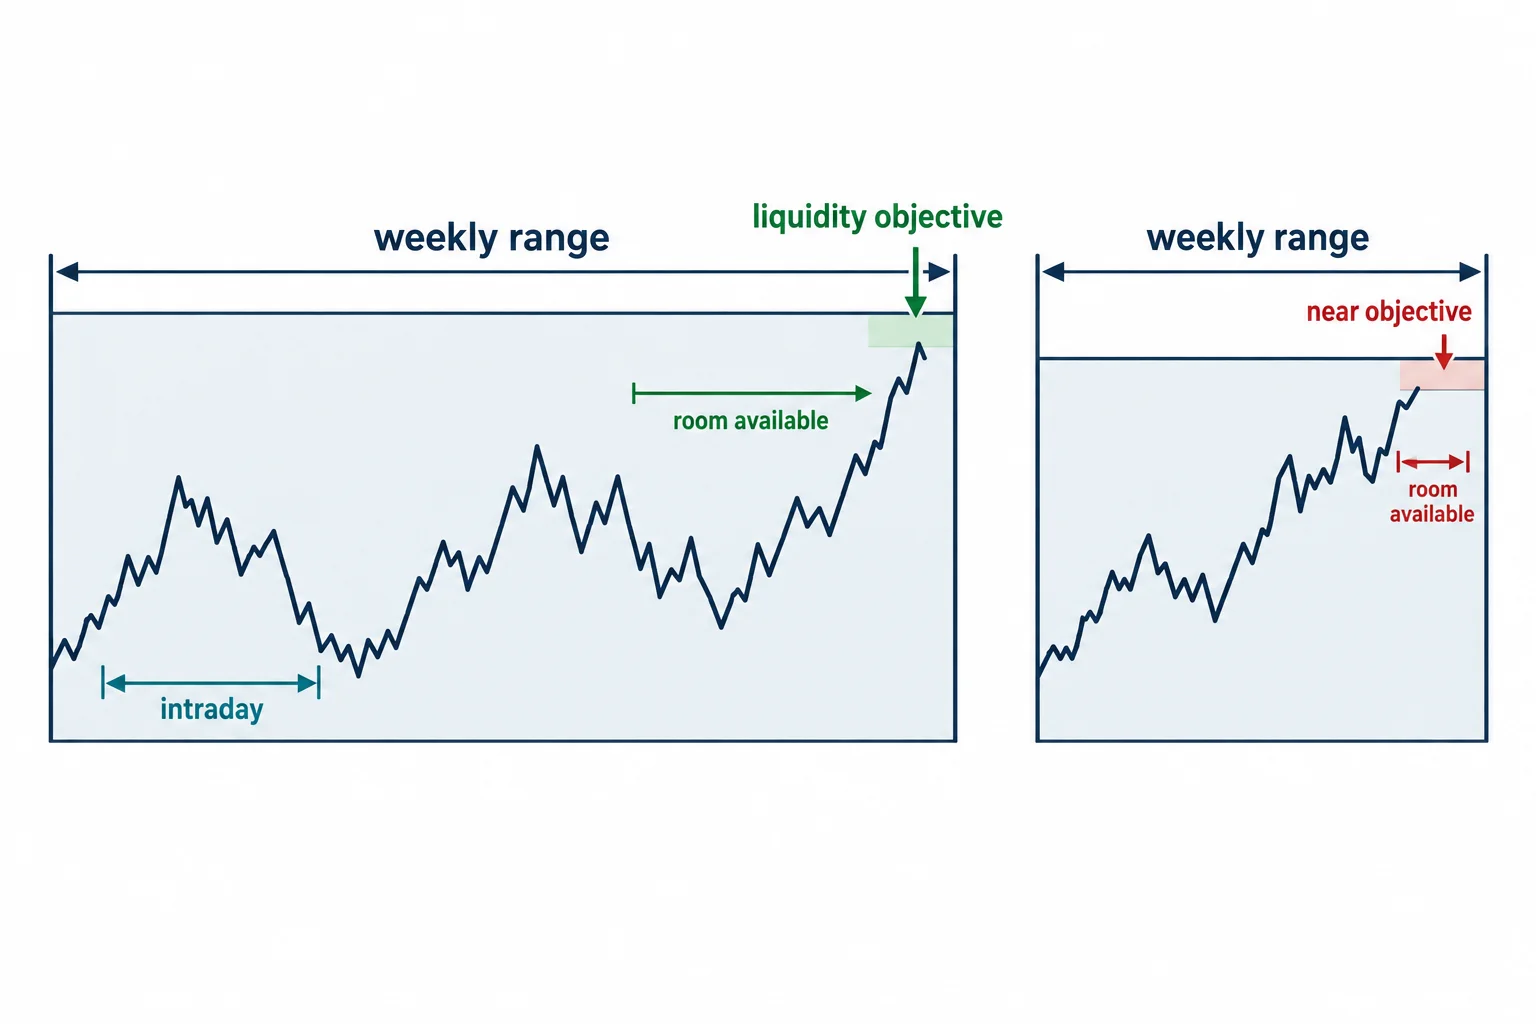
The model is not presented as a setup to force every day. ICT argues that the preferred context is a weekly chart with room for an estimated 50-to-100-pip move toward a relevant liquidity objective. He discusses that threshold at 9:05. If price is already very near the anticipated weekly destination, he says the setup does not meet Model 11’s preferred criteria.
The objective is also not to predict the weekly closing price. As explained at 6:03, ICT is instead looking for sufficient directional volatility to support a smaller intraday move. The 30-pip figure is therefore a management objective inside the proposed weekly expansion, not a forecast that every setup will travel exactly 30 pips.
ICT Model 11 Trading Sequence
- Form a weekly directional expectation.
- Identify an old daily high or low in that direction.
- Confirm that ICT’s minimum amount of weekly range appears available.
- Wait for price to expand and retrace into an internal range area.
- Use the external liquidity objective for directional context while managing the trade around a smaller target.
ICT Model 11 New Zealand Dollar Case Study
Beginning at 18:15, ICT applies the framework to the New Zealand dollar. He states that the lesson’s original market analysis concerned the weekend of April 27, 2019, even though the YouTube upload date is February 10, 2024. The recording context and upload date should therefore not be treated as the same date.
ICT describes having a bullish view of the US dollar at that time and, correspondingly, a bearish view of foreign currencies quoted against it. For the New Zealand dollar example, he says an older low supplied the downside objective. He then moves from weekly and daily context to hourly and 15-minute structures, identifying bearish imbalances and order blocks as possible retracement areas.
Because only an automated transcript is available here, the chart’s exact prices, candle geometry and hypothetical order execution cannot be independently confirmed. References in the lesson to entries and 30-pip moves describe ICT’s chart walkthrough; they are not verified trade fills or evidence of a realized result.
ICT Model 11 Expansion and Reversal Rules
Model 11 is primarily taught as a continuation framework, but ICT adds an advanced variation. Once the anticipated external objective (or “terminus”) has been reached, he says the directional narrative can change. At 25:03, he discusses looking for a reversal and retracement after the original downside destination has been met.
This distinction matters: the countertrend version is not simply an attempt to fade an active expansion. ICT says it should be considered only after the original move reaches its intended area and price displays behavior he interprets as a reversal. He also characterizes this application as requiring more experience.
ICT Model 11 Trade Management and Limitations
ICT repeatedly discourages trying to capture every part of a move. He discusses taking a predefined amount, reducing exposure and potentially retaining only a smaller remainder. Near an external target, he favors exiting before the exact level because spreads and differences among retail price feeds may affect execution. That discussion begins around 49:04.
The lesson also includes aggressive hypothetical risk and compounding examples. Those projections are arithmetic illustrations rather than documented performance, and the transcript supplies no tested win rate, complete trade record, costs or evidence supporting the projected returns. They should not be read as realistic assurances.
More cautiously, ICT explicitly acknowledges at 10:18 that the model will produce losing trades. He recommends reviewing historical examples, then conducting walk-forward observation and paper study before taking action. He also says no single model answers every market condition.
Watch the ICT Model 11 Day Trading Lesson
This embedded player was loaded from a BestProps page on 14 September 2026 and advanced past eighteen seconds of playback at the recording’s own duration of about fifty-nine minutes, so the lecture can be watched in place. The timestamp links above point at the passages being described.
ICT Model 11 Sources and Further Reading
- The original Inner Circle Trader recording The timestamp links above are the passages being described; the lecture runs about fifty-nine minutes.[1]
- Investor.gov (U.S. Securities and Exchange Commission): Day Trading The SEC's investor-education page on short-horizon trading, which states that day trading is extremely risky and can result in substantial financial losses in a very short period of time; that is the frame this 30-pip-per-trade objective should be read in.[2]
- CFTC Learn & Protect (forex frauds) The U.S. derivatives regulator's own figure that two out of three retail foreign exchange traders lose money each quarter, relevant because the case study here is a currency pair and the recording offers no verified results.[3]
- 17 CFR 4.41 (advertising by commodity pool operators, commodity trading advisors, and the principals thereof) The rule requiring the disclosure that results based on simulated or hypothetical performance have inherent limitations, and that such programs are designed with the benefit of hindsight; cited because the recording's compounding arithmetic is an illustration rather than an audited record.[4]
None of the reading above is an ICT publication, none of it endorses or tests Model 11, and none of it is offered as evidence for the framework’s reasoning or for any outcome. Any ICT, smart-money or third-party indicator, script, note set, spreadsheet or social summary circulating outside the publishing channel’s own upload page is unofficial and untested here. The regulatory links are included because the recording sets out targets and risk arithmetic, not because they validate them.
ICT Model 11 Day Trading Takeaways
The transferable lesson is a structured top-down process: define context before searching for an entry, avoid chasing the first directional move, and specify both an invalidation concept and an exit plan in advance. Model 11’s distinctive ICT formulation is weekly expansion, daily external liquidity and an intraday retracement into internal liquidity.
Whether those concepts offer useful predictive information requires independent testing with clearly defined rules, transaction costs and out-of-sample data. The video itself is an educational explanation and chart case study, not sufficient evidence of profitability. Nothing here is investment advice or a recommendation to trade currencies or any other market.


