
Key takeaways
ICT Charter Price Action Model 10 is a swing-trading framework targeting approximately 50 to 75 pips per week by aligning trades with anticipated weekly expansion and external range liquidity outside a defined dealing range.
Read the full summary
ICT Charter Price Action Model 10 is a swing-trading framework targeting approximately 50 to 75 pips per week by aligning trades with anticipated weekly expansion and external range liquidity outside a defined dealing range. Its three components are weekly directional bias, a Monday, Tuesday, or Wednesday setup anchor, and a run on external liquidity. Bearish setups sell only after price exceeds a previous high, then cover below an old or newly formed short-term low, while bullish setups buy below a previous low and exit above an old or newly formed short-term high. ICT links the pattern to Turtle Soup, premium pricing, weekly order blocks, fair value gaps, liquidity voids, round-number divisions, and optional kill-zone timing. Trade management can use two partial exits followed by full closure at the third profit event, or one partial followed by a complete second exit, with percentages left to the trader and prominent older liquidity levels potentially taking precedence over newer short-term levels. The logic can be studied on lower time frames, single highs or lows and double tops or bottoms can serve as references, and Thursday's New York open may be considered for bearish profit-taking. ICT recommends journaling 10 sell examples and optionally 10 buy examples across forex, stocks, and commodities, while warning that Model 10 is a study foundation rather than a complete system and it supplies no testing statistics, transaction costs, position-sizing rules or full risk parameters, touching risk management only in passing.
How we researched this article
BestProps used document-based research from primary firm sources, checked September 24, 2026. The complete source list, scope, limitations, and commercial-state record appear near the end of this article.
In ICT Charter Price Action Model 10 – Swing Trading, ICT presents a framework for aligning entries and exits with an anticipated weekly direction. The model centers on what ICT calls external range liquidity: prior highs and lows located outside a defined dealing range.
ICT introduces the lesson as a swing-trading model intended to seek approximately 50 to 75 pips per week, while stressing that the framework is not confined to that target or to one chart interval. This is a stated objective within the teaching, not evidence of expected performance.
ICT Model 10 Swing Trading Components
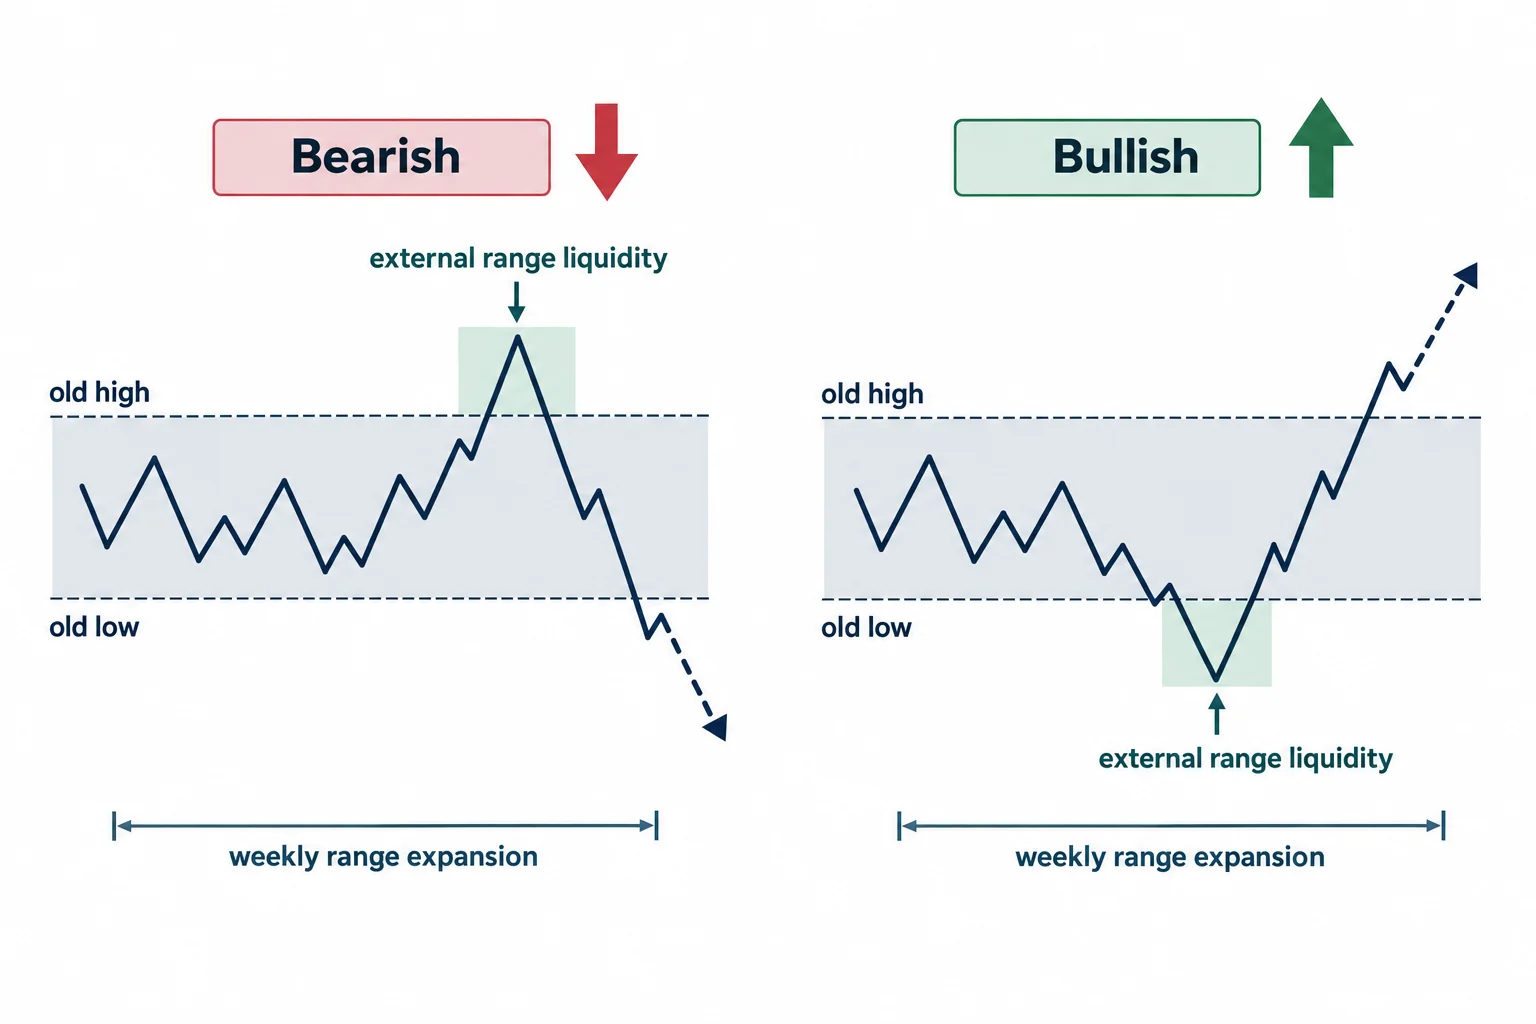
At 1:29, ICT reduces the model to three main components:
- Stage: anticipated weekly range expansion.
- Setup timing: an anchor point expected on Monday, Tuesday, or Wednesday.
- Pattern: a run on external range liquidity.
The first task is therefore directional analysis. ICT seeks to estimate whether the current or next weekly candle is more likely to expand upward or downward. The entry is then framed around a move through an old high or low in the direction opposite that weekly expectation. An opposing pool of external liquidity supplies the proposed exit area.
In a bearish scenario, ICT looks for price to move above a prior short-term high before selling. The position is then covered below an old low or a newly formed short-term low. A bullish application reverses the logic: price first trades below an old low, and profits are considered above old or newly formed highs.
ICT Model 10 Bearish Price Range Example
Beginning at 2:54, ICT discusses a British pound example that he identifies as a four-hour chart from around September 2018. He asks viewers to consult the weekly chart for the broader bearish context, including what he labels a weekly bearish order block.
Within the illustrated dealing range, his preferred sell area appears after price runs above an earlier high and enters what he regards as premium pricing. He also mentions a fair value gap or liquidity void and suggests examining institutional-style round-number divisions (such as large figures, mid figures, and “five” levels) inside that area. The transcript does not expose the chart’s full price scale, so an exact entry cannot be reconstructed from the audio alone.
The upload date and the period discussed in the lesson are not the same. The video was published on 8 February 2024, but at 16:25 ICT dates the release of Model 10 to Saturday 16 February 2019 and refers back to the analysis week of 15 February 2019, and the worked example is a British pound study from around September 2018. The chart walkthrough is therefore a 2019-era commentary presented in a later upload, not a session from 2024.
ICT explicitly cautions at 5:49 that these price-action models are foundations, not complete trading systems or plans. His stated purpose is to give students a recurring premise to study before they develop detailed rules.
ICT Model 10 Trade Entries and Exits
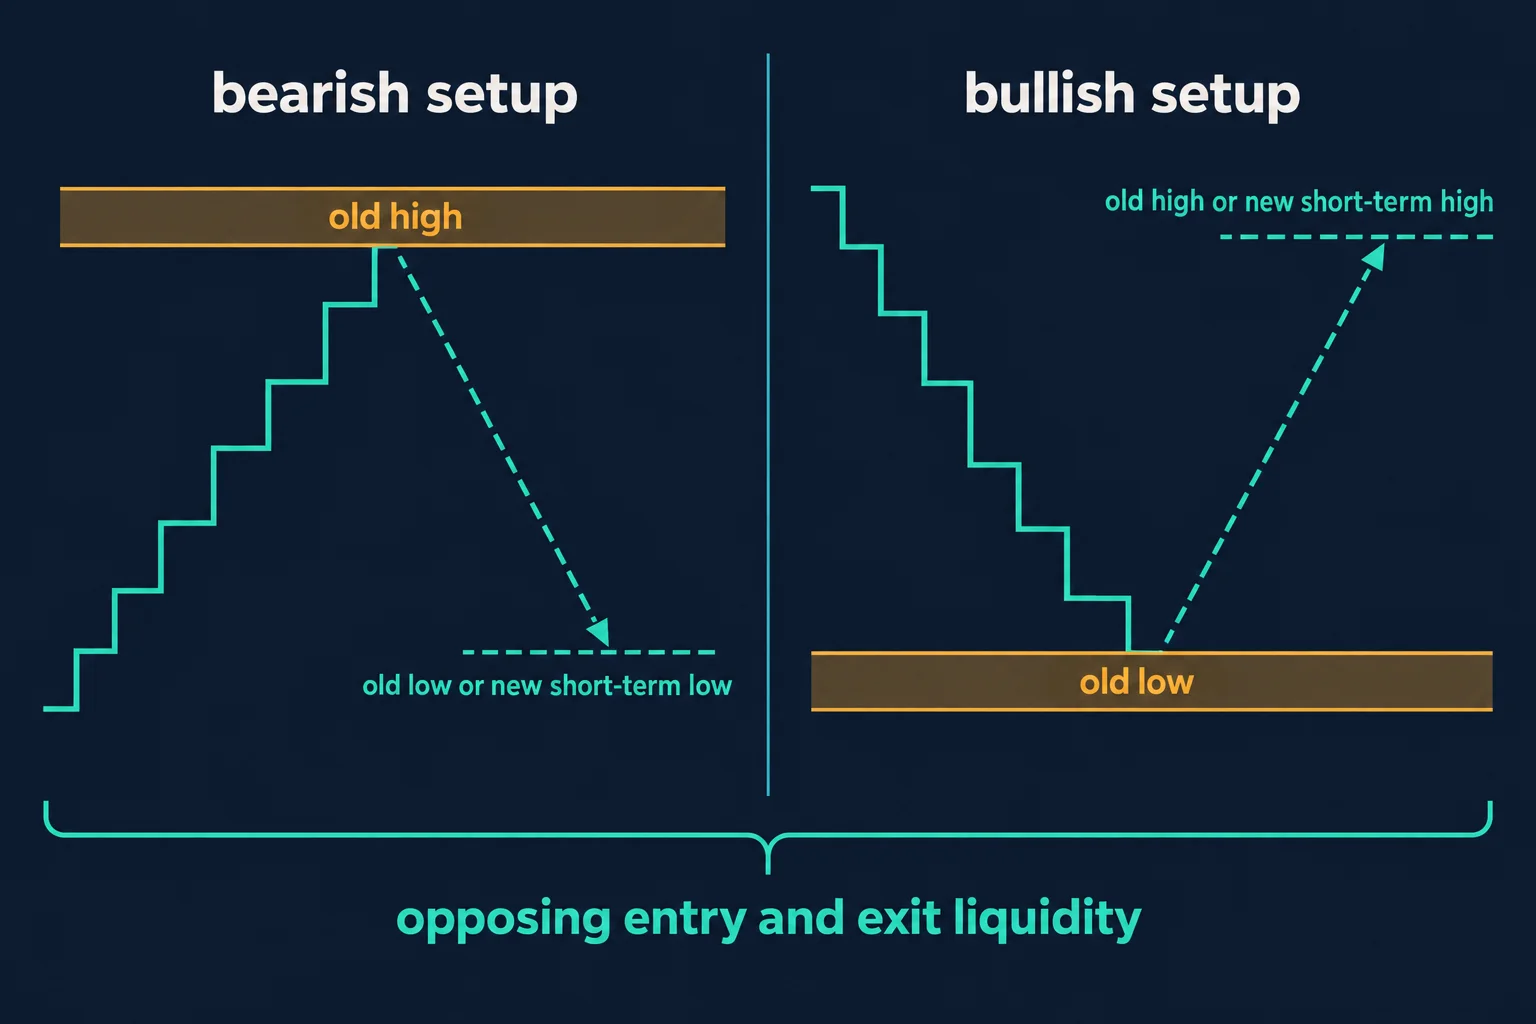
The core rule is explained especially clearly from 9:19. ICT relates the setup to his “Turtle Soup” terminology:
- When bearish, consider a short only after price trades above a previous high.
- Cover the short only after price trades below an old low or a newly established short-term low.
- When bullish, consider a long below a previous low.
- Exit the long above an old high or a newly established short-term high.
In ICT’s interpretation, this makes entries and exits opposing in nature. A bearish setup enters around liquidity above highs and exits around liquidity below lows; a bullish setup does the reverse. This is a conceptual market-reading framework attributed to ICT, not a demonstrated market law.
ICT Model 10 Swing Trade Management
From 10:40, ICT describes taking partial profits as successive short-term lows are breached during a short, or as successive highs are breached during a long. One rule he offers is to take two partial exits and close everything at the third profit event. He also permits a simpler structure consisting of one partial followed by a complete second exit.
Later, he gives other hypothetical allocations, including removing half at the first objective and dividing the balance between later objectives. He repeatedly says that partial-position percentages are personal. These examples describe the lesson’s structure; they do not establish that any allocation controls risk or produces a particular result.
ICT also distinguishes nearby short-term liquidity from more prominent older levels. At 27:07, he says old lows to the left may take precedence over a newly created short-term low when managing a bearish position. The equivalent principle applies to old highs during a bullish move.
ICT Model 10 Intraday Price Action
Although labeled a swing model, ICT says the same logic can be studied on lower time frames. Around 15:13, he describes looking for a single high or double top to be exceeded in a bearish market, ideally during one of his designated “kill zones” and on a day consistent with the anticipated weekly continuation.
He presents Monday through Wednesday as preferred setup days and discusses Thursday’s New York open as a possible profit-taking window in a bearish weekly scenario. These are ICT’s timing interpretations , not independently verified tendencies. Double tops and bottoms are not mandatory: the lesson says a single prior high or low can define the liquidity reference.
How ICT Recommends Studying Model 10
ICT closes by assigning chart-review work at 29:23. He asks viewers to find ten sell examples, record them in a study journal, and optionally add ten buy examples. He suggests examining markets beyond foreign exchange, including stocks and commodities.
A cautious educational adaptation would be to annotate historical charts without assuming fills at the exact high or low. Record the higher-time-frame directional premise, the range-defining high and low, the external-liquidity run, and each subsequent opposing level. The lesson touches risk management only in passing: it warns at 12:21 against ultra-tight five- or ten-pip stops once two partials have been taken, and it leaves partial percentages to the trader. It supplies no testing statistics, transaction costs, position-sizing rules or complete risk parameters, so the pattern should not be treated as a ready-made trading plan.
Watch the original recording
This embedded player was loaded from a BestProps page on 14 September 2026 and advanced past nineteen seconds of playback at the recording’s own duration of about thirty-two minutes, so the lesson can be watched in place. The timestamp links above point at the passages being described.
Primary source and further reading
- The original Inner Circle Trader recording — the timestamp links above are the passages being described; the lesson runs about thirty-two minutes.[1]
- Investor.gov (U.S. Securities and Exchange Commission) — Day Trading — the SEC’s investor-education page, which states that day trading is extremely risky and can result in substantial financial losses in a very short period of time; the same caution applies to the short-horizon swing targets discussed here.[2]
- CFTC Learn & Protect — forex frauds — the U.S. derivatives regulator’s own finding that two out of three retail foreign exchange traders lose money each quarter, relevant because the worked example here is a currency pair and the lesson offers no verified results.[3]
- 17 CFR 4.41 — advertising by commodity pool operators, commodity trading advisors, and the principals thereof — the rule requiring disclosure that simulated or hypothetical performance results have inherent limitations and that such programs are designed with the benefit of hindsight; cited because the pip targets and partial-exit examples in this lesson are illustrations rather than an audited record.[4]
None of the reading above is an ICT publication, none of it endorses or tests Model 10, and none of it is offered as evidence for the framework’s reasoning or for any outcome. Any ICT, smart-money or third-party indicator, script, note set, spreadsheet or social summary circulating outside the publishing channel’s own upload page is unofficial and untested here. The regulatory links are included because the lesson sets out pip targets and staged exits, not because they validate them.
ICT Model 10 Swing Trading Takeaways
Model 10 is a directional framework built around trading outside a recent range. In ICT’s bearish formulation, price runs above a prior high before moving toward lows; in the bullish formulation, it runs below a prior low before moving toward highs. The model’s most useful educational feature is its symmetry: the same type of structure used to frame entry also identifies opposing areas for staged exits.

